
0 ITEMS

Breakfast Restaurant Financial Model Excel Template
The Breakfast Restaurant Financial Model helps users turn a breakfast, brunch, cafe, diner, or mobile breakfast concept into a structured financial forecast. Instead of building a spreadsheet from scratch, entrepreneurs and planners can start with a ready-to-use model designed around the revenue drivers, cost categories, staffing needs, and operating realities of a food service business. It supports financial planning by connecting customer volume, average check size, menu sales, ingredient costs, payroll, overhead, startup costs, and funding needs into one editable forecast. This template is useful for founders, restaurant owners, consultants, analysts, and anyone preparing a business plan, investor presentation, loan application, or internal budget. It helps users estimate how much capital may be required before launch, what monthly revenue could look like under realistic assumptions, how operating expenses may affect margins, and whether the business can reach sustainable profitability. The model is built to support practical decision-making, including pricing strategy, staffing levels, expense control, capacity planning, and cash flow management. The Breakfast Restaurant Financial Model includes tools for reviewing revenue assumptions, comparing scenarios, visualizing key performance indicators, preparing lender-friendly reports, and evaluating investor return metrics. Users can adjust assumptions to reflect their own location, menu mix, customer traffic, weekend brunch demand, beverage sales, ingredient pricing, labor plan, rent, utilities, marketing spend, and other operating details. The template is designed to make the planning process easier for both finance and non-finance users while still producing professional outputs suitable for stakeholders. By organizing the financial picture in one model, the template helps buyers understand the path from launch to profitability. It can be used to test low, base, and high scenarios, review cash flow timing, analyze break-even points, and assess whether the planned breakfast restaurant can cover its fixed and variable costs. Whether the goal is to validate a new idea, secure funding, improve an existing plan, or communicate the numbers clearly, this financial model template gives users a practical framework for building a more confident restaurant forecast.


Financial Model Overview
The Breakfast Restaurant Financial Model is a ready-to-use financial model template built for planning, launching, funding, and managing a breakfast restaurant, brunch concept, cafe, diner, or mobile breakfast operation. It gives entrepreneurs, business owners, consultants, and analysts a structured way to estimate revenue, startup investment, operating expenses, payroll, cash flow, profitability, and return metrics without starting from a blank spreadsheet. The model is designed to be editable, so users can replace the built-in assumptions with their own prices, customer traffic, menu mix, labor structure, rent, supplier costs, and launch budget. For a breakfast business, the financial drivers can vary significantly between weekday morning traffic, weekend brunch demand, beverage sales, specialty items, and catering or event opportunities. This template brings those drivers into one organized planning tool, helping users evaluate whether the concept can generate enough sales to support its cost structure, reach break-even, and present a credible financial plan to lenders, investors, partners, or internal decision-makers.
All-in-One Dashboard
The all-in-one dashboard gives users a central view of the Breakfast Restaurant Financial Model by bringing the most important assumptions and outputs into one place. Instead of moving through multiple spreadsheet tabs to understand the plan, users can review core inputs such as customer volume, average check, revenue assumptions, cost percentages, payroll estimates, startup funding, and operating expense assumptions alongside key outputs such as sales, gross profit, EBITDA, net profit, cash balance, and return metrics. This component is useful because a breakfast restaurant depends on several connected drivers, including weekday covers, weekend brunch volume, pricing, food cost, labor scheduling, and fixed overhead. The dashboard helps users see how changes in these assumptions flow through the forecast and affect the overall financial picture. It is especially valuable for fast reviews during business planning, investor discussions, lender meetings, or internal decision-making because it presents the model’s most important insights in a clear and practical format.
Low, Base, and High Scenario Analysis
The low, base, and high scenario analysis component helps users test how the breakfast restaurant may perform under different market and operating conditions. A single forecast can create a false sense of certainty, so this section allows users to compare a conservative case, an expected case, and an upside case using different assumptions for customer traffic, average check size, menu sales, cost inflation, staffing levels, and operating margins. For example, a low scenario may reflect slower weekday demand, weaker weekend brunch turnout, higher ingredient costs, or delayed customer adoption, while a high scenario may reflect strong local awareness, successful promotions, larger average tickets, and better capacity utilization. The outputs help users compare the impact on revenue, profit, cash flow, funding needs, and overall business resilience. This is useful for risk planning, investor conversations, and management decisions because it shows how sensitive the restaurant’s financial outcomes are to the assumptions that matter most.
Professional Charts
The professional charts component turns the forecast into visual outputs that are easier to understand, present, and discuss with stakeholders. Breakfast restaurant financial planning often includes many detailed line items, but owners, investors, lenders, and partners usually need a concise view of trends and performance. This section can display key items such as revenue growth, gross margin, operating expenses, EBITDA, net income, cash balance, cost structure, and other performance indicators over the forecast period. By converting model outputs into presentation-ready charts, users can quickly communicate whether sales are growing, whether costs are controlled, whether profitability is improving, and whether the business has enough liquidity to operate safely. This is valuable for pitch decks, business plans, loan packages, board updates, and internal reviews because it makes the financial story more accessible. Instead of relying only on spreadsheet rows, users can show the direction of the business and support decisions with clear visual evidence.
ROE Components and DuPont Analysis
The ROE components and DuPont analysis section helps users evaluate the drivers behind return on equity and overall financial performance. Rather than looking only at net profit, this component breaks return into underlying factors such as profitability, asset efficiency, and financial leverage. For a breakfast restaurant, this can help owners and investors understand whether returns are being driven by healthy margins, efficient use of equipment and startup assets, or the structure of debt and equity financing. Inputs may include net income, revenue, assets, equity, debt levels, and balance sheet assumptions, while outputs may include return on equity and related financial ratios. This section is useful for investor communication because it goes beyond surface-level profit projections and shows how effectively the business converts its capital base into returns. It can also help users compare strategic options, such as investing in more equipment, expanding capacity, taking on debt, or improving margins through pricing and cost control.
Revenue Inputs
The revenue inputs section is where users define the commercial assumptions that drive the Breakfast Restaurant Financial Model. This component may include customer covers by day type, weekday versus weekend demand, average check size, menu pricing, beverage sales, specialty item sales, catering or event revenue, growth rates, seasonality, and ramp-up assumptions after launch. Because breakfast businesses often have different demand patterns throughout the week, this section is especially important for modeling realistic sales expectations. A Saturday brunch service with higher average checks may produce very different economics than a midweek breakfast window focused on coffee and quick meals. The revenue input section lets users adjust assumptions to match their own location, menu, hours, service style, customer base, and marketing strategy. The outputs feed directly into monthly and annual revenue forecasts, profitability calculations, cash flow projections, and funding requirements, making this component one of the most important parts of the model for planning and decision-making.
Bank-Ready Reports
The bank-ready reports component organizes the forecast into financial outputs that lenders, investors, and professional stakeholders can review more easily. A breakfast restaurant seeking financing may need to show projected income statements, cash flow statements, balance sheet assumptions, debt service capacity, startup investment, operating performance, and repayment ability. This section helps translate the working model into structured reports that support loan applications, funding discussions, business plans, and stakeholder presentations. Inputs from the revenue forecast, cost assumptions, payroll plan, startup budget, and financing structure flow into the reports automatically, reducing the need to manually rebuild summaries for each audience. This is useful because lenders are typically focused on whether the business can generate enough cash to cover operating expenses, debt payments, and working capital needs, while investors often want to understand profitability, growth, and returns. The reports help present the breakfast restaurant’s financial plan in a polished, organized, and credible format.
Revenue Breakdown
The revenue breakdown component gives users a more detailed view of how total revenue is built across different streams, customer segments, or service periods. For a breakfast restaurant, revenue may come from weekday breakfast traffic, weekend brunch, coffee and beverages, specialty menu items, takeout, delivery, catering, private events, or seasonal promotions. This section helps users avoid relying on one broad sales number by showing the contribution of each revenue stream to the total forecast. Inputs may include pricing, order volume, average spend, sales mix, frequency, growth rates, and seasonality for each category. The outputs help users identify which parts of the business are expected to generate the most sales, which are most profitable, and which may need operational support or marketing attention. This is valuable for menu planning, capacity planning, staffing, supplier purchasing, and investor communication because it shows the logic behind the revenue forecast and helps users refine their strategy based on the strongest income drivers.
KPI Dashboard
The KPI dashboard provides a focused view of the performance metrics that matter most for running and evaluating a breakfast restaurant. Key performance indicators may include average check, daily covers, revenue per customer, gross margin, food cost percentage, labor cost percentage, EBITDA margin, net profit margin, cash balance, payback period, break-even timing, and revenue growth. This component helps users monitor whether the business is operating within the assumptions used in the financial plan and whether performance is improving over time. For example, if labor cost as a percentage of revenue rises too high, the owner may need to adjust scheduling, menu pricing, or service hours. If average check size is below expectations, the model may highlight the need for upsells, bundles, beverage promotions, or menu redesign. The KPI dashboard is useful for ongoing management, funding presentations, and strategic reviews because it condenses detailed financial statements into practical metrics that support faster decision-making.
Startup and Operating Cost Planning
The startup and operating cost planning component helps users estimate the initial investment required to open the breakfast restaurant and the recurring expenses needed to keep it running. Startup costs may include kitchen equipment, furniture, fixtures, leasehold improvements, vehicle or mobile unit costs if applicable, signage, licenses, permits, deposits, initial inventory, technology systems, pre-opening marketing, professional fees, and working capital reserves. Operating expenses may include rent, utilities, insurance, payroll, payroll taxes, ingredients, packaging, delivery platform fees, marketing, maintenance, software, cleaning, accounting, and other recurring overhead. This section is useful because underestimating costs is one of the most common causes of early cash pressure in food service businesses. By organizing these assumptions clearly, the model helps users determine how much funding may be needed before launch, how monthly expenses affect profitability, and which cost categories should be monitored most closely after opening. It also supports budgeting, vendor negotiations, and funding discussions by showing the full cost structure behind the restaurant plan.
Break-Even and Cash Flow Forecasting
The break-even and cash flow forecasting component helps users understand when the breakfast restaurant may become self-sustaining and whether it can maintain enough liquidity during the launch and growth period. The break-even analysis compares projected revenue with variable costs, fixed expenses, payroll, and other operating requirements to estimate the sales level or timing needed to cover costs. The cash flow forecast then shows how money moves through the business month by month, including revenue collections, supplier payments, payroll, overhead, startup spending, financing proceeds, loan payments, taxes, and ending cash balances. This is especially important for a breakfast restaurant because even a profitable operation can face cash shortages if startup costs are high, sales ramp up slowly, inventory purchasing is poorly timed, or debt service begins before revenue stabilizes. This component helps users plan working capital, anticipate funding gaps, test whether the business has enough cushion, and make better decisions about pricing, staffing, marketing, and expansion timing.
File types:
Excel – Single-User: .xlsx
Excel – Multi-User: .xlsx
Similar ProductsOther customers were also interested in...


 HenrySheykin
Cafe Financial Model Excel Template
The Cafe Financial Model is a ready-to-use financial model template designed to help entrepreneurs, ... Read more
Gourmet Food Store Financial Model Excel Template
The Gourmet Food Store Financial Model helps entrepreneurs, founders, business owners, consultants, ... Read more
 Giorgos
All-day Restaurant and Bar – 5 Year Financial Mo...
Financial Model providing advanced financial planning & analysis for an All-day Restaurant &... Read more
 Pushkar
Pizzeria – 3 Statement Financial Model with ...
This Pizzeria business Plan Model is a perfect tool for a financial feasibility study on launching a... Read more
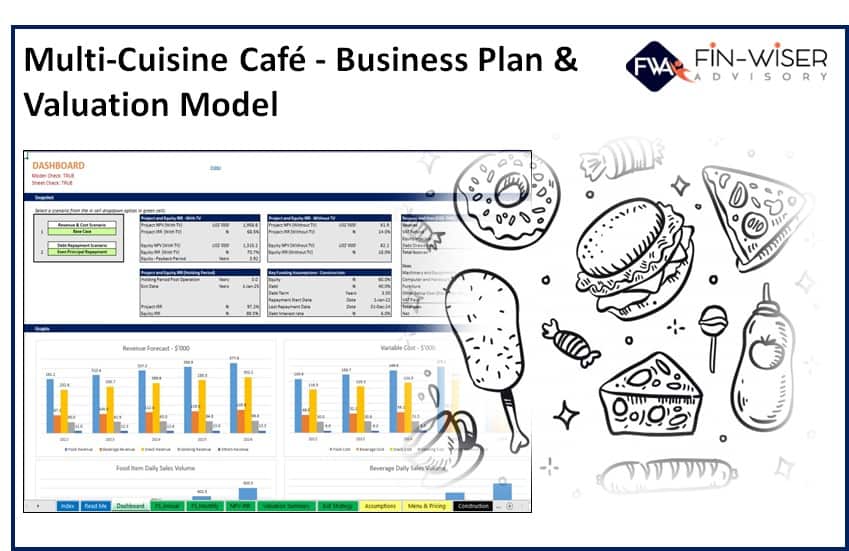
Multi Cuisine Cafe – 3 Statement Financial M...
This Multi-Cuisine Café business Plan Model is a perfect tool for a financial feasibility study on ... Read more

Golf & Entertainment Center – 5 Year Financi...
Financial Model providing an advanced 5-year financial plan for a startup or operating Golf & En... Read more
 MENA Research Partne...
Restaurant Financial Model: Adaptable to all Types...
Our full-fledged financial model in excel format has the functionality to run unlimited activity sce... Read more

 Peter Graf
The Customer-Centric Financial Model for Restauran...
Starting a restaurant without a financial plan is like driving a car blindfolded. You wouldn´t do i... Read more

Karaoke Lounge Financial Model
The idea of this Karaoke Lounge Financial Model is, that you offer 3 separate Karaoke rooms for litt... Read more
 IB Coach
Restaurant Financial Model
This Restaurant Financial Model is tailored for those who aim to start a business from scratch, and ... Read more
You must log in to submit a review.