
0 ITEMS

Excel Template using the RANK Function in Excel
Free to download Excel Template using the RANK Function applied in a financial model.
| All Industries, General Excel Financial Models |
| Excel, Free Financial Model Templates |

As you already know, the RANK function in Excel is a built-in function that helps determine the position or statistical rank of a numerical value in a list of numerical values. Basically, assigning a rank according to ascending (smallest to largest) or descending order (largest to smallest) order. Using the RANK function in Excel is very useful especially when sorting a business’s sales performance, expenses incurred per department, evaluating personnel performance, and assessing investments. Not only is it extremely beneficial when evaluating data but also in summarizing key results.
To provide you a reference on how to use the RANK Function in a financial model, please feel free to download this Excel Template using the RANK Function. This is completely FREE and very simple.
Similar ProductsOther customers were also interested in...



 eFinancialModels
Waterfall Profit Distribution Model (up to 4 Tiers...
We are introducing our 4-Tier Waterfall Profit Distribution Model. The waterfall profit distribution... Read more

Budget Template in Excel – Analysis in 4 Ste...
The Purpose of the 4 Step Budget Analysis Spreadsheet Template is to offer a user-friendly solution ... Read more

 Anuj
Private Equity Fund Model (Investor Cashflows)
The Private Equity Fund Cashflows Model helps LPs and GPs analyze fund cash flows, returns, and dist... Read more

 Giorgos
Advanced Financial Model with DCF and Valuation
Dynamic 10-Year Financial Model, suitable for any type of business, supporting strategic planning, i... Read more
 Pierre-AlexandreHeur...
Due Diligence P&L – Exhaustive Revenue a...
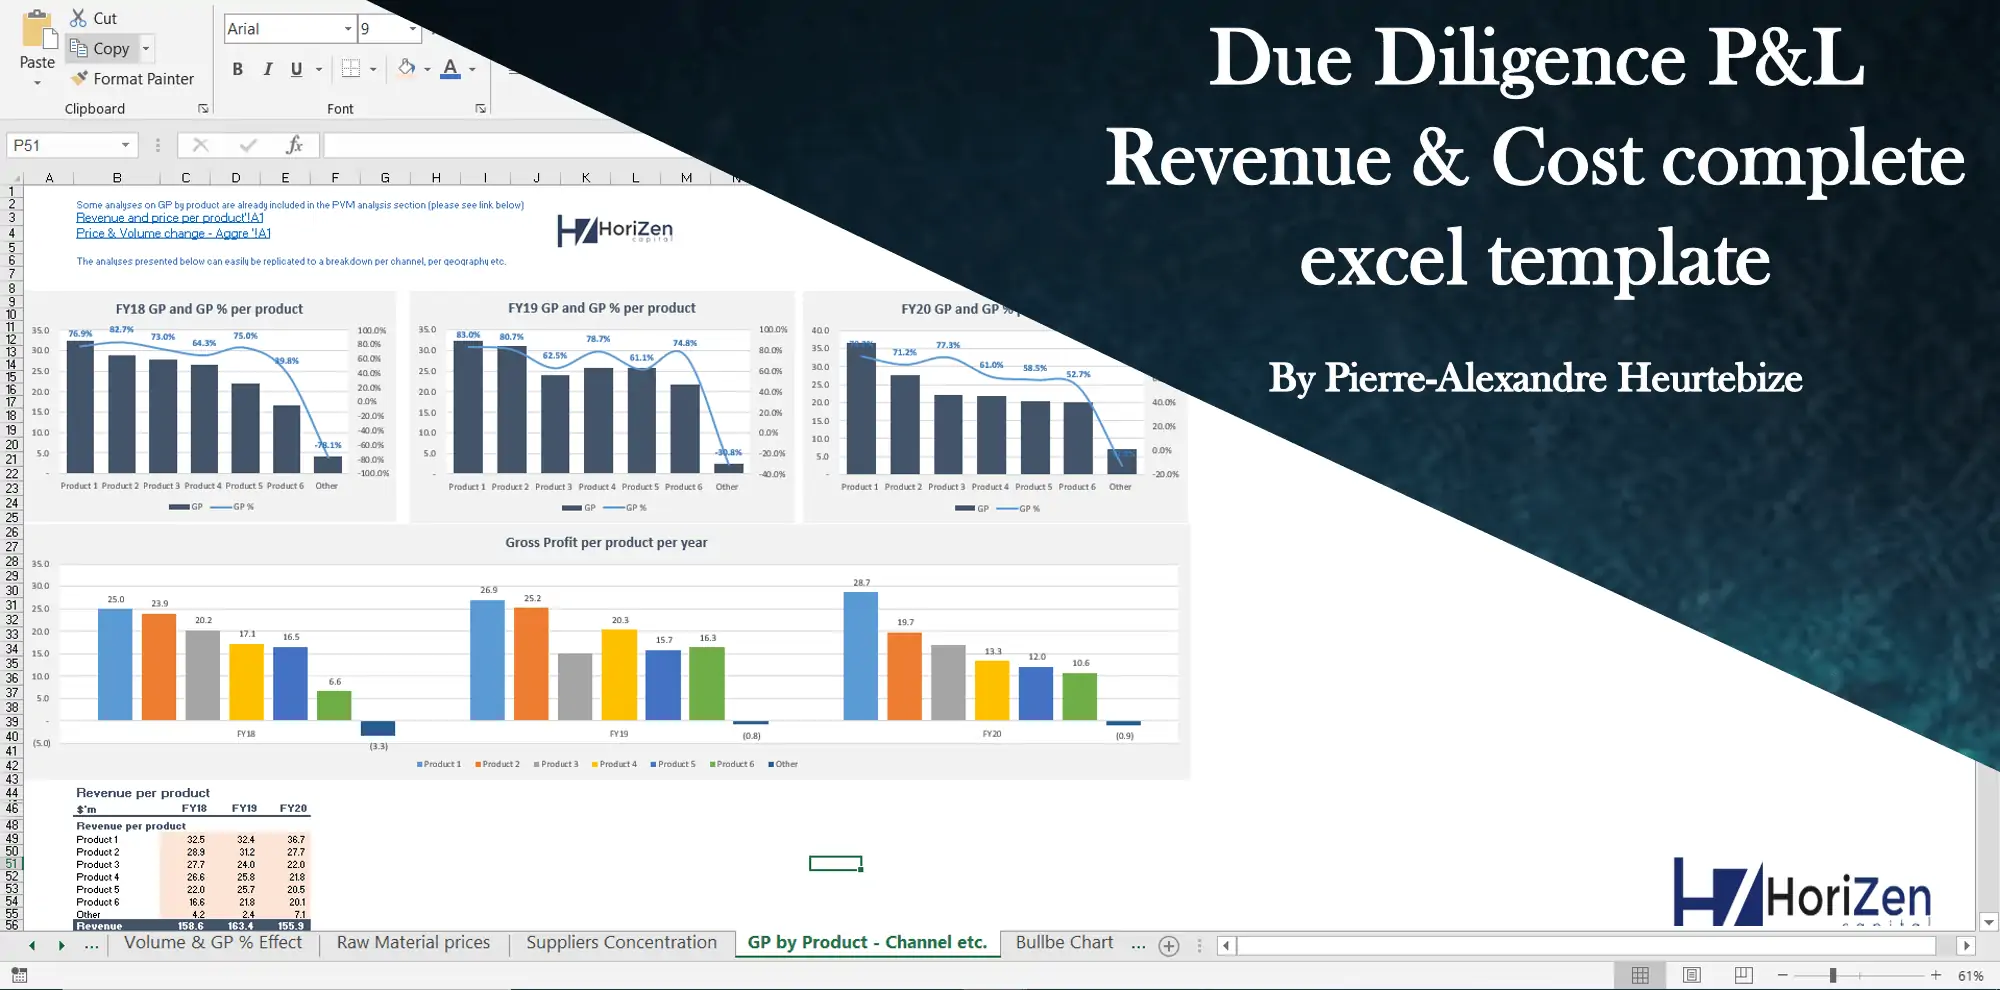
Model for in depth understanding of high level profit and loss and revenue analysis. Big-4 like chec... Read more

Investment Financial Models – All-in-One Bundle ...
A collection of templates suitable for investment decisions in various types of businesses/industrie... Read more

Startup Company Financial Model – 5 Year Fin...
Highly-sophisticated and user-friendly financial model for Startup Companies providing a 5-Year adva... Read more

General Financial Models – All-in-One Bundle
A collection of templates suitable for various types of businesses/industries, covering major accoun... Read more

 S. Pfankuch
Budget to Actual Comparison
This monthly budget-to-actual dashboard allows for at-a-glance performance analysis. In addition to ... Read more
You must log in to submit a review.