
0 ITEMS

5-Year Pro Forma for a Startup: Build Investor-Ready Projections

A 5-year pro forma is the financial story your startup tells investors before the revenue exists to tell it for you. Get the structure, assumptions, and math right, and it becomes your most powerful fundraising tool.
Key Takeaways
- 68% of investors actively discount pro forma earnings, so assumption transparency matters more than optimistic numbers (eFinancialModels, 2024).
- Investor and lender pro formas require a 3-to-5-year horizon, while internal planning typically needs only 12 months (Chalifour Consulting, 2024).
- Year 1 projections should show monthly detail; Year 2 quarterly; Years 3-5 annual, reflecting declining forecast precision.
- A credible 5-year pro forma includes 3 linked financial statements: income statement, balance sheet, and cash flow statement, plus startup-specific metrics like burn rate, runway, CAC, and LTV.
- Hockey-stick revenue curves, ignored working capital, and unsupported margin assumptions are the 3 most common credibility killers in startup pro formas.
- Conservative, moderate, and aggressive scenarios should be modeled simultaneously so investors can stress-test your assumptions.
- Your pro forma is a scenario-planning tool, not a prediction. Investors know this. Your job is to show disciplined thinking, not perfect foresight.
Why 5 Years? The Investor Timeline for Startup Pro Formas
Investors and lenders require a 3-to-5-year horizon because they need to see a plausible path to return on capital, not just next quarter’s burn rate. A 12-month projection tells an investor how you’ll spend their money. A 5-year projection tells them how they’ll get it back.
According to Chalifour Consulting (2024), pro forma statements for loan applications or investor pitches typically extend three to five years into the future, while a 12-month projection is often sufficient for internal planning and operational decisions. The gap between those two timeframes is intentional. Internal plans guide weekly decisions. Investor pro formas model the business at scale.
For seed and Series A rounds, the 5-year window maps directly to typical venture fund hold periods of 5 to 7 years. A VC investing today needs to see how your startup reaches an exit-worthy valuation within their fund lifecycle. A bank extending an SBA loan needs to see debt service coverage across the loan term. Both audiences require the same thing: a structured, assumption-backed view of where the business goes.
The practical implication: your 5-year pro forma is not a budget. It’s a financial model of your business thesis.
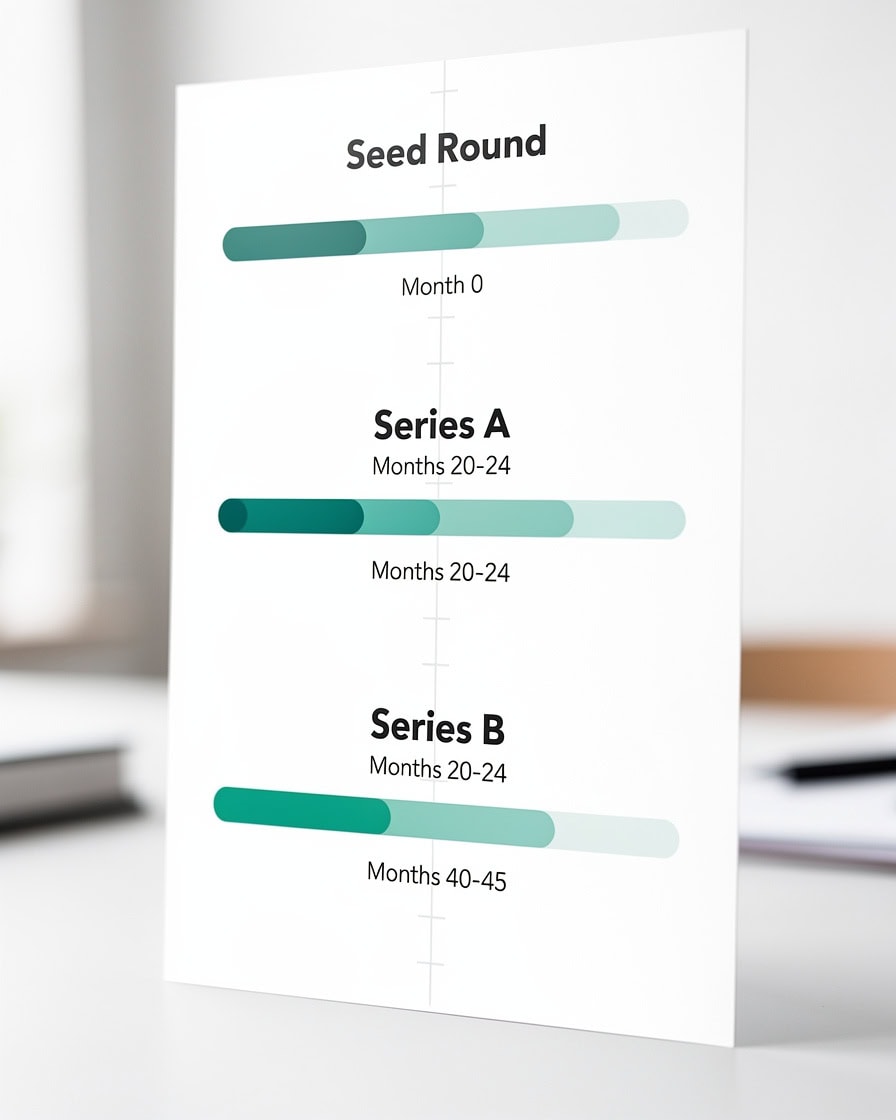
Venture fund hold periods of 5-7 years explain why investors require 5-year pro formas, not 12-month budgets.
The Core Components: What Belongs in a 5-Year Startup Pro Forma
A complete 5-year startup pro forma contains three linked financial statements plus a startup-specific metrics layer that corporate forecasts typically omit. Each statement feeds the next, so errors compound quickly if the structure isn’t built correctly.
Income Statement (Profit and Loss): Projects revenue, cost of goods sold (COGS, meaning the direct costs to deliver your product or service), gross profit, operating expenses, and net income across all 5 years. For startups, this statement will show losses in Years 1-2 and a path to profitability in Years 3-5 in most models.
Balance Sheet: Projects assets (cash, receivables, equipment), liabilities (debt, deferred revenue, accounts payable), and equity (founder contributions, investor capital, retained earnings). The balance sheet must balance: Assets = Liabilities + Equity. Startups often underestimate how equity builds through successive funding rounds.
Cash Flow Statement: The most critical statement for startups. It separates cash from accounting profit, showing operating cash flow, investing activities (equipment purchases, capitalized software), and financing activities (equity raises, loan proceeds). A startup can show accounting profit and still run out of cash if receivables pile up or inventory builds.
Startup-Specific Metrics Layer: This is what distinguishes a startup pro forma from a corporate forecast. Investors expect to see burn rate (monthly cash outflow before revenue covers costs), runway (months of cash remaining at current burn), customer acquisition cost (CAC, the total sales and marketing spend divided by new customers acquired), lifetime value (LTV, the total gross profit a customer generates over their relationship with you), and unit economics (the per-customer or per-transaction profitability). These metrics contextualize the three financial statements and give investors a framework for evaluating your growth efficiency.
You can explore ready-built startup financial models that include all three linked statements plus these metrics pre-wired.
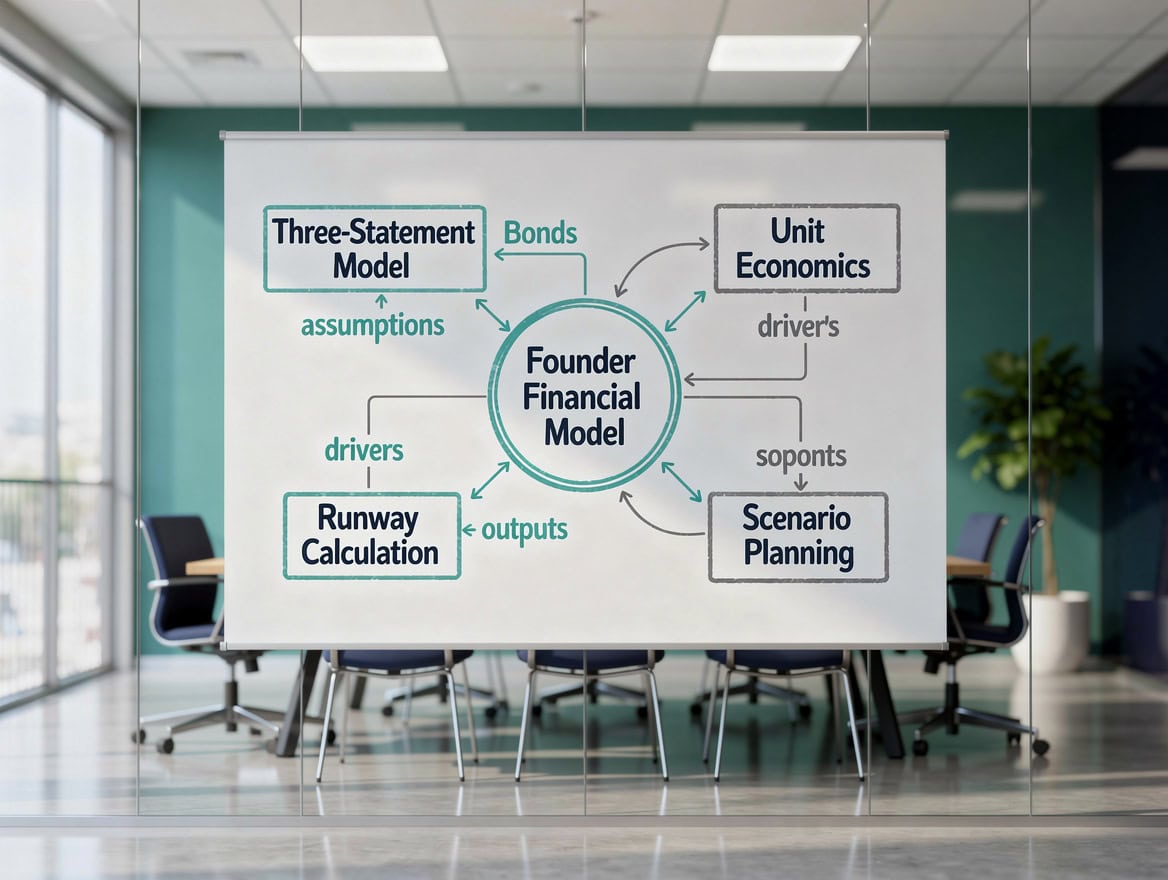
The three financial statements are linked: net income flows to equity on the balance sheet, and cash changes reconcile through the cash flow statement.
Year-by-Year Granularity: From Monthly to Annual Projections
The level of detail in your pro forma should decrease as the time horizon extends, because forecast precision naturally declines the further out you project. Showing monthly detail in Year 3 implies a false precision that experienced investors will immediately distrust.
The standard structure works as follows:
- Year 1: Monthly columns. Show every revenue line, every expense category, and ending cash balance for each of the 12 months. This is your operating budget and your investor’s primary due diligence tool.
- Year 2: Quarterly columns. Four quarters, each summarizing the monthly activity underneath. You can keep a monthly tab for internal use, but the investor-facing view shifts to quarterly.
- Years 3-5: Annual columns. One column per year. The assumptions driving these years should be documented explicitly because the numbers are directional, not operational.
This declining granularity structure signals financial maturity to investors. It shows you understand the difference between a plan and a projection.

Forecast granularity should decline with time horizon: monthly in Year 1, quarterly in Year 2, annual in Years 3-5.
Building Revenue Projections: Growth Rates, Unit Economics, and Customer Assumptions
Revenue projections are where most startup pro formas either earn or lose investor credibility. The method you use to build revenue should match your business model, and every growth assumption needs a documented rationale.
Chalifour Consulting (2024) references a straightforward example of forecasting based on an anticipated 10% growth in sales. That baseline is useful for established businesses, but startups need a more granular build-up approach.
The Bottom-Up Revenue Build: Instead of applying a percentage to last year’s revenue, build revenue from customer or unit assumptions. Here’s the math for three startup archetypes:
SaaS Startup Example:
- Month 1 customers: 50
- Monthly new customer adds: 30 (growing 5% per month)
- Monthly churn rate: 2%
- Average revenue per user (ARPU): $150/month
- Month 12 customers: 50 + (30 × 12 months, adjusted for churn) ≈ 380 active customers
- Month 12 MRR: 380 × $150 = $57,000
- Year 1 ARR run rate: $684,000
Product Startup Example:
- Average order value: $85
- Year 1 orders: 2,400 (200/month)
- Year 2 orders: 3,600 (50% growth, driven by retail channel expansion)
- Year 1 revenue: 2,400 × $85 = $204,000
- Year 2 revenue: 3,600 × $85 = $306,000
Service Startup Example:
- Billable hours per consultant: 1,200/year
- Blended hourly rate: $175
- Year 1 headcount: 3 consultants
- Year 1 revenue: 3 × 1,200 × $175 = $630,000
- Year 3 headcount: 8 consultants (hiring plan documented separately)
- Year 3 revenue: 8 × 1,200 × $175 = $1,680,000
For Years 3-5, you can apply percentage growth rates to the Year 2 base, but document the driver: new market entry, channel expansion, pricing increases, or headcount growth. A 40% Year 3 growth rate with no documented driver is a red flag. A 40% growth rate tied to a specific channel launch or geographic expansion is a business thesis.
Link your revenue projections to your customer acquisition assumptions so the two stay consistent as you update the model.
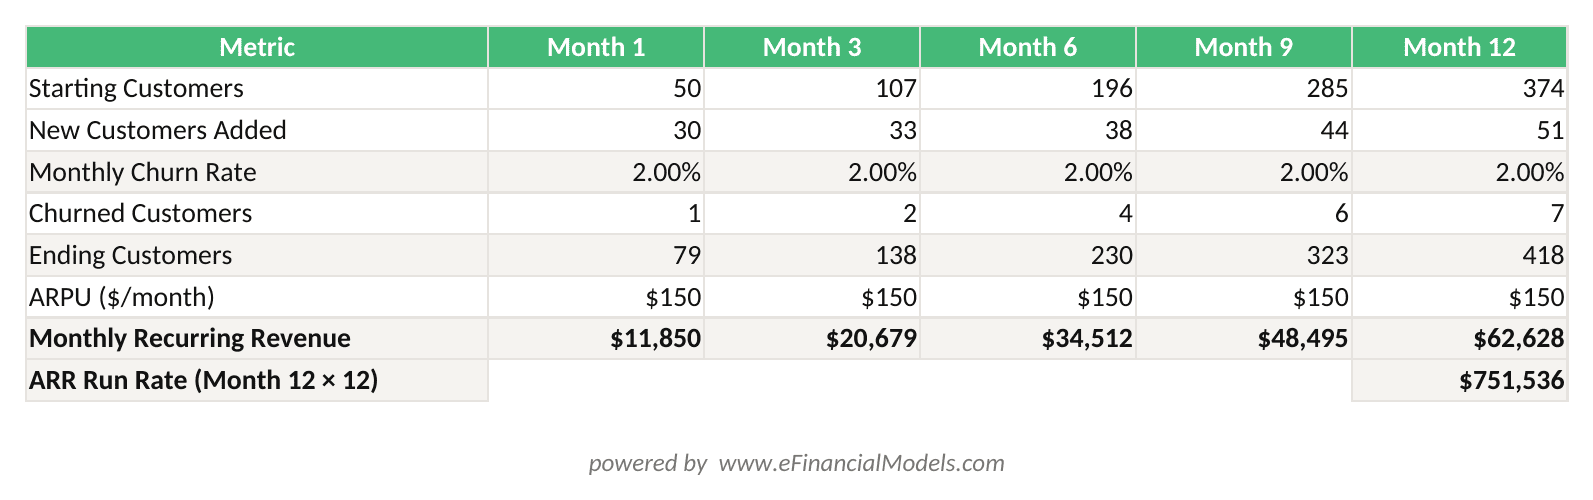
Bottom-up SaaS revenue model: starting customers + new adds – churned customers × ARPU = MRR. Month 12 MRR of $57,000 implies a $684,000 ARR run rate.

Revenue build-up methodology differs by business model: SaaS uses customer and churn math, products use order volume, services use billable headcount.
Expense Forecasting: From Burn Rate to Profitability Path
Expense forecasting for startups requires modeling two distinct phases: the pre-revenue burn phase and the scaling phase where expenses grow in proportion to revenue. Treating all 5 years identically is one of the most common structural errors.
Burn Rate is your monthly net cash outflow before you reach cash flow breakeven. Calculate it as: Total Monthly Cash Expenses minus Monthly Cash Revenue. A startup spending $80,000/month with $20,000 in revenue has a net burn rate of $60,000/month.
Runway is the number of months your current cash balance covers at the current burn rate: Cash Balance divided by Monthly Net Burn. With $600,000 in the bank and a $60,000 net burn, you have 10 months of runway. Investors want to see at least 18 months of runway post-funding in your Year 1 projections.
For expense benchmarks by category, early-stage SaaS companies typically allocate 40-60% of revenue to sales and marketing, 15-25% to research and development, and 10-20% to general and administrative costs, though these ratios compress significantly as revenue scales. Product startups carry higher COGS (often 40-60% of revenue) with lower S&M ratios. Service businesses invert this, with labor as the dominant cost.
Model your path to profitability explicitly. Show the month or quarter when gross profit first covers operating expenses (gross margin breakeven) and the separate point when operating cash flow turns positive. These are two different milestones, and investors track both.
You can track these metrics against actuals using performance tracking tools that connect your pro forma to live financial data.
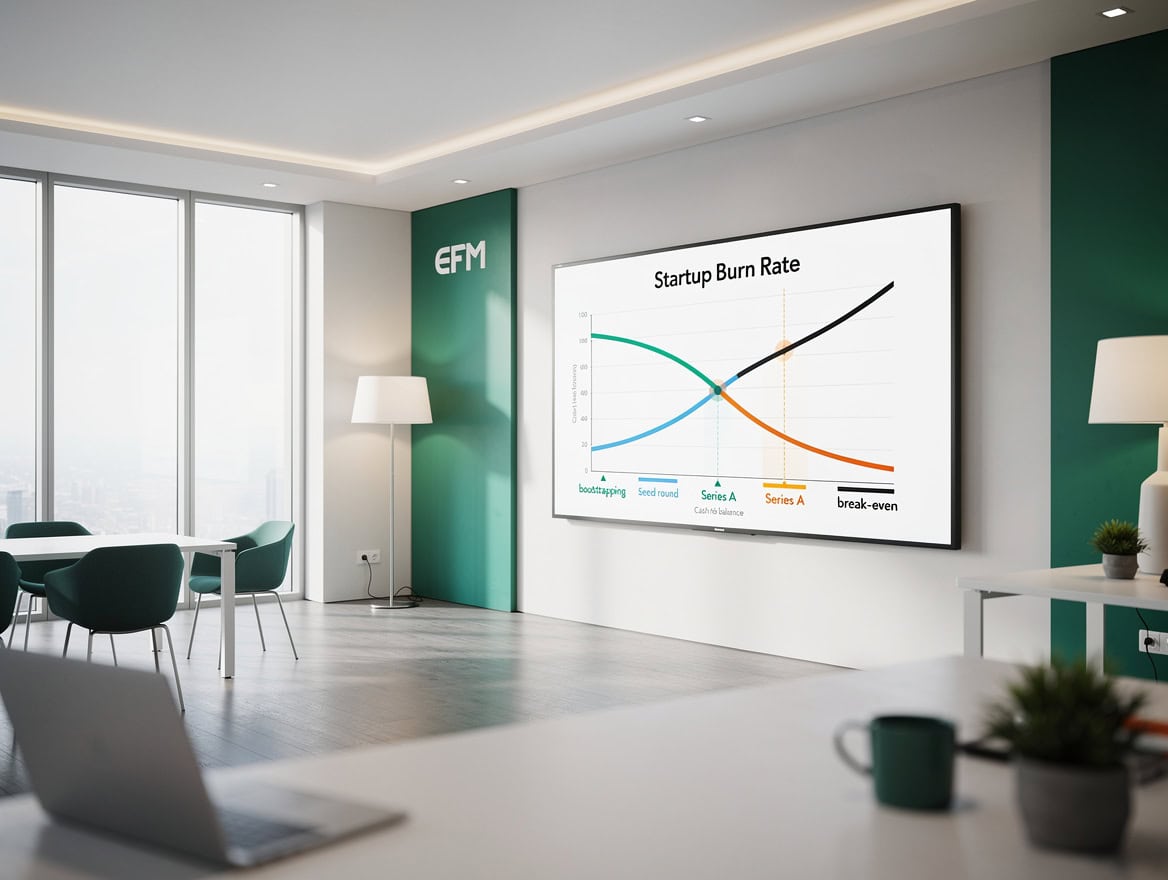
Burn rate modeling must show the funding bridge: investors need to see the business never goes cash-negative without a documented inflow.
Cash Flow Modeling: Runway, Funding Events, and Working Capital
The cash flow statement is where startup pro formas most often fail, because founders model profit without modeling cash timing. A business can be profitable on paper and insolvent in practice.
Working Capital is the difference between current assets (cash, receivables, inventory) and current liabilities (payables, accrued expenses). For a pre-revenue startup, working capital is essentially your cash balance. As revenue grows, working capital becomes more complex: if you invoice customers on Net 30 terms and pay suppliers on Net 15, you’re funding a 15-day cash gap out of your own balance sheet.
For a product startup carrying 60 days of inventory, a $100,000/month revenue run rate implies roughly $200,000 tied up in inventory at any given time. That’s working capital your pro forma must account for, or your cash flow projections will overstate available cash.
Modeling Funding Rounds: Show each anticipated funding event as a financing cash inflow in the period you expect to close it. A $1.5M seed round closing in Month 4 appears as a $1,500,000 inflow in the financing section of your Month 4 cash flow. Simultaneously, show the equity impact on your balance sheet: paid-in capital increases by $1,500,000, and you can note the implied dilution in your assumptions documentation.
For cash flow projections that automatically link operating, investing, and financing activities, pre-built templates save significant modeling time and reduce structural errors.
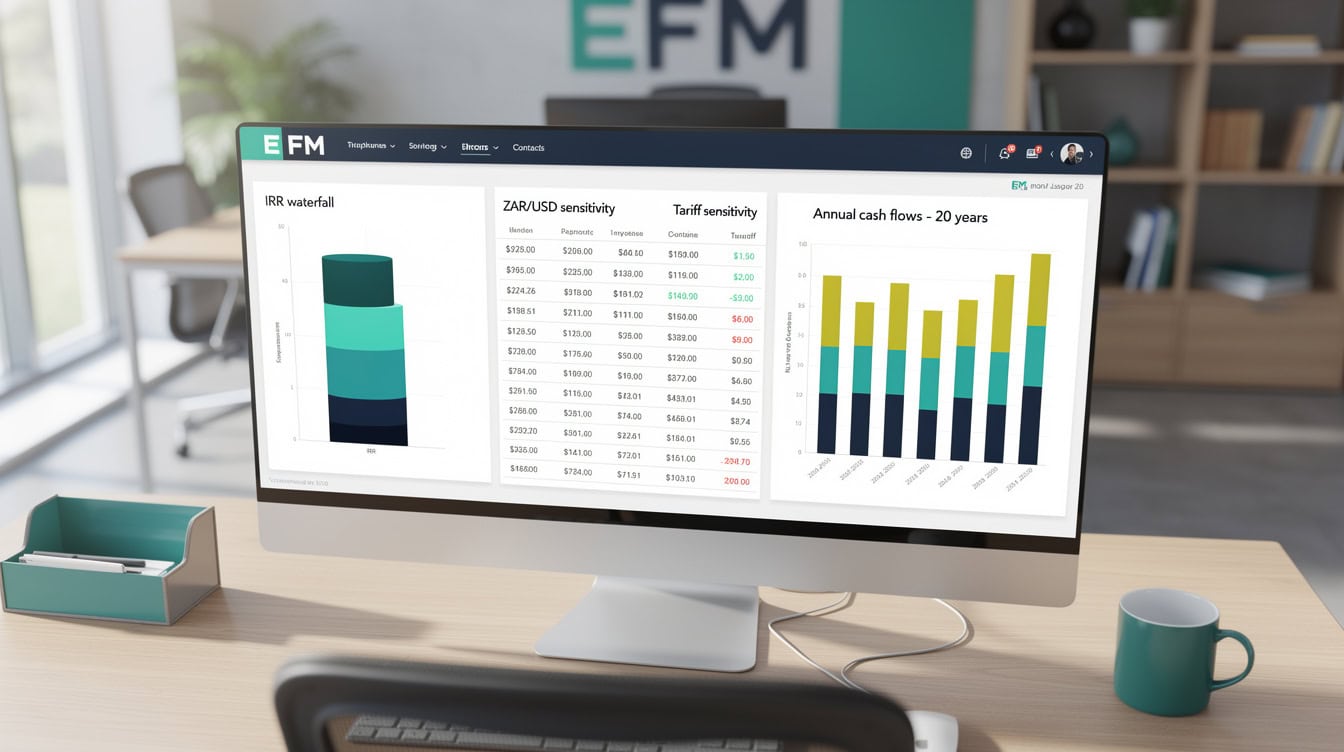
The cash flow statement separates operating burn from investing spend and financing inflows, revealing the true cash position at each period.
Startup-Specific Metrics Investors Expect in Your Pro Forma
Beyond the three financial statements, investors evaluating early-stage companies rely on a set of operational metrics that reveal the efficiency and scalability of your business model. These metrics should appear as a dedicated section or summary tab in your 5-year pro forma.
CAC (Customer Acquisition Cost): Total sales and marketing spend in a period divided by new customers acquired in that period. If you spend $30,000 on marketing in Q1 and acquire 150 new customers, your CAC is $200. Track this quarterly in Years 1-2 and annually in Years 3-5. Investors want to see CAC declining or stable as you scale, not rising.
LTV (Customer Lifetime Value): Average gross profit per customer multiplied by average customer lifespan. For a SaaS product with $150/month ARPU, 70% gross margin, and 24-month average customer life: LTV = ($150 × 0.70) × 24 = $2,520. The LTV:CAC ratio should be at least 3:1 for a venture-backable SaaS business.
LTV:CAC Ratio: With an LTV of $2,520 and a CAC of $200, the ratio is 12.6:1, which is strong. A ratio below 3:1 signals that your growth is destroying value, not creating it.
Payback Period: CAC divided by monthly gross profit per customer. With a $200 CAC and $105/month gross profit per customer ($150 × 0.70), payback period = $200 / $105 = 1.9 months. Investors in SaaS businesses typically want payback periods under 12 months.
Track these alongside your KPIs to give investors a complete operational picture alongside the financial statements.

Investors evaluate unit economics alongside financial statements: an LTV:CAC ratio above 3:1 and a payback period under 12 months signal a scalable model.
Documenting Assumptions: Making Your Pro Forma Defensible
68% of investors actively discount pro forma earnings, according to eFinancialModels (2024). That statistic doesn’t mean your projections are worthless. It means the assumptions behind your projections are what investors actually evaluate.
Every material assumption in your 5-year pro forma needs a documented rationale. Structure your assumptions documentation in three layers:
- Market-level assumptions: Total addressable market size, your target market share by Year 5, and the source for both figures. Use industry reports, government data, or comparable company disclosures, not back-of-envelope estimates.
- Business model assumptions: Pricing rationale (competitive benchmarking, value-based pricing analysis), gross margin targets (comparable public company benchmarks or your own unit cost analysis), and headcount-to-revenue ratios (industry norms for your business type).
- Operational assumptions: Sales cycle length, conversion rates at each funnel stage, customer churn rate, and the specific marketing channels driving CAC. Each of these should be tied to either early traction data or documented industry benchmarks.
Present three scenarios: conservative (your base case minus 30% on revenue, plus 15% on costs), moderate (your base case), and aggressive (your base case plus 30% on revenue). This shows investors you’ve stress-tested your model and aren’t anchored to a single outcome. It also gives them a range to work with when they apply their own discount.
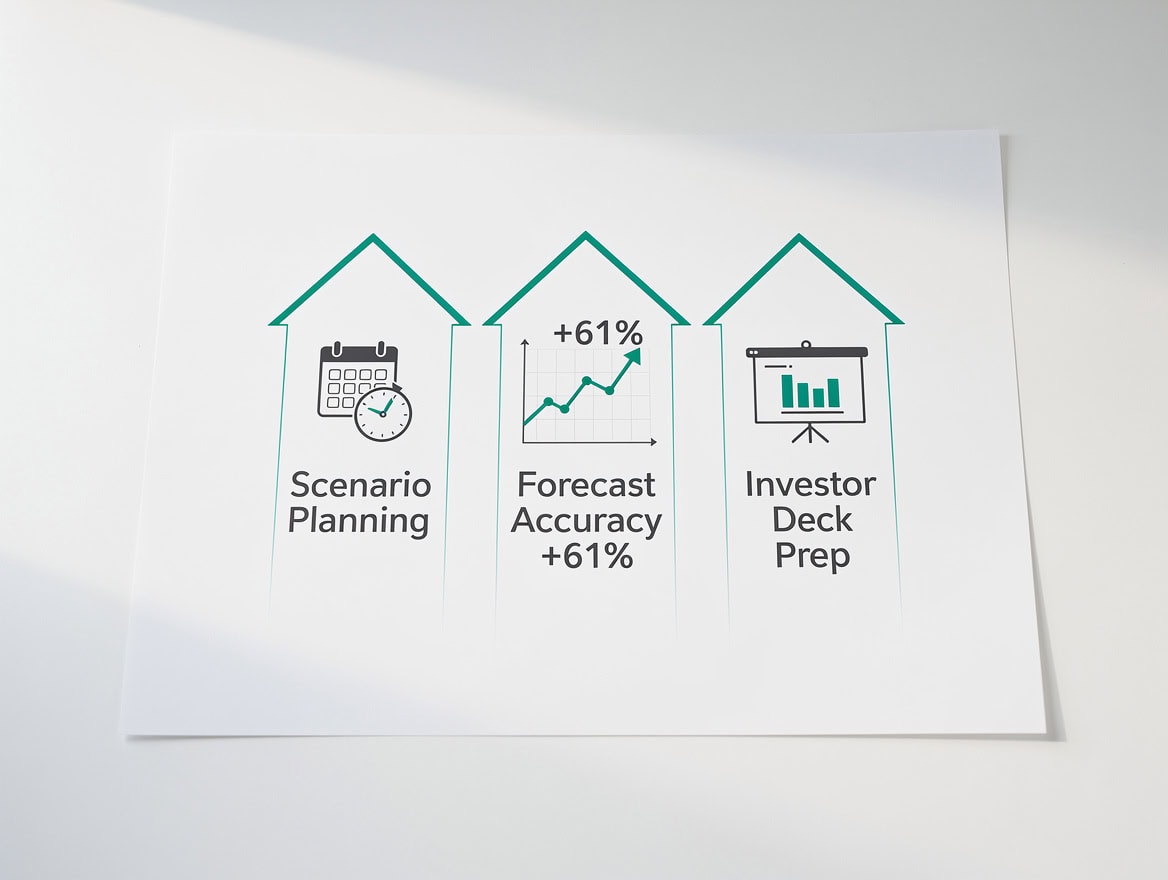
Presenting three scenarios shows investors you’ve stress-tested your model, which is more credible than a single optimistic projection.
Common Credibility Killers and How to Avoid Them
Certain patterns in startup pro formas immediately signal to investors that the founder hasn’t done rigorous financial modeling. Avoiding these five mistakes separates credible projections from wishful thinking.
1. Hockey Stick Revenue Curves: Revenue that’s flat for 18 months then suddenly triples in Year 3 with no documented operational trigger. Fix: tie every inflection point to a specific event: a product launch, a channel partnership, a geographic expansion, or a sales team hire.
2. Ignoring Working Capital: Showing strong net income in Year 2 while the cash balance mysteriously stays flat or grows. Fix: model receivables, payables, and inventory explicitly. Show the cash conversion cycle (the number of days between paying for inputs and collecting from customers) as an assumption.
3. Underestimating CAC: Assuming customers arrive cheaply because the product is great. Fix: benchmark CAC against comparable companies in your sector. For B2B SaaS, CAC of $500-$5,000 per customer is common depending on deal size. For consumer apps, $10-$50 is typical for paid acquisition.
4. Unrealistic Gross Margin Expansion: Projecting 30% gross margins in Year 1 expanding to 75% by Year 5 without a documented path. Fix: show the specific cost reductions (supplier negotiations, automation, volume discounts) that drive margin improvement, with the timing tied to revenue milestones.
5. Missing the Funding Bridge: Projecting growth that requires capital without showing when and how that capital arrives. Fix: model each funding round explicitly, show the cash balance before and after, and confirm that the business never goes cash-negative between rounds.

Five credibility killers appear in most rejected startup pro formas. Each has a specific, documentable fix.
Frequently Asked Questions
How long does it take to build a 5-year pro forma for a startup?
Building a credible 5-year startup pro forma from scratch typically takes 20 to 40 hours for a founder with basic financial modeling skills, or 8 to 15 hours using a pre-built template with the structure already in place. The time investment concentrates in two areas: gathering and documenting assumptions (which requires market research and competitive benchmarking) and building the three linked financial statements so that changes in one automatically flow through to the others. Using a template with pre-linked formulas eliminates the structural build time and lets you focus on the assumptions that actually drive investor conversations. For a seed round, plan to spend at least 10 hours on assumption documentation alone, because that’s where investor due diligence focuses.
What growth rate should I use for a startup pro forma?
Growth rates should reflect your business model and stage, not a number that sounds impressive. Early-stage SaaS startups targeting venture funding often model 100-200% year-over-year growth in Years 1-2, decelerating to 50-80% in Years 3-4 and 30-40% in Year 5. Product startups typically model 50-100% in early years. Service businesses, constrained by headcount, often model 30-60% annual growth. The key rule: every growth rate needs a documented driver. Chalifour Consulting (2024) references a 10% growth assumption as a baseline example, which is appropriate for mature businesses but too conservative for venture-scale startups. Use the bottom-up customer build method described in this article for Years 1-2, then apply documented percentage growth for Years 3-5.
What’s the difference between a pro forma and a financial forecast?
A pro forma (Latin for ‘as a matter of form’) is a projection built on hypothetical or assumed conditions, often used to show what financials would look like under a specific scenario such as post-funding, post-acquisition, or at a target growth rate. A financial forecast is typically a near-term projection based on current trends and known data. For startups, the distinction matters because your 5-year pro forma is explicitly a scenario model, not a prediction. Investors understand this. The SBA defines pro forma financial statements as projections based on assumed conditions, which is why assumption documentation is more important than projection accuracy. Present your pro forma as a scenario tool, not a commitment, and document every assumption so investors can substitute their own.
How do I model a funding round in my 5-year pro forma?
Model each funding round as a financing cash inflow in the month you expect to close it. For example, a $2M Series A closing in Month 18 appears as a $2,000,000 positive entry in the financing section of your Month 18 cash flow statement. Simultaneously, increase paid-in capital on the balance sheet by $2,000,000. If the round carries a 20% equity dilution, note this in your assumptions tab: pre-money valuation, post-money valuation, shares issued, and resulting ownership percentages. Your cash balance should jump by $2,000,000 in that month, and your runway calculation should reset from that new cash balance. Show the business going cash-negative before the round closes only if you have a documented bridge financing plan, because investors will flag any period where the cash balance goes below zero without a corresponding inflow.
Should I use monthly or annual columns in my 5-year pro forma?
Use monthly columns for Year 1, quarterly for Year 2, and annual for Years 3-5. This structure reflects the reality that near-term projections are more reliable and more operationally relevant than long-range ones. Monthly Year 1 detail lets investors evaluate your hiring plan, marketing spend timing, and cash runway month by month, which is the level of detail they need for seed and Series A diligence. Quarterly Year 2 columns acknowledge that you’ll adjust your plan as you learn. Annual Years 3-5 are explicitly directional, showing the scale of the opportunity rather than the precision of the plan. Showing monthly columns for Year 4 implies a false precision that signals financial naivety to experienced investors.
What’s a realistic gross margin for a startup pro forma?
Gross margin benchmarks vary significantly by business model. SaaS businesses typically target 70-80% gross margins at scale, though early-stage companies often run 60-70% due to higher per-customer infrastructure costs. Product businesses (physical goods) typically run 40-60% gross margins depending on manufacturing complexity and channel mix. Service businesses run 30-50% gross margins, with the primary cost being labor. In your Year 1 pro forma, your gross margin will likely be below your long-term target because you haven’t yet achieved the volume needed for supplier discounts, automation, or infrastructure efficiency. Document the specific milestones (revenue thresholds, headcount levels, technology investments) that drive margin improvement in Years 2-5. Investors will benchmark your margin assumptions against comparable public companies in your sector.
Microsoft Excel, a common tool for building pro formas, supports up to 64 levels of nested functions (Microsoft) in a single formula — a practical ceiling worth knowing when building complex linked financial models with deeply nested IF or INDEX/MATCH logic. Excel worksheets also support up to 1,048,576 rows (Microsoft) per sheet, meaning even a monthly 5-year model with thousands of line items will never hit a row-count constraint. Additionally, a single Excel workbook can contain up to 255 sheets (Microsoft), which is more than sufficient to house separate tabs for each financial statement, assumptions, scenarios, and metrics without splitting your model across multiple files.
How do I handle uncertainty in a 5-year startup pro forma?
Handle uncertainty by building three explicit scenarios: conservative, moderate, and aggressive. In the conservative scenario, reduce your base case revenue by 25-30% and increase costs by 10-15%. In the aggressive scenario, increase revenue by 25-30% and hold costs flat. Present all three in a summary tab so investors can see the range of outcomes. Additionally, run a sensitivity analysis (a table showing how your Year 5 net income or cash balance changes as you vary your two or three most critical assumptions, such as CAC, churn rate, or average deal size). This demonstrates that you understand which variables drive your business and that you’ve tested the model’s robustness. According to eFinancialModels (2024), 68% of investors discount pro forma earnings, so showing a range of outcomes is more credible than presenting a single optimistic projection as fact.
Build Your 5-Year Pro Forma on a Solid Foundation
A 5-year startup pro forma is not a prediction. It’s a structured argument that your business model works, your growth assumptions are grounded, and your team understands the financial mechanics of scaling. The founders who raise capital aren’t the ones with the most optimistic projections. They’re the ones who can defend every line item with data, logic, and documented assumptions.
Start with the three linked financial statements, layer in your startup-specific metrics, document every assumption with a source or rationale, and model three scenarios so investors can stress-test your thinking. Keep Year 1 monthly, Year 2 quarterly, and Years 3-5 annual. Show your funding rounds explicitly, model working capital honestly, and never let your cash balance go negative without a documented plan.
I recommend downloading the EFM investor-ready 5-year pro forma template to get started with a pre-built structure that includes all three linked statements, startup metrics, assumption documentation, and scenario modeling built in. It’s the fastest way to produce a pro forma that holds up under investor scrutiny.























































