
0 ITEMS

SaaS Financial Projections Template: Free Download + 5 Fatal Errors

The eFinancialModels free SaaS financial projections template gives you a ready-to-use spreadsheet covering monthly P&L, cash flow runway, ARR build-up, CAC/LTV unit economics, cohort retention, headcount planning, and cap table dilution — everything an investor expects to see in a seed or Series A model.
Key Takeaways
- Download the free SaaS financial projections template from eFinancialModels at efinancialmodels.com/downloads/tag/free — it includes 7 investor-ready components in one spreadsheet.
- Median SaaS gross margins run 70-80% for software-only businesses; projecting below 60% without explanation is an immediate red flag for investors.
- A healthy LTV:CAC ratio is at least 3:1, and top-quartile SaaS companies achieve 5:1 or higher according to OpenView Partners’ SaaS benchmarks.
- CAC payback periods under 12 months signal strong unit economics; anything above 18 months requires a clear retention story to justify.
- The 5 fatal modeling errors — hockey-stick growth without CAC assumptions, ignoring churn, linear hiring, no scenario modeling, and forgetting gross margin compression — appear in the majority of rejected seed-stage decks.
- Investors at Series A typically want 3-year monthly projections with at least 3 scenarios (base, upside, downside) and a clear path to Rule of 40 compliance.
- When your ARR exceeds $1M or you’re preparing for a Series A raise, a free template is no longer sufficient — you need a custom model or fractional CFO support.
Free SaaS Financial Projections Template
The eFinancialModels free SaaS financial projections template is available for immediate download and covers every component a pre-seed to Series A founder needs to build a credible investor-ready model. You can access the full library of free financial model templates and filter for SaaS-specific options.
The template is built in Excel and Google Sheets-compatible format. It uses driver-based modeling, meaning you input your key assumptions (growth rate, churn, CAC, average contract value) and the model calculates everything else automatically. You don’t need a finance background to use it — but you do need to understand what each driver means before you type a number.
What’s Inside the Template: 7 Core Components Every SaaS Model Needs
A complete SaaS financial projections template contains 7 interconnected modules, each feeding into the others. Here’s what the eFinancialModels template includes and why each component matters.
1. Monthly P&L (Profit and Loss Statement): Shows revenue, cost of goods sold (COGS — the direct costs to deliver your software, like hosting and support), gross profit, operating expenses, and net income month by month. EBITDA (Earnings Before Interest, Taxes, Depreciation, and Amortization — a proxy for operating cash generation) appears as a separate line.
2. Cash Flow Runway: Calculates how many months of operating cash you have left at your current burn rate. Burn rate is the net cash you spend each month. Runway = cash on hand divided by monthly burn.
3. ARR Build-Up: ARR (Annual Recurring Revenue) is the annualized value of all active subscriptions. The build-up module tracks new ARR, expansion ARR (upsells), contraction ARR (downgrades), and churned ARR month by month.
4. Cohort Retention Assumptions: A cohort is a group of customers who started in the same month. The retention module models what percentage of each cohort stays active over 12-24 months, which directly drives your churn and LTV calculations.
5. Unit Economics (CAC and LTV): CAC (Customer Acquisition Cost) is total sales and marketing spend divided by new customers acquired. LTV (Lifetime Value) is average revenue per customer divided by monthly churn rate. The template calculates both and flags when your LTV:CAC ratio falls below 3:1.
6. Headcount Planning: Maps hiring to revenue milestones. The template includes standard SaaS ratios: 1 account executive per $500K-$1M ARR, 1 customer success manager per 50-100 accounts, and 1 support rep per 200-300 customers.
7. Cap Table Dilution Scenarios: A cap table (capitalization table) shows who owns what percentage of the company. The dilution module models how different funding rounds affect founder ownership at pre-seed, seed, and Series A.
Before You Start: The 4 Data Inputs You Must Gather First
Before opening the template, gather these 4 inputs. Without them, you’ll be guessing at numbers that investors will immediately challenge.
Input 1: Your current MRR or ARR. MRR (Monthly Recurring Revenue) is the normalized monthly value of all active subscriptions. If you’re pre-revenue, use your signed LOIs (letters of intent) or pilot agreements as a proxy.
Input 2: Your historical churn rate. Monthly churn rate = customers lost in a month divided by customers at the start of that month. If you have fewer than 6 months of data, use industry benchmarks: SMB-focused SaaS averages 3-5% monthly churn, while enterprise SaaS typically runs 0.5-1% monthly churn according to Bessemer Venture Partners’ State of the Cloud report.
Input 3: Your actual CAC. Pull your last 3 months of sales and marketing spend from your accounting software. Divide by new customers acquired in the same period. If you haven’t spent on paid acquisition yet, estimate based on your planned sales team cost divided by your pipeline conversion rate.
Input 4: Your average contract value (ACV). ACV is the average annual revenue per customer. For monthly plans, multiply average MRR per customer by 12. Segment this by plan tier if you have multiple pricing tiers.

Follow the 7 steps in order — each module’s output becomes the next module’s input, so sequence matters.
How to Fill Out Your SaaS Financial Projections (Step-by-Step)
Populating the template correctly takes about 4-6 hours the first time. Follow these steps in order — each module feeds the next.
Step 1: Set your projection period. Enter the start month and choose a 24-month or 36-month horizon. Series A investors expect 36 months of monthly detail.
Step 2: Enter your ARR build-up assumptions. Input your starting MRR, your monthly new customer growth rate, your average ACV, and your monthly churn rate. The template calculates ending ARR for each month automatically.
Step 3: Build your cohort retention table. Enter your month-1, month-3, month-6, and month-12 retention rates. If you don’t have data, use these benchmarks as starting assumptions: 85% at month 1, 70% at month 6, 60% at month 12 for SMB SaaS.
Step 4: Calculate unit economics. Enter your monthly sales and marketing spend and your new customer count. The template calculates CAC, LTV (using your churn rate and ACV), and LTV:CAC ratio. Adjust spend until your CAC payback period is under 18 months.
Step 5: Build your headcount plan. Map each hire to a specific month and revenue trigger. Don’t hire ahead of revenue — model each role as unlocked when you hit a specific ARR milestone.
Step 6: Complete the P&L. The template auto-populates revenue from your ARR build-up. Enter your COGS (hosting, support, implementation), then your operating expenses (R&D, G&A, sales, marketing) by month.
Step 7: Run 3 scenarios. Duplicate the base case tab and create a downside scenario (50% of projected new customer growth, 20% higher churn) and an upside scenario (150% of projected growth, 10% lower churn). Investors will ask for these.
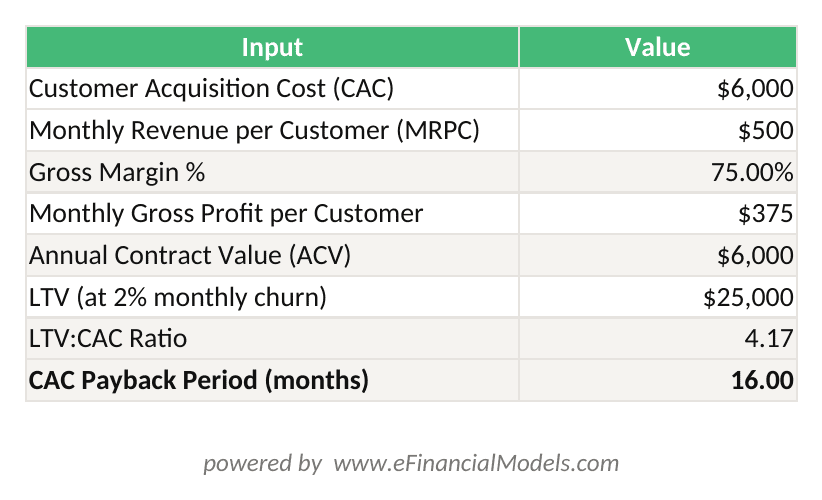
CAC Payback Period = CAC ÷ (Monthly Revenue per Customer × Gross Margin). At $6,000 CAC, $500 MRPC, and 75% gross margin, payback = 16 months.

The ARR build-up module tracks 4 ARR movements monthly — new, expansion, contraction, and churn — giving investors a complete revenue waterfall.
The 5 Fatal Errors That Make Your Projections Look Amateur
These 5 mistakes appear in the majority of rejected seed-stage financial models. Each one signals to investors that the founder hasn’t thought through the mechanics of their business.
Error 1: Hockey-stick growth with no CAC assumptions. Projecting 300% ARR growth in year 2 without showing how much you’ll spend on sales and marketing to get there is the single most common red flag. Fix: for every dollar of new ARR you project, show the corresponding CAC spend that generates it.
Error 2: Ignoring churn entirely. A model that shows only new customer additions with no churn line tells investors you don’t understand SaaS economics. Fix: model gross churn (customers lost) and net revenue retention (expansion minus churn) as separate line items.
Error 3: Linear hiring plans. Hiring 2 engineers per quarter regardless of revenue stage is unrealistic. Fix: tie every hire to a specific revenue or product milestone. Show the revenue-per-employee ratio improving over time.
Error 4: No scenario modeling. A single-scenario model tells investors you’re optimistic, not analytical. Fix: build base, upside, and downside cases with clearly stated assumption differences. The downside case should show you surviving with 12+ months of runway.
Error 5: Forgetting gross margin compression. As you scale, COGS often increases faster than revenue in early stages due to implementation costs, support headcount, and infrastructure. Fix: model COGS as a percentage of revenue that starts higher (30-40%) and compresses toward your target (15-20%) as you scale. Gross margin is revenue minus COGS, expressed as a percentage of revenue.
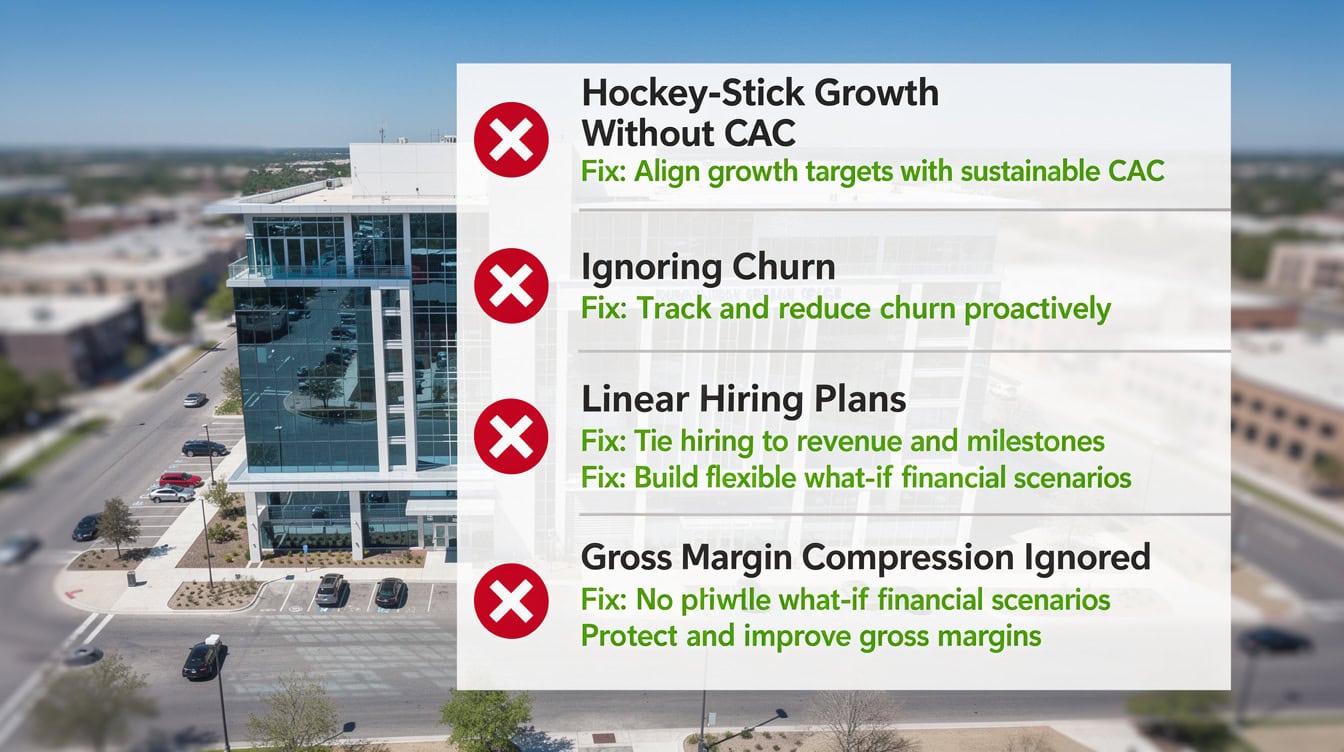
These 5 errors appear in the majority of rejected seed-stage decks — each one signals to investors that the founder hasn’t modeled the business mechanics.
SaaS Benchmark Metrics: How to Know If Your Numbers Make Sense
Your projections don’t need to be accurate — they need to be defensible. Use these benchmarks to sanity-check every major assumption.
| Metric | Early Stage (< $1M ARR) | Growth Stage ($1M-$10M ARR) | Scale Stage (> $10M ARR) |
|---|---|---|---|
| Monthly MRR Growth | 15-25% | 8-15% | 5-10% |
| Gross Margin | 60-75% | 70-80% | 75-85% |
| CAC Payback (months) | 12-18 | 9-15 | 6-12 |
| LTV:CAC Ratio | 3:1 | 4:1 | 5:1+ |
| Monthly Churn (SMB) | 3-5% | 2-4% | 1-3% |
| Monthly Churn (Enterprise) | 0.5-1% | 0.3-0.8% | 0.2-0.5% |
| Rule of 40 Score | N/A | 20-30 | 40+ |
| Burn Multiple | < 2x | < 1.5x | < 1x |
The Rule of 40 (a SaaS health metric where your revenue growth rate plus your profit margin should equal or exceed 40) is a threshold that Series B and later investors apply consistently. Burn multiple (net burn divided by net new ARR) below 1.5x signals capital efficiency at the growth stage according to David Sacks’ widely cited framework.
Median net revenue retention (NRR) for top-quartile SaaS companies runs above 120%, meaning existing customers expand their spend faster than others churn, according to Bessemer Venture Partners. Projecting NRR below 100% without a clear explanation will raise questions in any investor meeting.
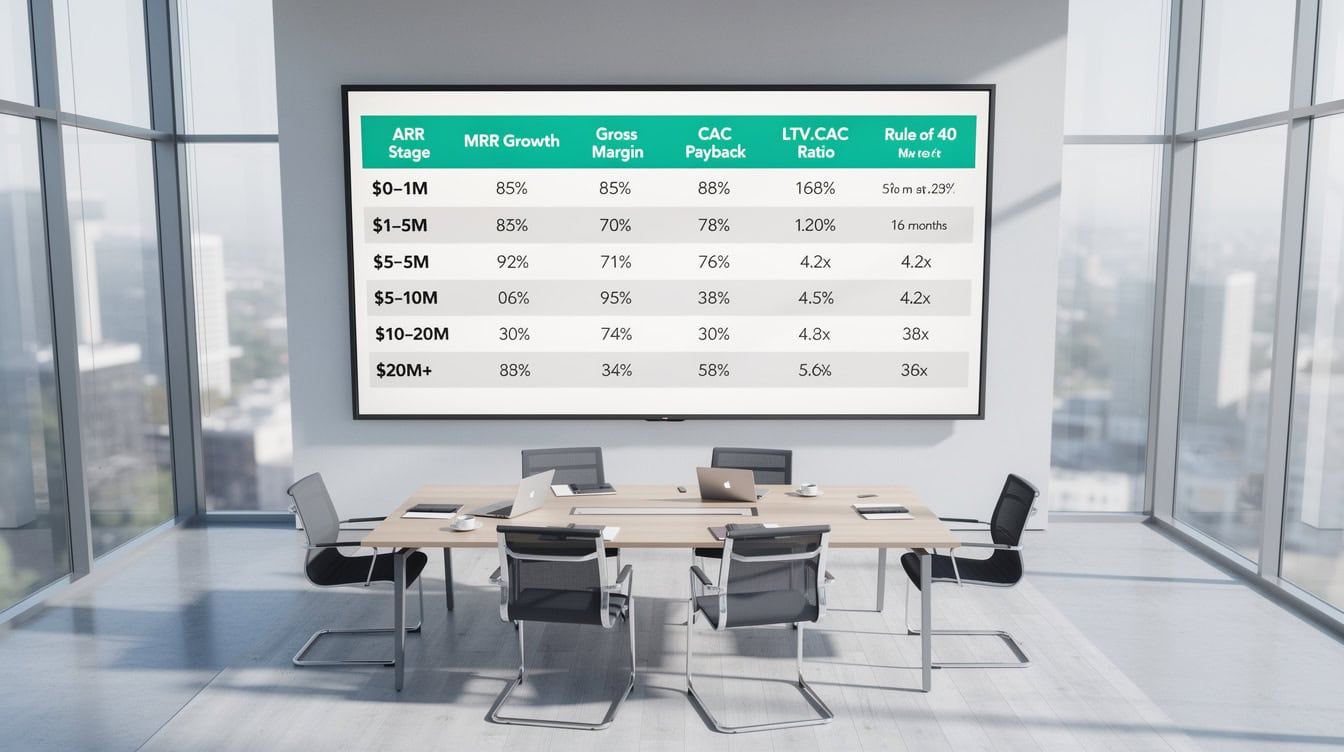
Benchmark your projections against these stage-appropriate targets — projecting early-stage metrics at scale-stage rates is a common investor red flag.
Adapting the Template to Your SaaS Business Model
The free template works across SaaS business models, but you’ll need to adjust specific drivers depending on how your business acquires and retains customers.
B2B vs B2C: B2B models use ACV and sales cycle length as primary drivers. B2C models use daily/monthly active users, conversion rates from free to paid, and payment processing costs as additional COGS. Adjust the ARR build-up tab to reflect your sales cycle length (typically 30-90 days for SMB B2B, 6-18 months for enterprise).
PLG (Product-Led Growth) vs Sales-Led: PLG (where the product itself drives user acquisition and conversion) requires a freemium-to-paid conversion funnel in the ARR build-up. Add a row for free users, a conversion rate assumption (industry median is 2-5% for PLG SaaS), and a time-to-convert assumption. Sales-led models use pipeline conversion rates and sales rep productivity instead.
Usage-Based vs Subscription: Usage-based pricing (where customers pay per API call, seat, or transaction) requires a consumption growth assumption per customer. Replace the fixed ACV input with an average monthly usage revenue that grows at a specified rate per cohort.
You can explore the full range of SaaS financial models on eFinancialModels to find model variants built specifically for PLG, marketplace, and usage-based SaaS businesses.
What Investors Actually Examine in Your Financial Model
Investors don’t read your financial model to find out what your revenue will be — they read it to understand how you think. Here’s what they actually look at, in order.
First: The assumptions tab. Every serious investor goes to your assumptions tab before looking at any output. They want to see that your growth rate, churn, CAC, and hiring assumptions are grounded in data or clearly labeled as benchmarks. Vague assumptions like “industry standard” without a source are an immediate credibility problem.
Second: The unit economics. LTV:CAC ratio, CAC payback period, and gross margin are the three numbers investors calculate independently to verify your model. If your model shows a 5:1 LTV:CAC but your CAC payback is 24 months, something is wrong with your churn assumption.
Third: The downside scenario. Investors want to know how long you survive if growth is 50% of plan. If your downside scenario shows you running out of cash in month 8, you need either more capital or a lower burn rate.
Fourth: The path to profitability. At Series A, investors expect to see a clear month when you reach EBITDA breakeven (the point where operating cash generation turns positive) under the base case. Projecting losses indefinitely without a breakeven date is acceptable only if you can show a clear path to it in a follow-on round.
Building financial projections that survive investor scrutiny requires the same rigor as a three-statement model — income statement, balance sheet, and cash flow statement all reconciling to each other. The eFinancialModels three-statement model templates provide that structure for founders ready to go deeper.

Investors read your model to understand how you think, not to predict your revenue — the assumptions tab is always the first stop.
When to Graduate Beyond the Free Template
The free template is a starting point, not a permanent solution. You’ve outgrown it when any of these 5 signs appear.
Sign 1: Your ARR exceeds $1M. At this stage, investors expect a fully integrated three-statement model with GAAP-compliant (Generally Accepted Accounting Principles — the standard accounting rules used in the US) revenue recognition, not a simplified ARR build-up.
Sign 2: You’re preparing for a Series A raise. Series A investors typically conduct 4-6 weeks of financial due diligence. A template-based model won’t survive that process without a finance professional behind it.
Sign 3: You have multiple revenue streams. If you’re combining subscription revenue, professional services, and usage-based fees, a single-tab template can’t model the interactions correctly.
Sign 4: Your cap table has more than 10 entries. Complex cap tables with SAFEs (Simple Agreements for Future Equity), convertible notes, and multiple option pools require dedicated cap table software, not a spreadsheet tab.
Sign 5: Your board is asking questions you can’t answer from the model. If your board asks “what’s our payback period by customer segment” and you can’t answer from your current model, you need a more granular build.
At that point, consider a custom financial modeling service or a fractional CFO. The cost of a bad model in a fundraising process — a failed round or a lower valuation — far exceeds the cost of professional modeling support.

The free template is a starting point — these 5 signals tell you it’s time to invest in a custom model or fractional CFO support.
FAQ: SaaS Financial Projections Template
What should a SaaS financial projections template include?
A complete SaaS financial projections template should include at minimum 7 components: a monthly P&L, a cash flow and runway calculator, an ARR build-up with new/expansion/churned ARR, cohort retention assumptions, unit economics (CAC and LTV), a headcount plan tied to revenue milestones, and cap table dilution scenarios. The eFinancialModels free template includes all 7 in a single Excel file. Without cohort retention and unit economics, your model can’t demonstrate the compounding dynamics that make SaaS businesses valuable to investors. Most templates you find online include only the P&L and cash flow, which is insufficient for any serious fundraising conversation.
How do I calculate CAC payback period in my SaaS model?
CAC payback period = CAC divided by (average monthly revenue per customer multiplied by gross margin percentage). For example: if your CAC is $6,000, your average monthly revenue per customer is $500, and your gross margin is 75%, your CAC payback period is $6,000 divided by ($500 × 0.75) = $6,000 divided by $375 = 16 months. A payback period under 12 months is considered strong for SMB SaaS. Enterprise SaaS with longer contracts can justify 18-24 months because annual contracts reduce churn risk. The eFinancialModels template calculates this automatically once you enter your CAC and ACV inputs.
What MRR growth rate should I project for a pre-seed SaaS startup?
For a pre-seed SaaS startup with less than $100K ARR, monthly MRR growth rates of 15-25% are realistic and defensible to investors. This compounds to roughly 5-8x annual growth, which aligns with what top-quartile early-stage SaaS companies achieve according to Bessemer Venture Partners’ State of the Cloud benchmarks. Projecting above 30% monthly growth requires a specific explanation: a viral coefficient above 1.0, a proven paid channel with a CAC below $500, or a signed enterprise contract pipeline. Never project growth rates you can’t explain with a specific acquisition mechanism. Investors will ask.
How many scenarios should my SaaS financial model include?
Your SaaS financial model should include at least 3 scenarios: a base case (your most likely outcome based on current data), an upside case (150% of projected new customer growth with 10% lower churn), and a downside case (50% of projected growth with 20% higher churn). The downside case is the most important one for investors — it shows how long you survive if things go wrong and what levers you’d pull to extend runway. At Series A, some investors also ask for a “plan B” scenario showing what happens if you cut burn by 40% and focus on profitability instead of growth. Build all 3 scenarios before your first investor meeting.
What’s the difference between gross churn and net revenue retention?
Gross churn measures the percentage of revenue lost from cancellations and downgrades in a period, ignoring any expansion revenue. Net revenue retention (NRR) measures the total revenue change from your existing customer base, including expansion (upsells and cross-sells) minus churn and contraction. For example: if you start the month with $100K MRR from existing customers, lose $5K to churn, but gain $10K from upsells, your gross churn is 5% but your NRR is 105%. Top-quartile SaaS companies achieve NRR above 120% according to Bessemer Venture Partners. NRR above 100% means your existing customers grow your revenue even without acquiring new ones — this is the most powerful signal of SaaS business health.
Can I use this template for a B2C SaaS or consumer subscription business?
Yes, with modifications. The core ARR build-up and P&L structure works for any subscription business. For B2C SaaS, replace the ACV and sales cycle inputs with monthly active user counts, free-to-paid conversion rates (typically 2-5% for consumer apps), and average revenue per paying user (ARPU). Your CAC calculation changes too: B2C CAC is typically driven by paid social and content costs divided by new paying subscribers, not sales team costs. Gross margins for B2C SaaS are often lower (50-70%) due to payment processing fees (2-3% of revenue) and higher support costs per dollar of revenue. The eFinancialModels SaaS template library includes B2C-specific variants for consumer subscription businesses.
When does a SaaS startup need a fractional CFO instead of a template?
A SaaS startup needs fractional CFO support when any of these thresholds are crossed: ARR exceeds $1M, you’re within 6 months of a Series A raise, your board requires monthly GAAP financial statements, you have more than 3 revenue streams, or your cap table includes convertible instruments like SAFEs or convertible notes that require complex modeling. A fractional CFO typically costs $3,000-$8,000 per month for 10-20 hours of work. That cost is justified when the alternative is a failed fundraise or a valuation haircut caused by a model that doesn’t hold up to due diligence. The eFinancialModels custom financial modeling service is a cost-effective bridge between a free template and a full-time CFO hire.
Conclusion
SaaS financial projections aren’t about predicting the future — they’re about demonstrating that you understand the mechanics of your business well enough to make defensible assumptions. The free eFinancialModels template gives you the structure. Your job is to fill it with honest numbers, stress-test them against the benchmarks in this article, and build 3 scenarios before you walk into any investor meeting.
Avoid the 5 fatal errors, anchor every growth assumption to a specific acquisition mechanism, and make sure your downside case shows 12+ months of runway. That combination — rigorous assumptions, clear unit economics, and a survivable downside — is what separates fundable models from rejected ones.
I recommend downloading the free SaaS financial projections template from eFinancialModels today and working through the step-by-step walkthrough in this article. If you’re preparing for a Series A or your ARR has crossed $1M, explore the startup financial models library for more advanced options built specifically for investor-ready due diligence packages.























































