
0 ITEMS

Projected Financial Statements: What Lenders Check First
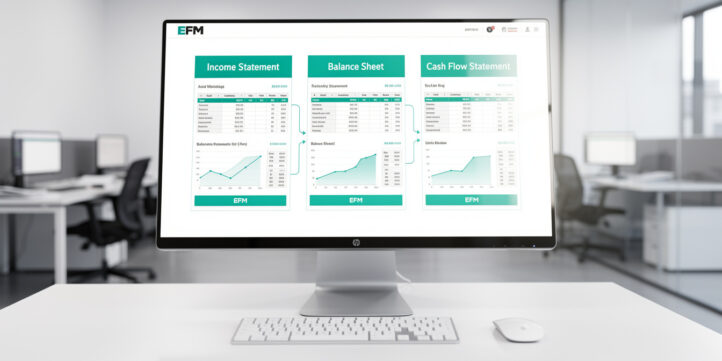
Projected financial statements are the single document set that separates fundable business plans from rejected ones — and most founders get them wrong in the same five ways.
Key Takeaways
- Projected financial statements consist of 3 linked documents: a pro forma income statement, balance sheet, and cash flow statement — all driven by the same assumption set.
- Lenders require a minimum debt service coverage ratio (DSCR) of 1.25x to 1.50x before approving most commercial loans, making cash flow projections the highest-scrutiny document.
- SaaS businesses typically project gross margins of 70–85%, while retail runs 20–50% and manufacturing 25–40% — using the wrong benchmark instantly flags a projection as unrealistic.
- Banks typically want 3 years of monthly projections plus 2 years of annual summaries; VCs evaluating a Series A expect 5 years of annual projections with unit-economics detail.
- The 6 most common red flags that kill lender credibility include hockey-stick revenue curves, static working capital, and missing debt covenant sensitivity tables.
- A properly integrated 3-statement model means every revenue assumption flows automatically into gross profit, then operating cash flow, then the balance sheet — no manual overrides.
- Scenario planning with at least 3 cases (base, upside, downside) is now standard practice for investor-grade projections, not optional.
What Are Projected Financial Statements?
Projected financial statements (also called pro forma financial statements) are forward-looking versions of the three core accounting documents — income statement, balance sheet, and cash flow statement — built from explicit assumptions about future business performance rather than recorded historical transactions.
They differ from historical statements in a fundamental way: historical statements report what happened; projected statements model what you expect to happen and why. They also differ from a budget (which is an internal spending plan) and from a rolling forecast (which updates monthly against actuals). Pro forma projections are typically prepared for a defined future period — 3 to 5 years — and submitted to external stakeholders: banks, investors, or board members.
The U.S. Securities and Exchange Commission defines pro forma financial information as presentations that show what the significant effects of a completed or proposed transaction might have been on a company’s financial position (SEC Regulation S-X, Article 11). For private companies seeking funding, the same principle applies: projections must be grounded in documented assumptions, not optimism.
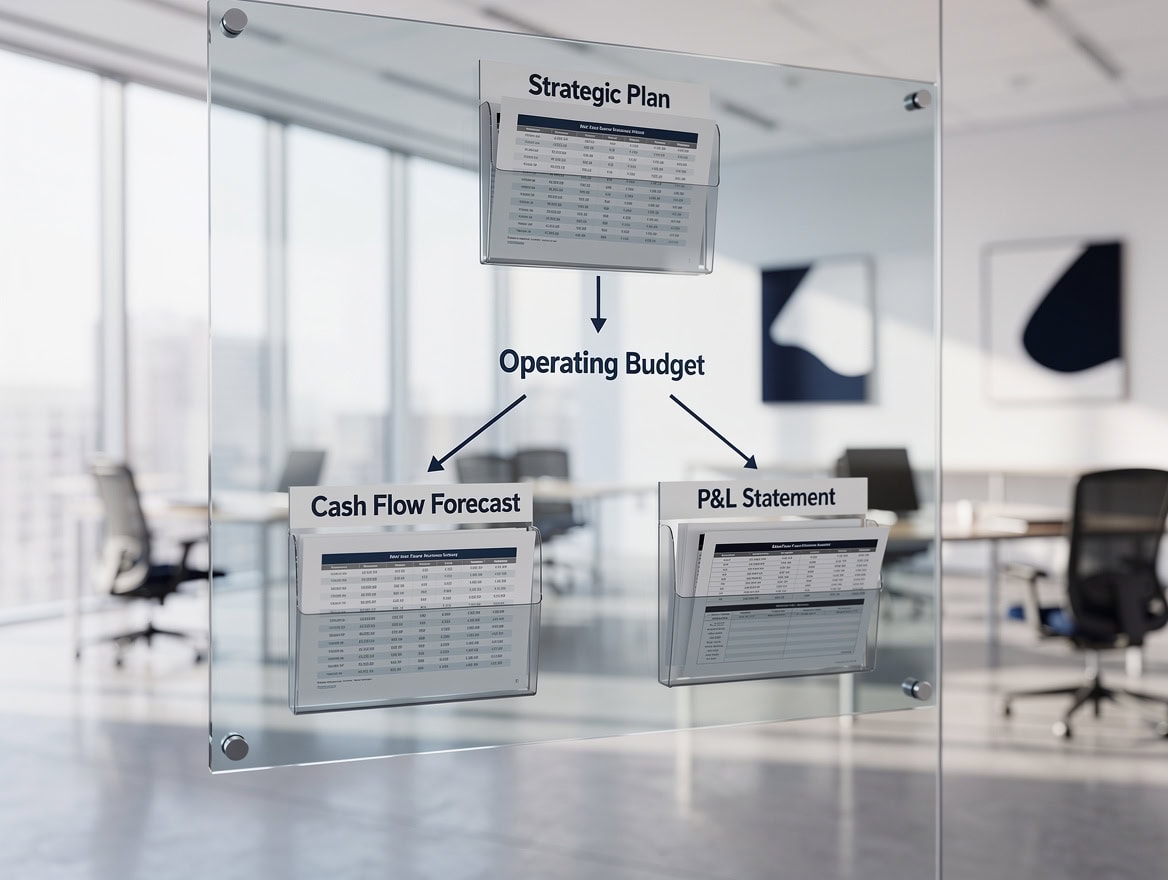
Historical statements record transactions; projected statements model assumptions — the distinction matters to every lender reviewing your application.
The Three Statements: Income, Balance Sheet, and Cash Flow
Each of the three projected statements answers a different question, and lenders read all three together to spot inconsistencies.
Projected Income Statement
The projected income statement (also called the pro forma profit and loss, or P&L) shows revenue, cost of goods sold (COGS), gross profit, operating expenses, and net income over a future period. COGS is the direct cost of producing your product or service — for a SaaS company that means hosting, customer support, and implementation costs; for a retailer it means product cost, inbound freight, and shrinkage; for a manufacturer it means raw materials, direct labor, and overhead allocation.
The key line lenders focus on first is gross margin: gross profit divided by revenue, expressed as a percentage. A SaaS business projecting a 45% gross margin when the industry standard is 75% raises an immediate question about cost structure.
Projected Balance Sheet
The projected balance sheet shows assets, liabilities, and equity at a future point in time. The balance sheet must balance: total assets must equal total liabilities plus shareholders’ equity. This is where most projection errors hide. If your income statement shows $500,000 in net income but your balance sheet equity doesn’t increase by the same amount (after accounting for dividends and capital contributions), the model is broken.
Key items lenders scrutinize: accounts receivable (does it grow proportionally with revenue?), inventory (is the build-up realistic for your lead times?), and long-term debt (does it match your financing schedule?).
Projected Cash Flow Statement
The projected cash flow statement (built using the indirect method — starting from net income and adjusting for non-cash items and working capital changes) shows actual cash generated or consumed in each period. A business can be profitable on paper and still run out of cash. This statement reveals that gap. Lenders use it to calculate the DSCR: annual operating cash flow divided by annual debt service (principal plus interest). Most commercial lenders require a DSCR of at least 1.25x according to the U.S. Small Business Administration. The SBA’s 7(a) loan program, which guaranteed more than 57,000 loans totaling over $27 billion in fiscal year 2023 U.S. Small Business Administration, uses this DSCR threshold as a primary underwriting criterion across all loan sizes.

The cash flow statement reconciles the income statement and balance sheet — a DSCR below 1.25x on any row triggers lender concern.
Industry Benchmarks: What ‘Realistic’ Looks Like by Sector
Using the right industry benchmarks is not optional — it’s the fastest way to establish credibility with a lender or investor who has seen hundreds of projections.
The table below summarizes typical ranges for four major sectors. These ranges reflect patterns observed across growth-stage companies and are consistent with data published by industry research bodies and SBA lending guidelines.
| Metric | SaaS | Retail | Manufacturing | Services |
|---|---|---|---|---|
| Revenue CAGR (early stage) | 20–40% | 5–15% | 3–10% | 10–25% |
| Gross Margin | 70–85% | 20–50% | 25–40% | 40–60% |
| Working Capital / Revenue | Negative to 5% | 10–20% | 15–25% | 5–15% |
| CapEx / Revenue | 2–5% | 3–8% | 8–15% | 1–4% |
| Cash Conversion Cycle (days) | 30–60 | 45–90 | 60–120 | 20–45 |
SaaS businesses often carry negative working capital because customers pay upfront (annual subscriptions) before the service is delivered — a structural advantage that retail and manufacturing businesses don’t share. According to the Kauffman Foundation’s research on high-growth firms Kauffman Foundation, technology-enabled service businesses consistently outpace traditional sectors in revenue growth rates during the first five years of operation.
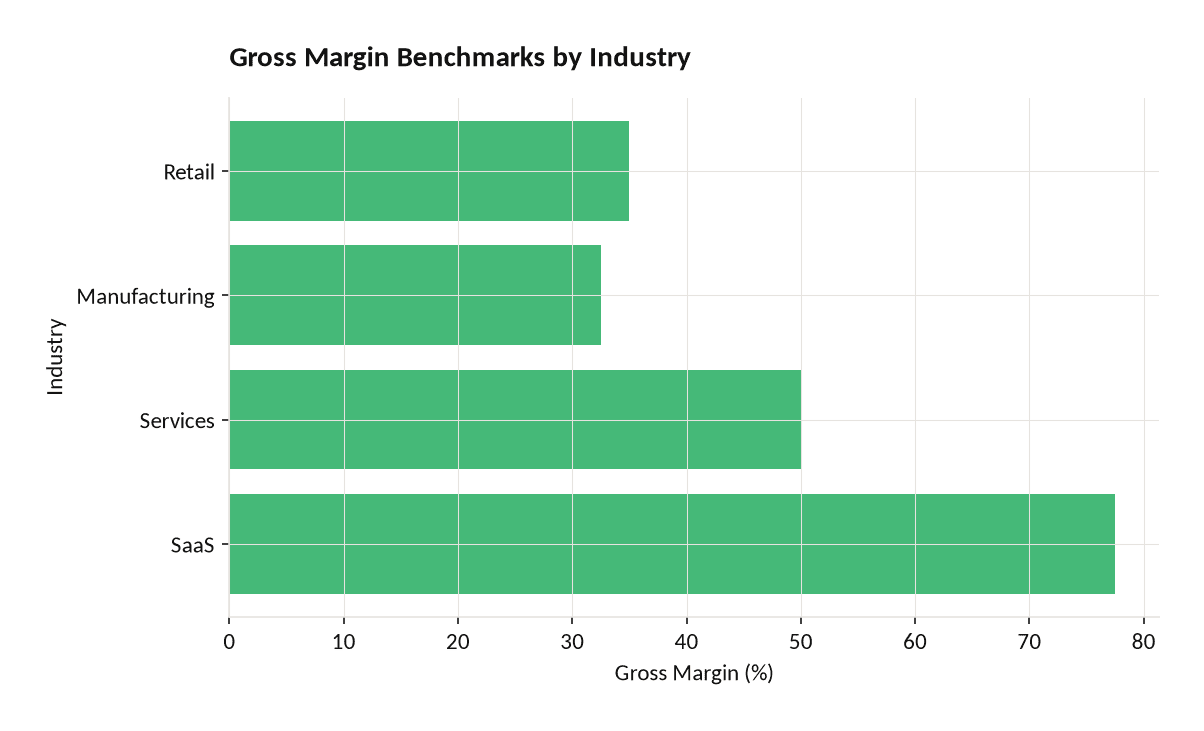
Gross margin midpoints by sector. SaaS commands the highest margins due to low incremental delivery costs; retail and manufacturing face significant direct cost pressure.
What Lenders and Investors Actually Scrutinize
Lenders and investors don’t read projections sequentially — they jump to the sections most likely to reveal unrealistic assumptions.
Here’s what they check, in order of scrutiny:
- Revenue growth rate and its justification. Is the growth rate supported by a bottom-up build (units sold × price × conversion rate) or just a top-down percentage applied to last year’s revenue? Bottom-up builds are far more credible. A SaaS startup projecting 150% year-over-year growth needs to show customer acquisition cost (CAC), monthly churn rate, and average contract value — not just a revenue line.
- Gross margin trajectory. Margins should improve as the business scales, but the improvement must be explained. A manufacturing firm projecting gross margin expansion from 28% to 42% in three years needs to identify the specific drivers: volume discounts on materials, automation investment, or product mix shift.
- Working capital timing. This is where most amateur projections fail. If your revenue grows 30% but your accounts receivable stays flat, the model is wrong. Working capital (current assets minus current liabilities) must move in proportion to revenue growth, adjusted for your actual payment terms.
- CapEx justification and timing. Every major capital expenditure must be tied to a specific revenue-generating event. A $2 million equipment purchase in Year 2 should correspond to a production capacity increase that shows up in Year 2 or Year 3 revenue.
- Debt service coverage. Lenders calculate DSCR on every year of the projection. If DSCR drops below 1.25x in any year, expect a covenant or a rejection. The Federal Reserve’s Senior Loan Officer Opinion Survey consistently identifies cash flow adequacy as the top underwriting criterion for commercial loans.
- Break-even analysis. When does the business cover all fixed costs from gross profit? Investors want to know the break-even revenue level and how many months of runway exist before that point.

Lenders jump directly to the cash flow statement to calculate DSCR — a ratio below 1.25x in any projection year triggers immediate scrutiny.
How to Build Projected Financial Statements: Step-by-Step
Building integrated projected financial statements follows a specific sequence — start with revenue, work down the income statement, then build the balance sheet, and let the cash flow statement reconcile the two.
Step 1: Define your revenue drivers. Don’t start with a revenue number. Start with the inputs that generate revenue. For a SaaS business: number of new customers per month × average contract value × (1 minus monthly churn rate). For a retailer: store count × average revenue per store × same-store growth rate.
Step 2: Build the income statement from gross profit down. Apply your industry-appropriate COGS percentage to revenue to get gross profit. Then layer in operating expenses by function: sales and marketing, general and administrative, research and development. Each category should be driven by a logic (e.g., sales headcount × average salary + commission rate × revenue).
Step 3: Project the balance sheet. Use days-based formulas for working capital items. Accounts receivable = (revenue / 365) × days sales outstanding. Inventory = (COGS / 365) × days inventory outstanding. Accounts payable = (COGS / 365) × days payable outstanding. These formulas keep your balance sheet linked to your income statement assumptions. Microsoft Excel supports up to 64 levels of nested functions Microsoft, which means complex linked projection models with multiple conditional logic layers can be built entirely within a single workbook without hitting formula limits.
Step 4: Build the cash flow statement using the indirect method. Start with net income. Add back non-cash charges (depreciation, amortization). Subtract increases in working capital assets (receivables, inventory). Add increases in working capital liabilities (payables). Then add investing activities (CapEx) and financing activities (debt draws, repayments, equity raises).
Step 5: Check that the balance sheet balances. The ending cash balance on your cash flow statement must equal the cash line on your balance sheet. If it doesn’t, find the error before submitting to anyone.
Step 6: Run sensitivity scenarios. Build at least 3 cases: base (most likely), upside (10–20% better revenue, same costs), and downside (20–30% lower revenue, costs partially fixed). Show DSCR and runway in each scenario.
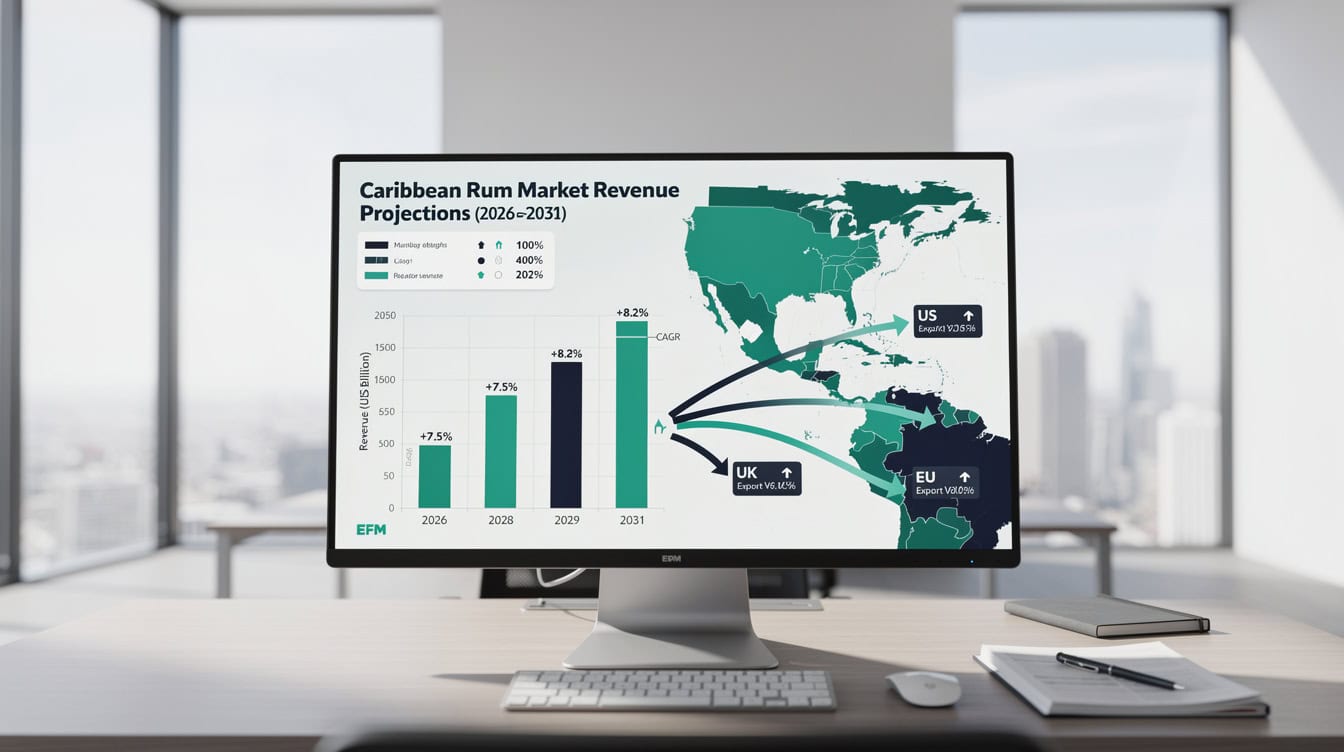
Always start with revenue drivers — not a revenue number. The income statement, balance sheet, and cash flow statement all flow from that first assumption.
Worked Example: SaaS Startup Seeking Series A
Here’s the math for a SaaS startup building Year 1 revenue projections.
Assumptions: 50 new customers per month, $2,000 average annual contract value (ACV), 2% monthly churn, starting customer base of 0.
- End of Month 12 customers: approximately 476 (using the formula: new customers per month × (1 – (1 – churn)^12) / churn)
- Annual Recurring Revenue (ARR) at Month 12: 476 × $2,000 = $952,000
- Gross margin at 75%: gross profit = $952,000 × 0.75 = $714,000
- COGS (hosting, support, implementation): $238,000
- Assume operating expenses of $1.2 million (sales, marketing, G&A, R&D for a 10-person team)
- Year 1 operating loss: $714,000 – $1,200,000 = -$486,000
- Cash runway needed: $486,000 + working capital changes + CapEx (servers, equipment ~$50,000) = approximately $550,000
This tells the investor: the business needs at least $550,000 to reach Month 12, and at the current growth rate, ARR will cross $1 million in Month 13. A Series A investor evaluating this projection will check whether the CAC (cost to acquire each of those 50 monthly customers) is sustainable relative to the lifetime value (LTV) of a $2,000 ACV customer at 2% monthly churn.
LTV = ACV / monthly churn rate = $2,000 / (0.02 × 12) = $8,333. If CAC is $500 per customer, LTV:CAC = 16.7x — well above the 3x minimum most VCs require.
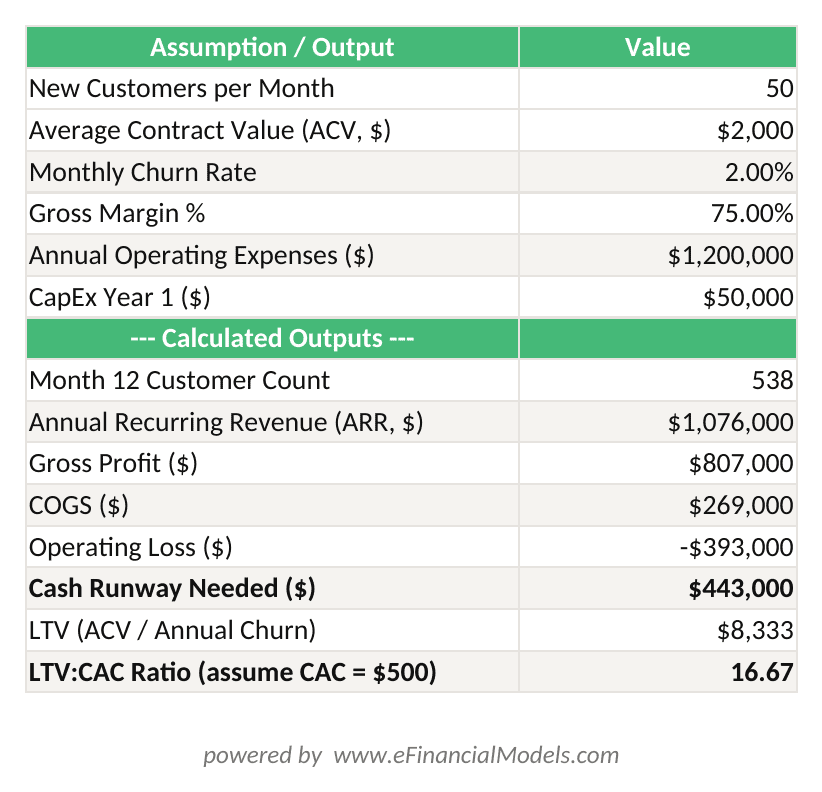
SaaS Year 1 model: 50 new customers/month at $2,000 ACV with 2% monthly churn produces $952K ARR and a $486K operating loss — requiring ~$550K in runway.
A bottom-up SaaS revenue build: 50 new customers per month at $2,000 ACV with 2% monthly churn produces $952,000 ARR by Month 12.
Scenario-Based Projections: Three Real-World Cases
Different business situations require different projection approaches, not just different numbers.
Case 1: Early-Stage SaaS Startup (Series A). Focus on unit economics: CAC, LTV, churn, and net revenue retention. Investors want to see the path from current ARR to $10 million ARR. Show monthly projections for Year 1, quarterly for Years 2–3, annual for Years 4–5. Highlight the month when the business reaches cash flow break-even.
Case 2: Established Retail Business (Expansion). Focus on store-level economics: revenue per square foot, four-wall EBITDA (earnings before interest, taxes, depreciation, and amortization at the individual store level), and payback period on new store investment. A new store opening typically requires 12–18 months to reach mature revenue levels. Model the ramp-up explicitly — don’t assume full revenue from Day 1.
Case 3: Manufacturing Firm (Turnaround). Focus on cash conversion and debt service. A turnaround projection must show the specific operational changes driving margin recovery: which product lines are being discontinued, what headcount reductions are planned, and how inventory will be reduced to free up cash. Lenders evaluating a turnaround want to see DSCR recover to 1.25x within 18–24 months.
Common Red Flags That Kill Credibility with Funders
These 6 mistakes appear in the majority of rejected projections.
- Hockey-stick revenue with no driver explanation. Revenue that grows 10% in Year 1 then suddenly jumps 80% in Year 2 without a documented catalyst (new product launch, new market entry, major contract) signals wishful thinking.
- Static working capital. Keeping accounts receivable flat while revenue doubles is a modeling error, not a conservative assumption. It understates cash needs and overstates DSCR.
- Ignored seasonality. A retail business projecting flat monthly revenue across all 12 months when 40% of actual sales occur in Q4 will fail the first month-by-month cash flow review.
- Missing debt covenant sensitivity. If your loan agreement includes a minimum DSCR covenant of 1.25x, your projection must show DSCR in every period — and show what happens to DSCR in the downside scenario.
- Unrealistic margin expansion without explanation. Gross margin improving from 30% to 55% over 3 years is possible, but only if you explain exactly how: automation, pricing power, product mix, or supplier renegotiation.
- Balance sheet that doesn’t balance. This is an automatic credibility killer. It signals the model was built in disconnected spreadsheet tabs rather than as an integrated system. A single Excel workbook can contain up to 255 sheets Microsoft, so there is no technical reason to split a three-statement model across multiple files — doing so only increases the risk of broken links and balancing errors.

An unbalanced balance sheet is an automatic credibility killer — it signals the model was built in disconnected tabs rather than as an integrated system.
Downloadable Tools: Templates, Checklists, and Benchmarks
Building projected financial statements from scratch in a blank spreadsheet is the slowest and most error-prone approach. A pre-built three-statement financial model ensures the income statement, balance sheet, and cash flow statement are properly linked from the start.
For startup financial models, the template should include a dedicated assumptions tab, a revenue build section with unit economics inputs, and automatic DSCR calculation. For 5-year financial projections submitted to banks or investors, the model should output both monthly and annual views with scenario toggles.
The EFM financial modeling template library includes industry-specific versions for SaaS, retail, manufacturing, and services — each pre-loaded with the benchmark assumptions from the table above.
Lender/Investor Checklist (what to verify before submitting):
- Revenue assumptions documented with bottom-up driver logic
- COGS percentage benchmarked against industry data
- Working capital items calculated using days-based formulas
- CapEx schedule tied to specific capacity or revenue events
- DSCR calculated for every projection year (minimum 1.25x)
- Break-even revenue identified and highlighted
- Three scenarios (base, upside, downside) with DSCR shown in each
- Balance sheet balances in every period
- Seasonality reflected in monthly cash flow projections
- Debt covenant thresholds modeled explicitly
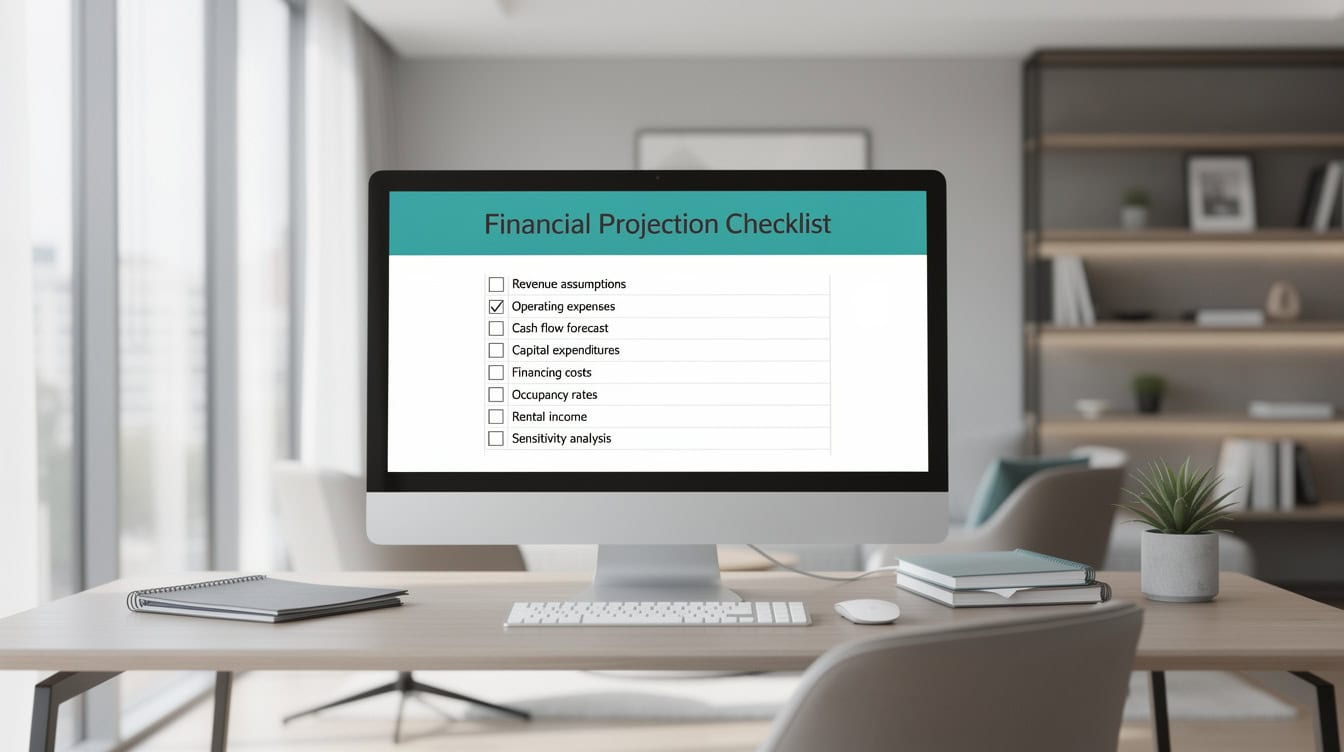
Run through all 10 checklist items before submitting projections — lenders and investors use similar checklists on their end.
Frequently Asked Questions
What is the difference between projected financial statements and a budget?
A budget is an internal management tool that sets spending targets for the coming year, typically broken down by department and updated monthly against actuals. Projected financial statements (pro forma statements) are forward-looking documents prepared for external stakeholders — lenders, investors, or board members — covering 3 to 5 years. A budget focuses on cost control; projected statements focus on demonstrating financial viability and growth trajectory. Budgets are rarely submitted to banks or investors; projected statements almost always are. The key distinction is audience and purpose: budgets manage operations, projections secure capital.
How many years of projections do lenders and investors require?
The answer depends on the stakeholder. Commercial banks typically require 3 years of monthly projections plus 2 years of annual summaries for loan applications, with particular focus on the first 12–24 months of cash flow. Venture capital investors evaluating a Series A round expect 5 years of annual projections with detailed unit economics for Years 1–2. Seed-stage investors often accept 3-year projections. The SBA’s standard loan application process requires at minimum 3 years of projected financial statements for startups without historical financials, according to SBA Form 1919 guidelines.
What is a debt service coverage ratio and why does it matter?
The debt service coverage ratio (DSCR) measures a business’s ability to repay its debt obligations from operating cash flow. The formula is: DSCR = Net Operating Income / Total Debt Service (annual principal + interest payments). A DSCR of 1.0x means the business generates exactly enough cash to cover its debt payments — with zero margin for error. Most commercial lenders require a minimum DSCR of 1.25x, meaning the business generates 25% more cash than needed for debt service. Some lenders require 1.50x for higher-risk industries. If your projections show DSCR below 1.25x in any year, expect the lender to either reduce the loan amount or require additional collateral.
How do I make my revenue projections credible to investors?
The most credible revenue projections use a bottom-up build: start with the specific inputs that generate revenue (number of customers, average order value, conversion rate, churn rate) rather than applying a percentage growth rate to last year’s revenue. For a SaaS business, show monthly new customer additions, average contract value, and monthly churn — then let revenue emerge from those inputs. For a retailer, show store count, revenue per store, and same-store growth rate. Investors specifically look for the connection between your sales and marketing spend (customer acquisition cost) and the resulting revenue. A CAC of $500 generating a customer with a lifetime value of $8,000 is a compelling, defensible assumption. A revenue line that grows 40% per year with no explanation is not.
What goes into the COGS line for a SaaS business versus a manufacturer?
COGS (cost of goods sold) represents the direct costs of delivering your product or service. For a SaaS business, COGS includes cloud hosting and infrastructure costs, customer support salaries and tools, implementation and onboarding costs, and third-party software licenses embedded in the product. Gross margins for SaaS typically run 70–85% because these costs are relatively low and scale slowly with revenue. For a manufacturer, COGS includes raw materials, direct labor (workers on the production floor), and manufacturing overhead (factory rent, utilities, equipment depreciation). Manufacturing gross margins typically run 25–40% because materials and labor are substantial. Using SaaS-level margins in a manufacturing projection — or vice versa — is one of the fastest ways to lose credibility with an experienced lender.
How do I handle seasonality in projected financial statements?
Seasonality must appear in your monthly cash flow projections, not just your annual totals. A retail business that generates 40% of annual revenue in Q4 needs to show that concentration explicitly — along with the inventory build-up in Q3 that funds it and the cash trough in Q1 that follows. To model seasonality, use a monthly revenue distribution table: assign a percentage of annual revenue to each month based on historical patterns or industry data. Then apply that distribution to your projected annual revenue. The resulting monthly cash flow statement will show the periods when the business needs a line of credit or cash reserves, which is exactly what a lender needs to see before approving a revolving credit facility.
Can I use projected financial statements for a business with no revenue history?
Yes — and for pre-revenue startups, projected financial statements are the primary financial document in any funding application. Without historical financials, your projections carry more weight, not less, so the quality of your assumptions matters even more. The SBA explicitly allows startups to substitute projected financial statements for historical statements in loan applications, provided the projections are accompanied by a written narrative explaining each major assumption. For pre-revenue businesses, investors focus heavily on the market size assumption (is the total addressable market large enough to support your revenue projections?), the go-to-market strategy (how will you acquire customers at the projected CAC?), and the founding team’s relevant experience. A pre-revenue SaaS startup projecting $5 million in ARR by Year 3 needs to show exactly how it will acquire, retain, and expand those customers — month by month.
Conclusion
Projected financial statements are not a formality — they’re the analytical foundation that determines whether a lender approves your loan or an investor writes a check. The businesses that secure funding fastest are the ones whose projections show a clear, documented logic from revenue drivers through to cash flow and debt service coverage, with realistic industry-benchmarked margins and explicit scenario analysis.
I recommend downloading the EFM three-statement financial model as your starting point. It includes pre-linked income statement, balance sheet, and cash flow tabs, a dedicated assumptions page, automatic DSCR calculation, and scenario toggle — everything a lender or Series A investor expects to see, built correctly from the first cell.
























































