0 ITEMS

How Do You Size a New Market? A Step-by-Step Checklist

A new market is sized by defining its boundaries, gathering sourced data, calculating the total addressable market (TAM), serviceable addressable market (SAM) and serviceable obtainable market (SOM), and testing the result before it enters a financial model. This checklist gives seven steps and one worked example for a remote work software product.
Key Takeaways
- Market sizing estimates how much revenue a market can generate and how much of it one business can realistically win.
- Top-down sizing narrows a large published figure; bottom-up sizing multiplies real customers by price. Reconcile the two.
- In the illustrative global example at one list price, annual TAM is USD 71,215.20 million, SAM USD 14,243.04 million and base-case year-one SOM USD 7,121,520.
- Every assumption needs a source or a label, and a sensitivity test shows which input moves the answer most.
- A market that cannot be visited is sized from desk research: local statistics, trade data and a proxy market, then remote interviews.
Market sizing sets the ceiling that every forecast depends on
A market size caps the revenue that a plan, loan request or investor case can claim, so an error carries into every later number.
Small businesses created 20.7 million net new jobs in the United States between January 1995 and December 2024, the Small Business Administration’s Office of Advocacy reports.
Money is not guaranteed: in the 2026 Report on Employer Firms from the Federal Reserve Banks, 42% of financing applicants received the full amount they sought, in a survey of United States employer firms with 1 to 499 staff fielded from September to November 2025.
Top-down and bottom-up sizing answer different questions
Top-down sizing starts from a large published figure and narrows it with filters, while bottom-up sizing builds the market from customer counts and prices.
Top-down market sizing starts with the big picture
Top-down sizing takes an industry total and applies filters until only the relevant segment remains. The 2026 edition of the Office of Advocacy’s FAQ counts 36,207,130 small businesses in the United States, based on 2022 Census data, so a founder selling to small firms can start there and filter by sector, size and region. It is quick, but it inherits the source’s definitions.
Bottom-up market sizing builds from specific data
Bottom-up sizing multiplies the number of reachable customers by the revenue each pays, using customer surveys, pilot sales and unit economics, meaning the revenue and cost of serving one customer. It is slower, but each input can be tested.
| Method | Data sources | Pros | Cons | Best for |
|---|---|---|---|---|
| Top-down | Government statistics, industry reports | Fast, easy to cite | Broad, depends on source definitions | Early screening, investor context |
| Bottom-up | Customer surveys, pricing, unit economics | Testable, specific | Slow, needs primary data | Planning and financial models |
Your market sizing checklist: seven steps to accurate estimates
The seven steps run in order, and each one feeds the next.
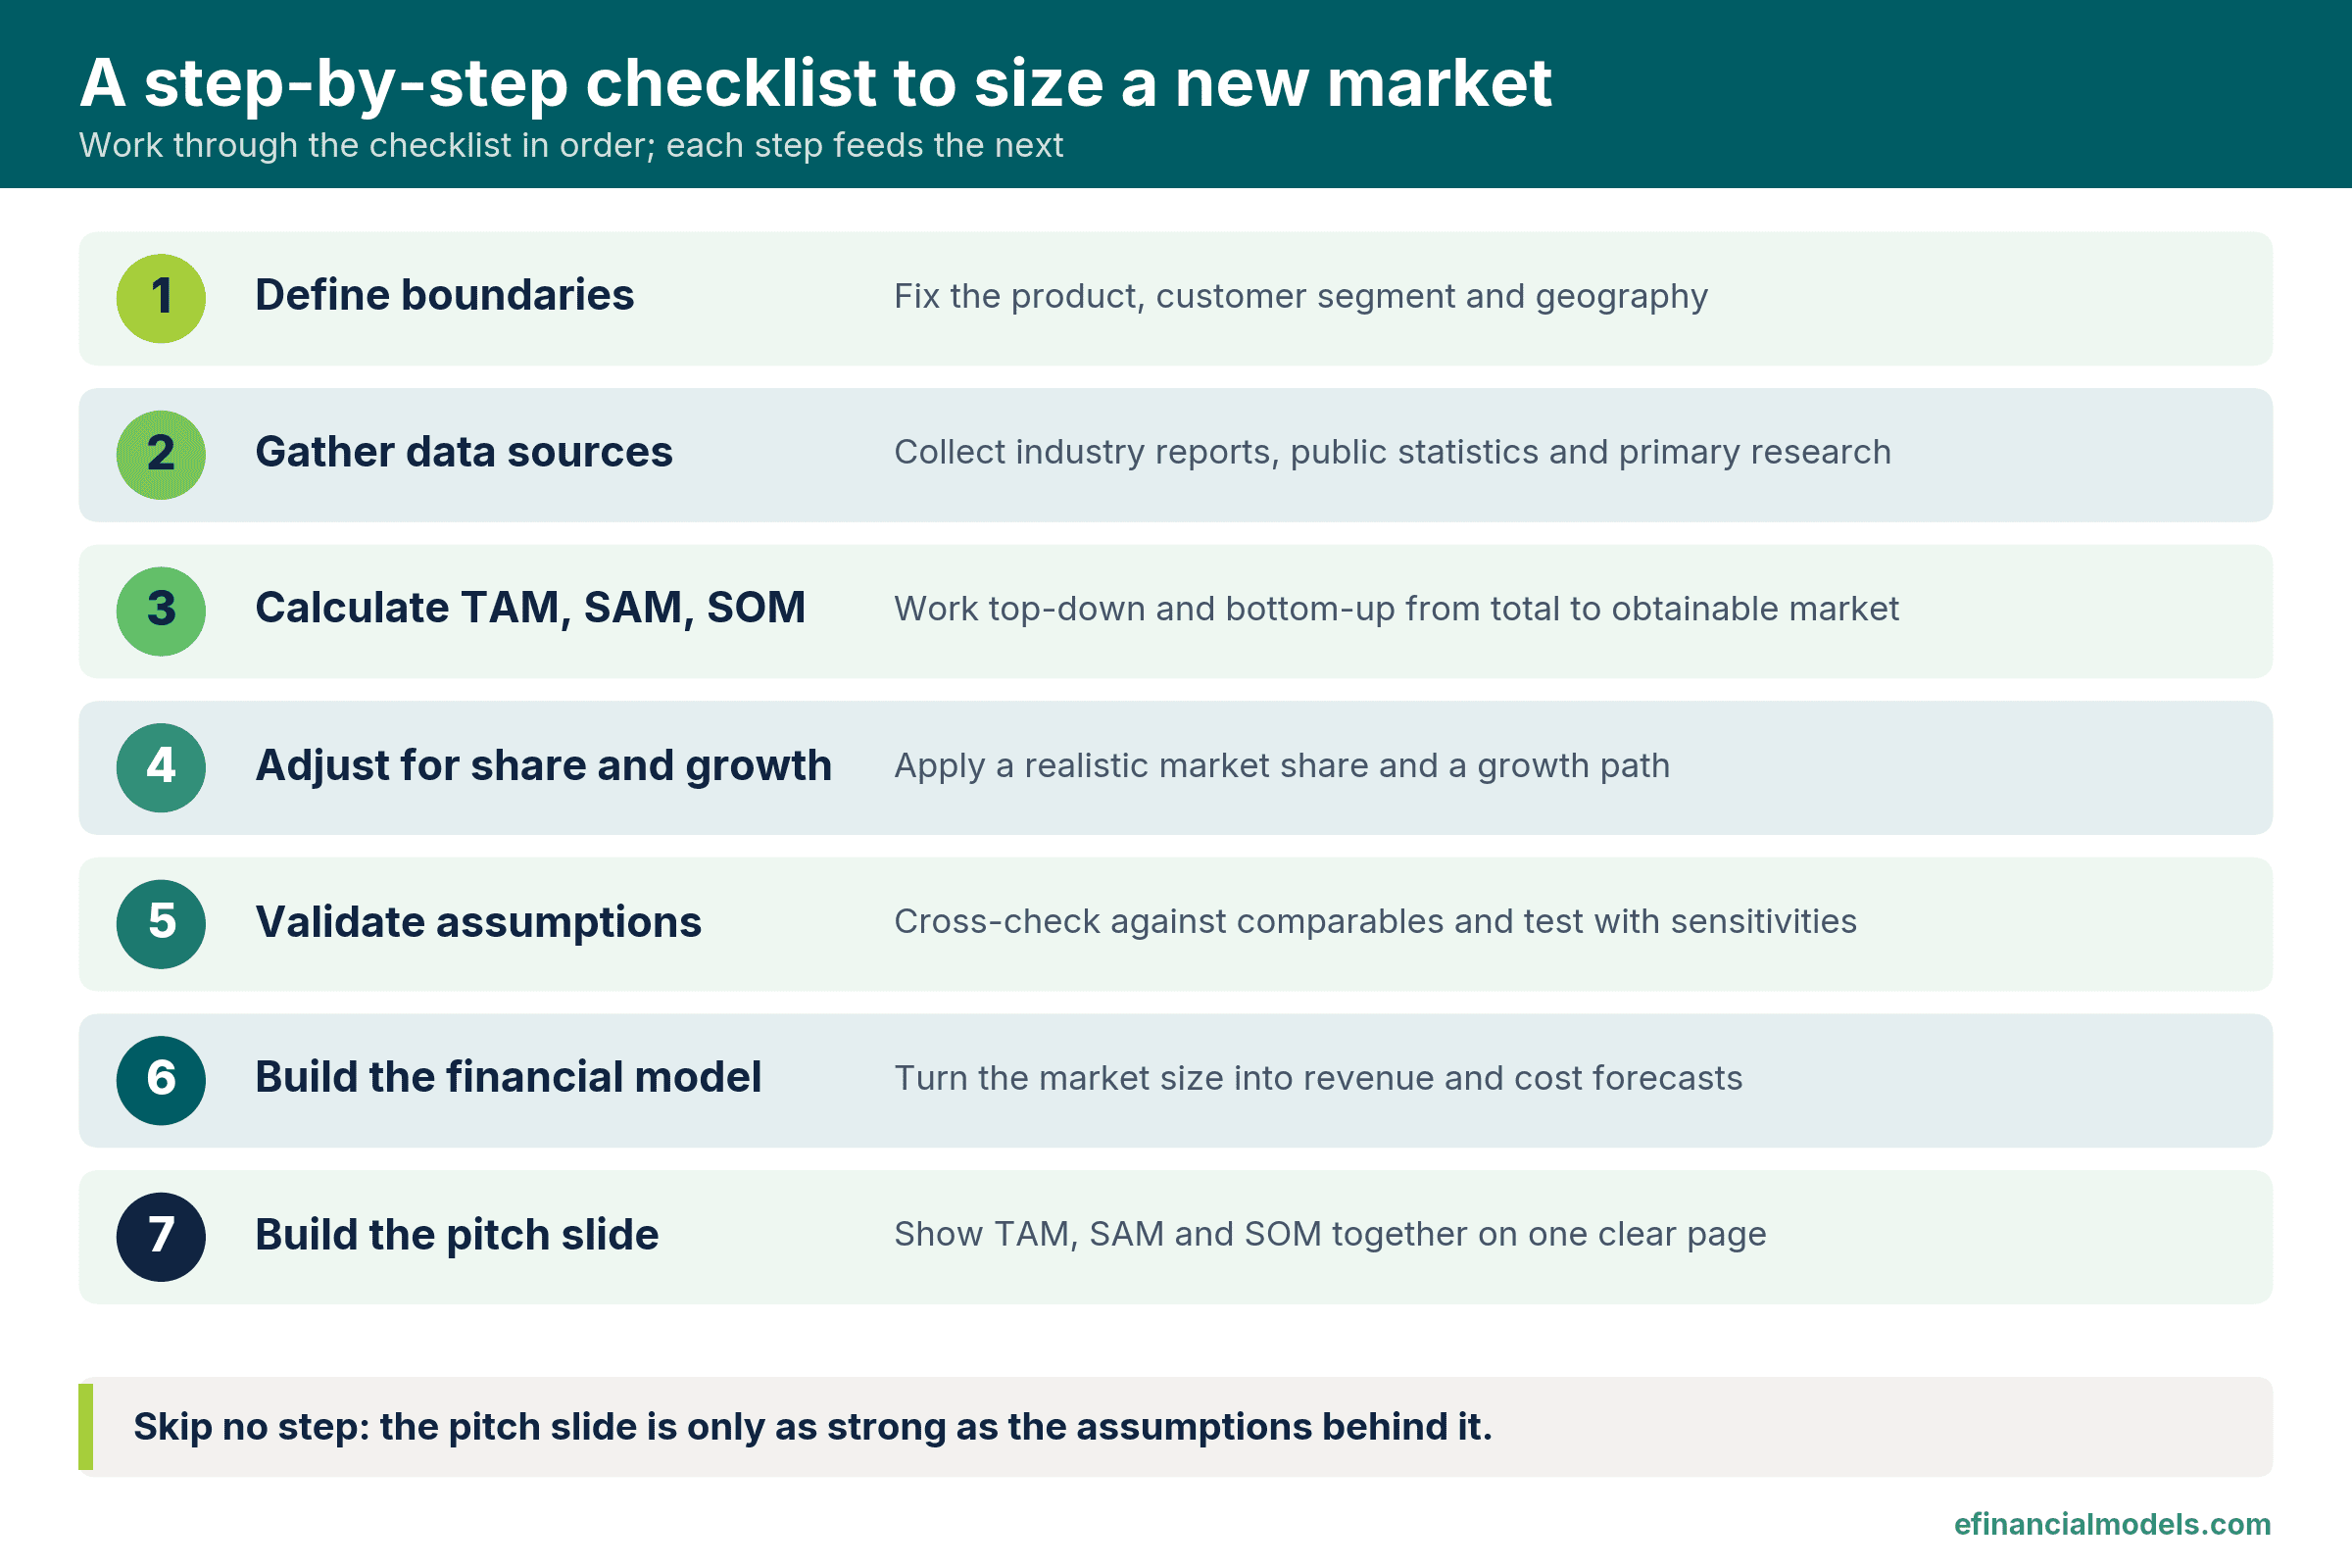
The seven steps in order, each one feeding the next.
Step 1: Define your market boundaries
Fix the geography, customer type and product scope before collecting any number. For remote markets, define remote explicitly: geography becomes the set of countries where the product can legally be sold and supported, because a work-from-anywhere buyer is not tied to a location.
Step 2: Gather reliable data sources
Combine public sources, such as national statistics offices, with private sources, such as customer interviews and paid research, and record each source’s year and geography beside the number. eFinancialModels market studies show how country and sector data can be organised.
Step 3: Calculate TAM, SAM and SOM
The total addressable market (TAM) is the revenue available if every possible customer bought. The serviceable addressable market (SAM) is the part of the TAM that the product, channels, geography and customer type can reach. The serviceable obtainable market (SOM) is the share of SAM the business can realistically win in a set period.
- TAM = potential customers × annual price per customer
- SAM = TAM × serviceable share
- SOM = SAM × obtainable share
Step 4: Adjust for market share and growth rates
Set the obtainable share from comparable launches where data exist, and label it illustrative where they do not. Then project growth with the compound annual growth rate (CAGR), the yearly rate that carries a starting value to an ending value: ending value = starting value × (1 + CAGR) ^ years.
Step 5: Validate your assumptions
Cross-check the bottom-up answer against an independent top-down figure, and interview about five prospective buyers about price and urgency. As editorial rules of thumb, a gap of more than a factor of two between the two methods means an assumption needs finding and fixing.
Step 6: Build your financial model
Link the market-size inputs to the revenue line, so a change in the obtainable share flows through to revenue, costs and cash. Keep market data on a separate inputs sheet and add a check cell that confirms SOM is no larger than SAM and SAM is no larger than TAM.
Step 7: Create your pitch deck slide
Show TAM, SAM and SOM as three nested figures with the source and year under each, and state the one assumption that matters most. Browse the eFinancialModels Pitch Decks tag for related investor material.
A market you cannot visit is sized from desk research
A market that cannot be visited is sized with four desk methods: local statistics offices and customs data for counts and trade volumes, a proxy market, remote interviews with local distributors and buyers, and published price lists. Proxy-market scaling uses: target market = proxy market × (target population ÷ proxy population) × (target income per person ÷ proxy income per person). Illustrative numbers: a proxy market of USD 200 million, 10 million people and USD 40,000 income per person; a target with 25 million people and USD 20,000 income gives 200 × 2.5 × 0.5 = USD 250 million. Commission local research when regulation, licensing or channel access, which desk data cannot show, drives the obtainable share.
Worked Example: Sizing the Remote Work Software Market
The scenario is a software as a service (SaaS) collaboration tool for remote teams, from the SaaS financial models category. Inputs marked as assumptions are illustrative.
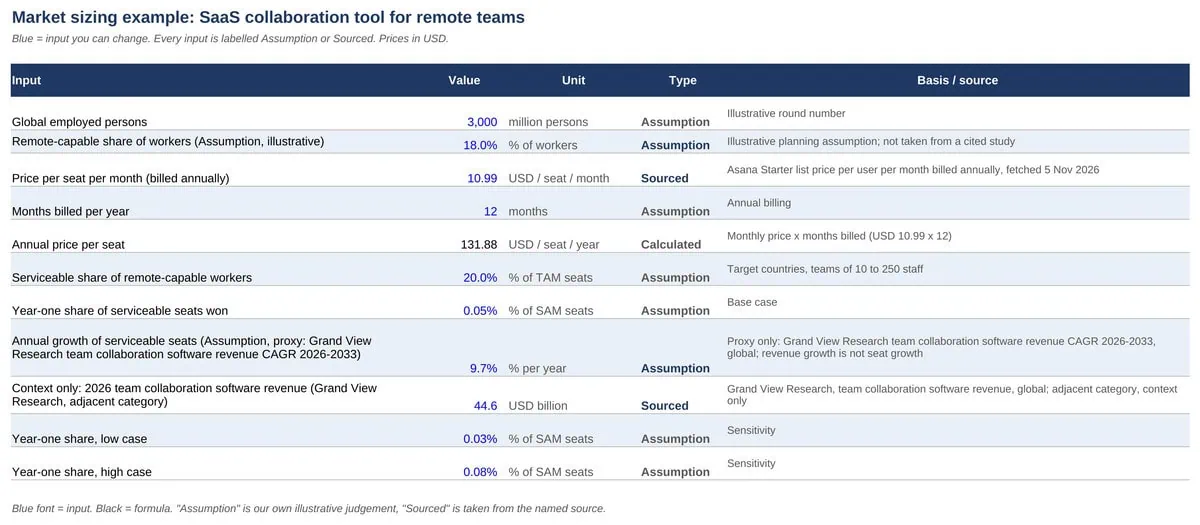
Inputs sheet of the worked example: blue cells hold the assumptions and sourced figures a reader can change.
Assume 3,000 million employed people worldwide, a round illustrative number. Assume 18% of workers are remote-capable, an illustrative share; that gives 540 million seats.
For price, Asana’s Starter plan lists USD 10.99 per user per month billed annually (fetched 5 November 2026), so a seat costs USD 10.99 × 12 months = USD 131.88 per year.
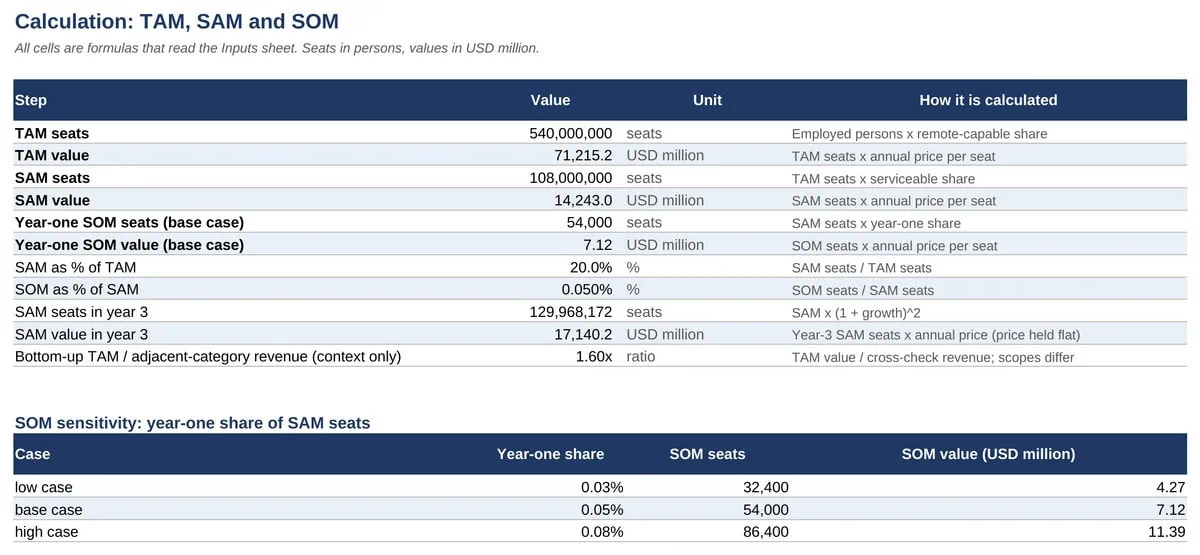
Calculation sheet: seats and value narrow from TAM to SAM to SOM, with growth and sensitivity steps.
The calculation follows Step 3. TAM seats are 3,000 million employed × 18% = 540 million, and TAM value is 540 million seats × USD 131.88 = USD 71,215.20 million. Assume a serviceable share of 20%: one in five remote-capable seats sits in a country where the product can be sold and supported and in a team of 10 to 250 staff. SAM is then 540 million × 20% = 108 million seats × USD 131.88 = USD 14,243.04 million. Assuming a 0.05% year-one share, which is illustrative and not taken from a comparable launch, base-case year-one SOM is 54,000 seats × USD 131.88 = USD 7,121,520.
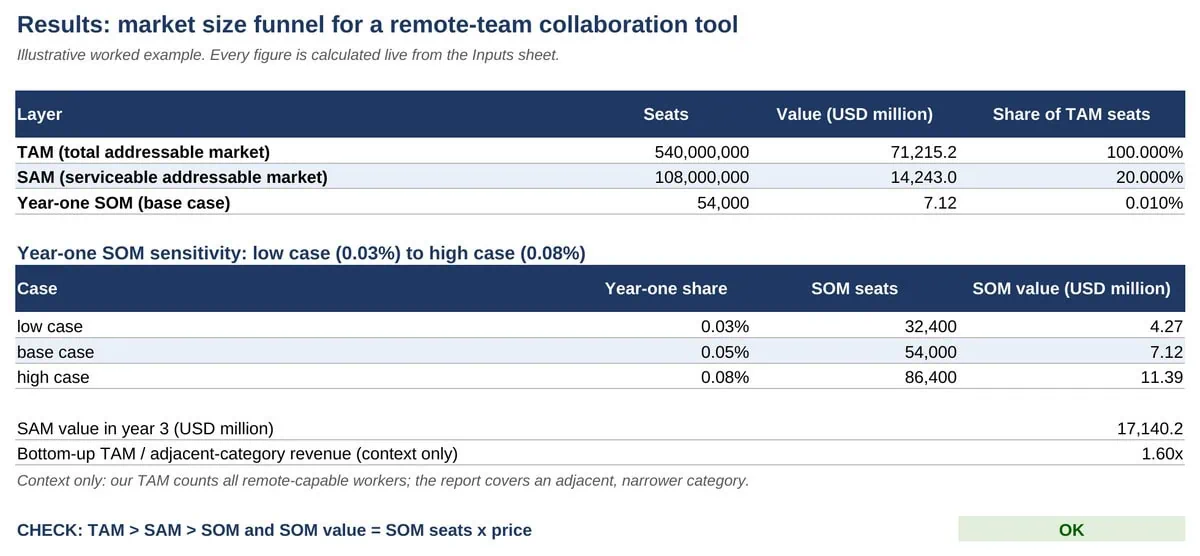
Results sheet: the market funnel, the year-one sensitivity and the reconciliation check in one table.
For Step 4, assume SAM seats grow at the 9.7% annual rate that Grand View Research projects for team collaboration software revenue from 2026 to 2033, used here as a proxy that probably overstates seat growth, because revenue growth also includes price changes. SAM after two years is then USD 14,243.04 million × 1.097 × 1.097 = USD 17,140.20 million. For Step 5, the same source sizes 2026 revenue in that adjacent category at USD 44.6 billion (USD 44,600 million), which is context, not proof. The seat-based TAM is 1.60 times that figure because it prices every remote-capable seat at list, so TAM is a ceiling and SAM is the planning number. Low and high cases of 0.03% and 0.08%, flexing the least supported input, give year-one SOM of USD 4,272,912 and USD 11,394,432, so year-one SOM scales one-for-one with the share assumption. Because the inputs are round illustrative numbers, the results are exact arithmetic but only rough estimates.
Common market sizing mistakes and how to avoid them
Mistake 1: Overestimating market size
Treating a global total as the target market inflates the forecast, an inflated forecast raises funding needs and collapses under investor diligence when the shortfall appears.
Mistake 2: Using outdated data
Source data ages: the Office of Advocacy’s 2026 FAQ builds its small business count on 2022 Census data, so a market sized in 2026 from it still lags reality. Every figure should carry the year of its source.
Mistake 3: Ignoring competition
Discount the segments that funded incumbents already serve, and test the share assumption against rivals’ known customer counts.
Mistake 4: Confusing addressable and serviceable markets
TAM counts every possible customer, while SAM counts only the customers that the product, channels, geography and customer type can reach. Presenting TAM as the target market misleads investors.
Mistake 5: Not testing sensitivity
Give each key input a low and a high case, and record the change in year-one SOM. Sensitivity analysis, meaning the practice of changing one input at a time to see how the result moves, shows which assumption deserves more research.
Tools and templates for efficient market sizing
Spreadsheet software keeps every assumption visible, national statistics portals and paid industry reports supply sector inputs, and a ready forecasting template saves rebuilding formulas for each new market.
Frequently Asked Questions
How often should a market size be updated?
Update it whenever a major input changes, and at least once a year. Fast-moving categories, such as software or consumer technology, justify a quarterly review of price, share and growth. Each update should carry a dated note of what changed, so investors can see the estimate evolving instead of a single frozen number, and so the next reviewer knows which assumptions were tested most recently.
Can market sizing be used for an existing business?
Yes. An established company uses it to judge expansion into a new country, a new segment or a price change. The starting point is better, because actual customer counts, churn and sales cycles replace guesses. The result shows whether growth targets fit inside the serviceable market or whether the business is already close to saturating it, which is a useful warning before new spending.
Which data sources are the most reliable?
Primary sources rank first: statistics offices, central banks, regulators and the company’s own sales records. Industry reports come next, provided their method and date are visible. Press articles and blog posts rank last, because they often repeat unsourced figures. Prefer the underlying document over a summary of it, and treat any figure without a named publisher and date as an assumption until it is confirmed.
How should the sizing be defended in investor questions?
Expect three challenges: where the numbers came from, why the share assumption is realistic and what happens if it is wrong. Prepare a one-line source for every input, a comparable company that reached a similar share, and the sensitivity table. Candid ranges persuade better than a single precise figure, and an admitted weak assumption builds more trust than a hidden one.
How should geographic constraints be handled?
Treat each country as a layer with its own conditions. Law, language, payment methods and data rules decide whether a sale is possible, so list them per country before counting buyers. Rank countries by size and by ease of entry, then add them to the serviceable market in that order, which shows when expansion starts to pay back and which launch can wait for a later year.
Conclusion
A market size is credible when every input has a source or a label and the result survives a sensitivity test. Founders who want to turn a year-one target into a forecast can start from the eFinancialModels SaaS Business Financial Model.