0 ITEMS

Airbnb Spreadsheet: Track Revenue, Costs and Profit by Month

An Airbnb spreadsheet works when it records every booking, sorts every cost into a fixed category and subtracts the second from the first each month to show net profit, the money left after all listed expenses and before income tax. This guide covers the sections to include, a worked Excel example with hypothetical numbers and a five-step build.
Key Takeaways
- A useful Airbnb spreadsheet has six sections: occupancy, revenue by listing, categorised expenses, profitability, tax tracking and a monthly dashboard.
- Net profit equals gross revenue minus total expenses, and occupancy rate equals booked nights divided by the nights available to book.
- In the hypothetical example, one listing earns USD 17,591 net profit before income tax, and USD 11,591 remains after loan principal.
- Cleaning fees, platform fees and the mortgage split between interest and principal are three items a spreadsheet should record separately.
- A spreadsheet costs nothing and bends to any listing, while paid software mainly adds receipt scanning and automation beyond small free limits.
Hosts need their own spreadsheet because Airbnb reports payouts, not profit
Airbnb shows bookings and payouts, but the mortgage, utilities, repairs and cleaning bills sit outside the platform, so only a host’s own record shows what is left after costs. The scale of hosting makes the habit worth building: Airbnb states that more than 5.5 million hosts use the platform, that hosts have earned more than $380 billion all-time, and that the typical US host earned $15.6K in 2025 (Airbnb Newsroom, May 2026). Revenue says nothing about profit until costs are subtracted.
A dedicated spreadsheet handles several listings, seasonal swings, category-level costs and year-end tax preparation in one file. It carries no monthly fee, and a host can rename columns freely.
Six sections make an Airbnb spreadsheet complete
- Occupancy tracking. Occupancy rate is booked nights divided by nights available to book. Average daily rate is accommodation revenue divided by booked nights, before cleaning fees.
- Revenue by listing. One row per reservation, with cleaning fees and extra-guest charges in their own columns so per-night averages stay clean.
- Expense categories. Cleaning, maintenance and repairs, supplies, insurance, utilities, mortgage interest or rent, and platform fees. Loan principal repayments are a financing cash outflow, not an expense, because they reduce the loan balance, so the sheet shows them as a memo line after net profit.
- Profitability. Net profit is gross revenue minus total expenses, and profit margin is net profit divided by gross revenue.
- Tax tracking. A tag on each cost line that marks whether it is likely deductible.
- Monthly dashboard. Totals by month, so slow seasons and busy seasons show up side by side.
The Internal Revenue Service (IRS) states in Publication 527 (2025) that owners can deduct ordinary and necessary expenses for managing, conserving or maintaining rental property. Its list of common expenses includes cleaning and maintenance, insurance, mortgage interest paid to banks, repairs and utilities, so a tax tag per cost line makes year-end reporting faster. These are United States rules, and hosts elsewhere should check their local ones.
The platform fee deserves its own input cell because it differs by host. Airbnb’s help page says most hosts on the split-fee structure pay 3%, most hosts on the single-fee structure pay 15.5%, and the split fee is being phased out (Airbnb Help Center, accessed November 2026). A host’s payout statement shows which structure applies.
Worked example: one hypothetical 2-bedroom listing earns USD 17,591 in a year
In this example, one hypothetical listing charges a base rate of USD 150 per night and a USD 60 cleaning fee per stay, and the platform fee is assumed at 3.0% of booking revenue, the split-fee rate quoted above. A host on the single fee would enter 15.5% in the same input cell, and net profit would fall. Monthly fixed costs total USD 1,215: mortgage interest 900, utilities 180, insurance 95 and internet and software 40. Each stay costs USD 55 for the cleaner and USD 12 for supplies, and a loan principal repayment of USD 500 a month sits outside expenses. All figures are illustrative, not benchmarks for any market.
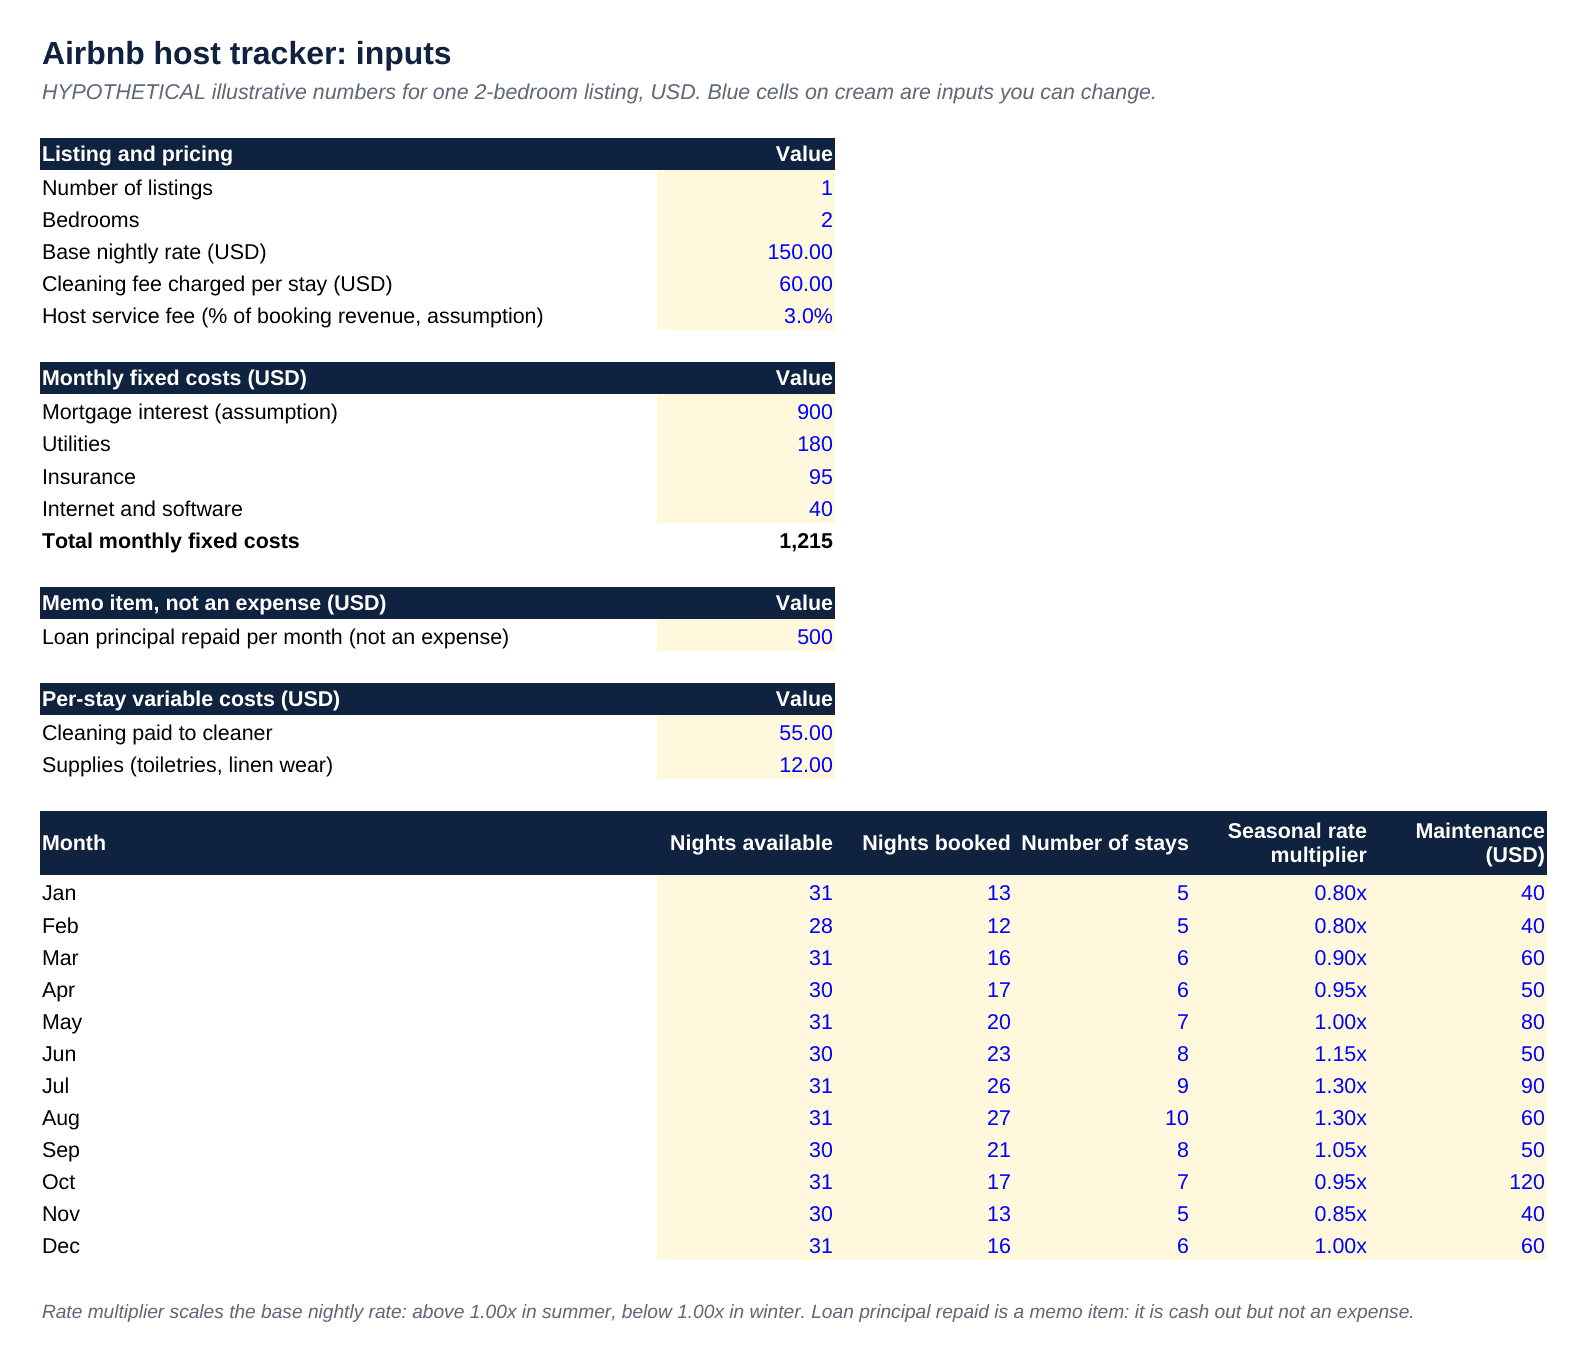
The inputs sheet holds every assumption of the hypothetical listing, and each blue cell can be changed. Source: eFinancialModels Analysis
Each month, formulas divide booked nights by available nights for occupancy, and multiply nights by the seasonal rate for accommodation revenue. August shows the full chain: 27 nights at USD 195 give USD 5,265, and ten cleaning fees of USD 60 lift gross revenue to USD 5,865. Expenses add up to USD 2,121: platform fee USD 176, cleaning USD 550, supplies USD 120, fixed costs USD 1,215 and maintenance USD 60. Net profit is therefore USD 5,865 minus USD 2,121, or USD 3,744, a margin of 63.8%. February runs the other way: 12 nights at USD 120 give gross revenue of USD 1,740 against expenses of USD 1,642, so net profit is only USD 98.
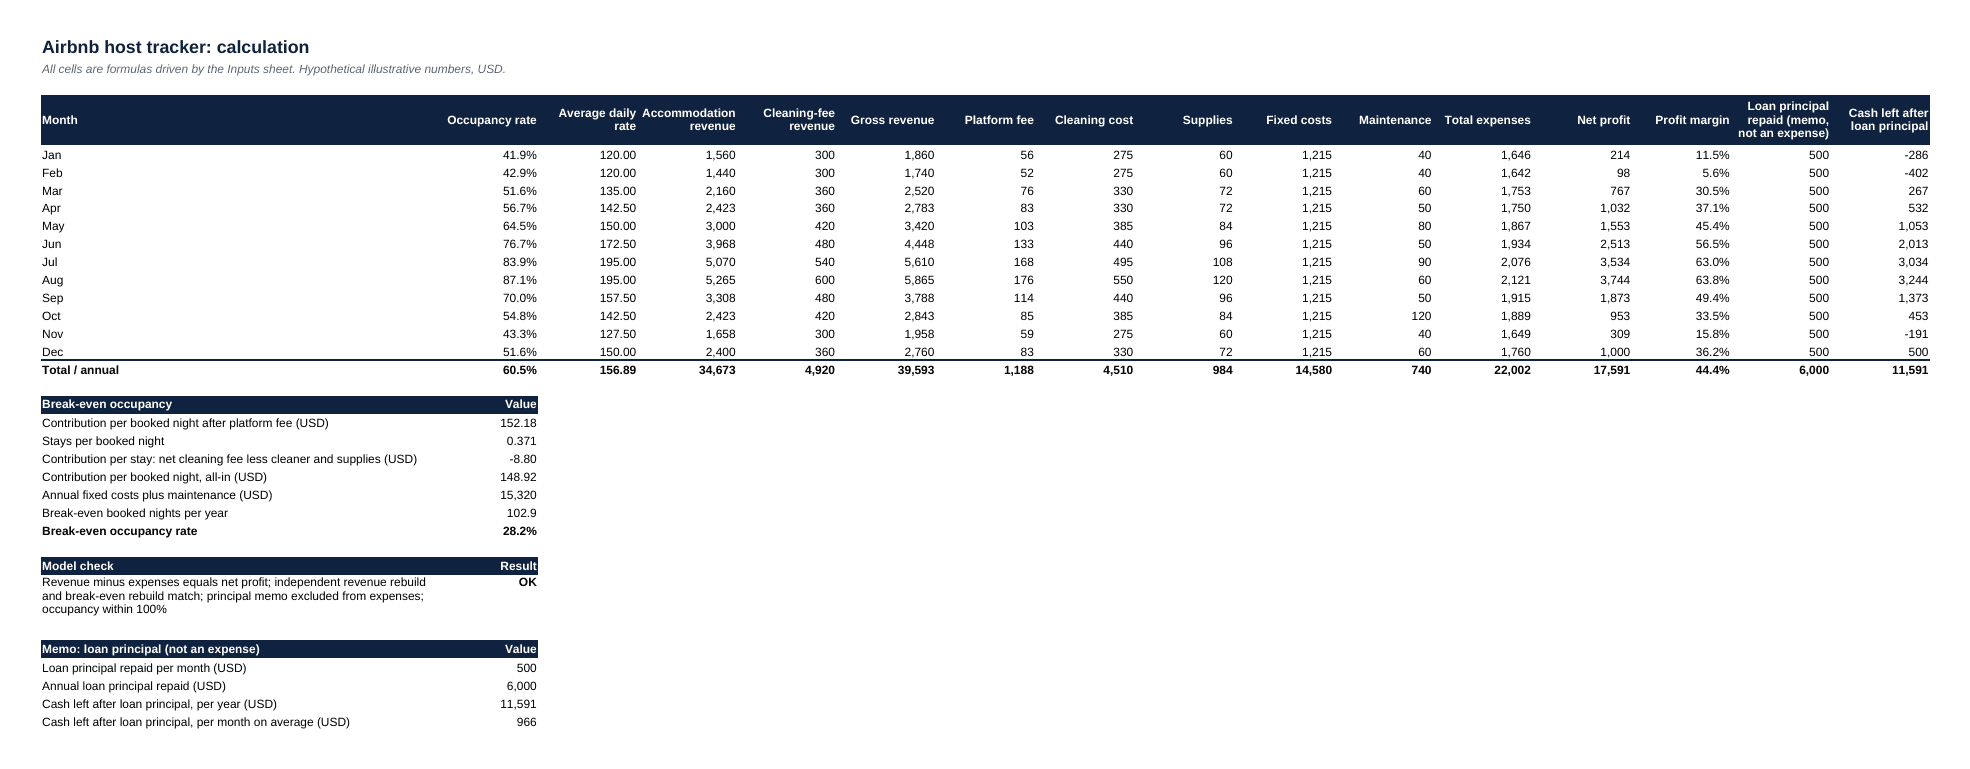
The calculation sheet turns the inputs into twelve monthly rows of revenue, cost and profit, with annual totals and a check cell. Source: eFinancialModels Analysis
Over the year, 221 of 365 nights were booked, an occupancy rate of 60.5%, and the average daily rate was USD 156.89. Gross revenue is USD 39,593 and total expenses are USD 22,002, leaving net profit of USD 17,591 (USD 39,593 minus USD 22,002) and a profit margin of 44.4% (USD 17,591 divided by USD 39,593). Every month earns a profit, and August earns the most. Loan principal repaid is USD 6,000 over the year, which is not an expense, so cash left after loan principal is USD 11,591.
Break-even occupancy is the occupancy rate at which net profit is zero. After the platform fee and per-stay costs, each booked night contributes USD 148.92 toward annual fixed costs and maintenance of USD 15,320. That requires 102.9 booked nights, or 28.2% occupancy, which sits 32.4 percentage points below the actual occupancy rate of 60.5%. A check cell on the sheet confirms that revenue minus expenses equals net profit and reads OK.
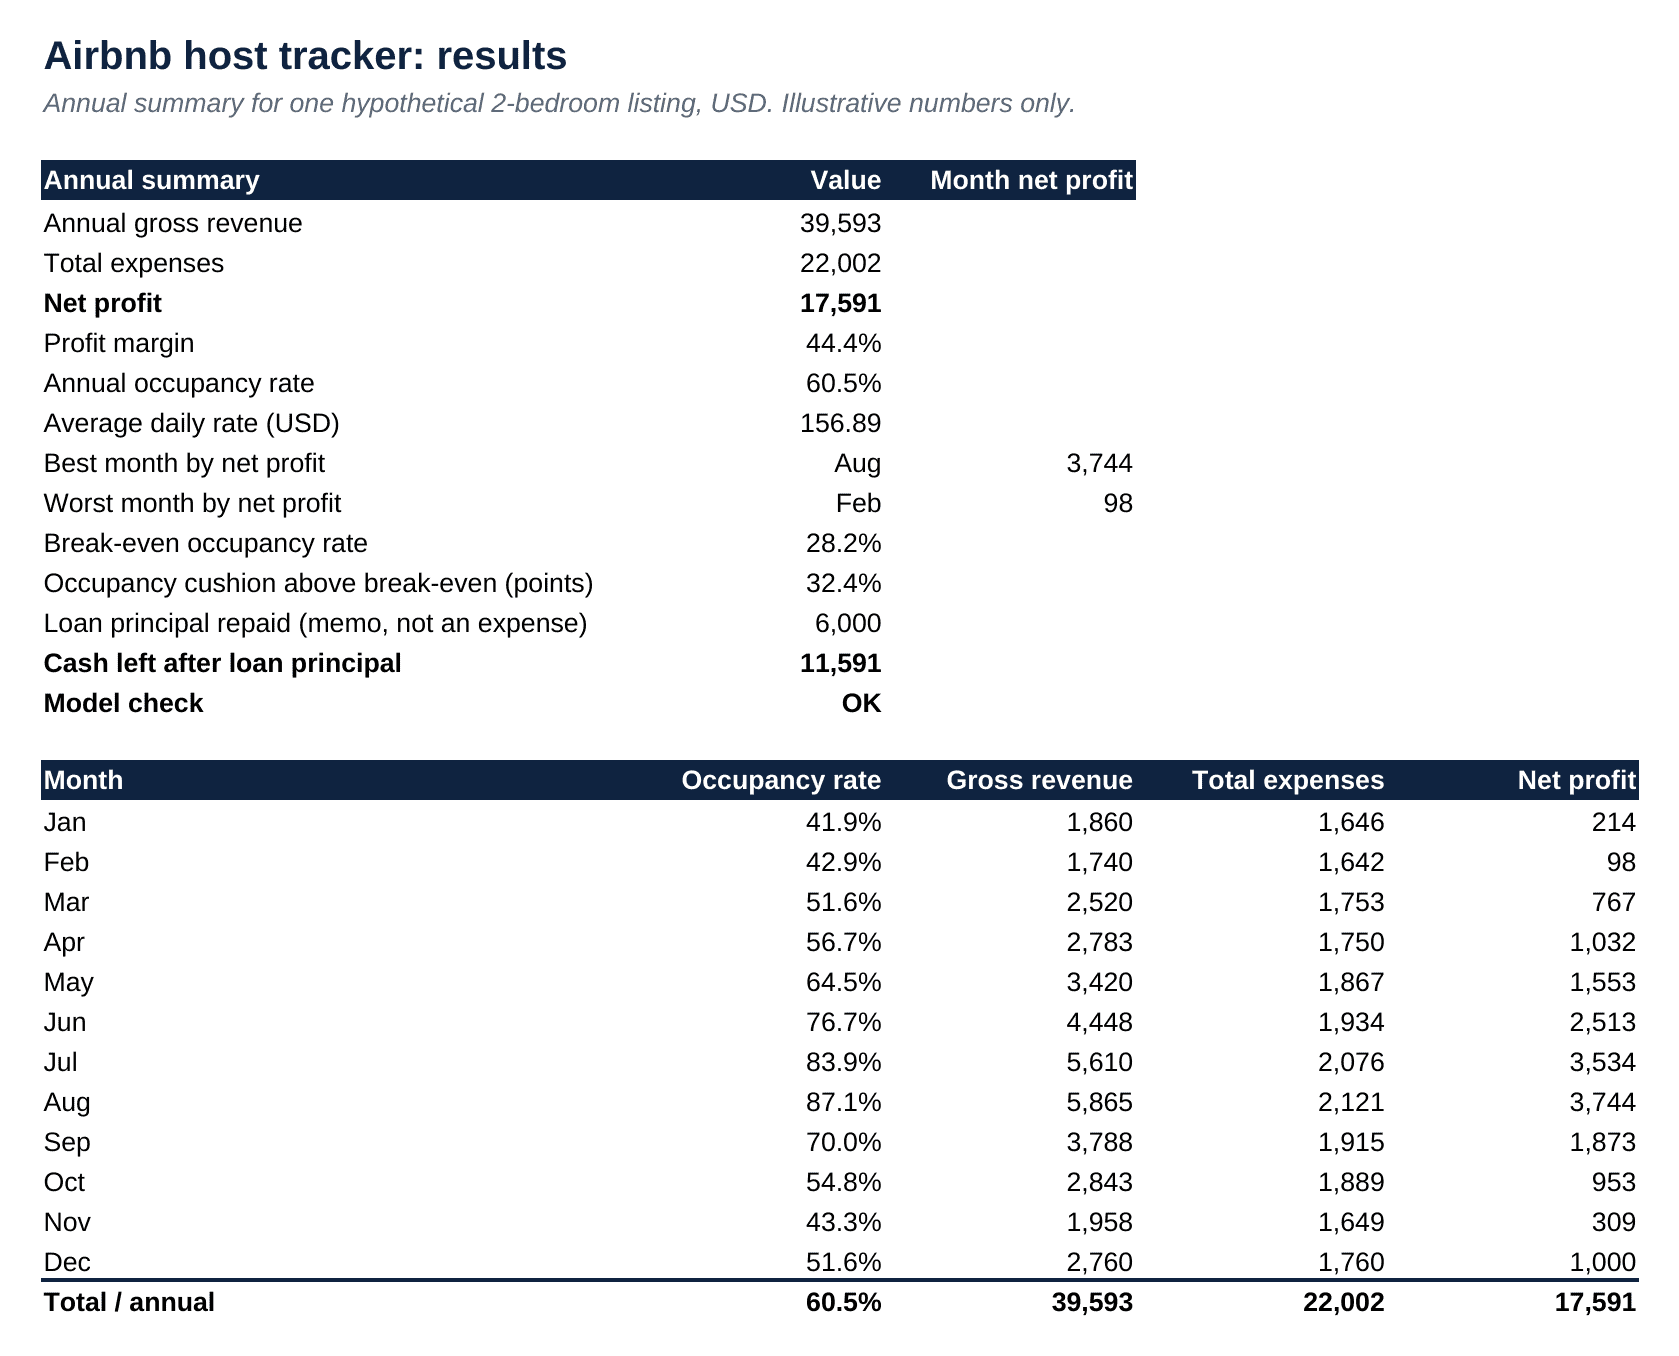
The results sheet summarises the year and flags the best and worst months by net profit. Source: eFinancialModels Analysis
Five steps build the spreadsheet

The five stages of tracking an Airbnb rental run from listing set-up to seasonal analysis.
- Set up the listing inventory. Record name, location, bedrooms, base nightly rate, cleaning fee and the platform fee as separate input cells.
- Record bookings and revenue. Add one row per reservation with date, listing, guest, nights, accommodation revenue, cleaning fee and notes.
- Log expenses with fixed categories. Use a drop-down list for the category column, and record mortgage interest apart from principal because the IRS list names interest.
- Calculate net profit. Total revenue and expenses by month, then subtract: net profit is revenue minus expenses, and margin is net profit divided by revenue.
- Analyse seasonal trends. Chart occupancy and net profit by month, and compare each month with the break-even occupancy.

Housing, cleaning, repairs, insurance and utilities are the main cost groups behind step three.
A spreadsheet wins on cost and control, software wins on automation
| Spreadsheet | Stessa | Shoeboxed | |
|---|---|---|---|
| Cost | Free in Excel or Google Sheets | Free Essentials plan, paid plans above it | USD 97 a year, or USD 8.08 a month on annual billing |
| Receipt handling | Manual entry or attached files | Free plan scans 5 receipts a month | Starter plan scans 50 a month |
| Layout | The host defines every column | Set by the vendor | Set by the vendor |
Comparison of the three options, using vendor pricing pages checked in November 2026.
Stessa lists a free Essentials plan with unlimited properties and five receipt scans a month (Stessa pricing, 2026). Shoeboxed lists its Starter plan at USD 97 a year, which is USD 8.08 a month on annual billing, with 50 digital scans a month (Shoeboxed pricing, 2026).
Hosts who prefer a prebuilt forecast can browse the Airbnb financial models category or the wider Real Estate category, and the Rental Income tag groups models built around rent revenue.
Five mistakes skew an Airbnb spreadsheet
- Mixing cleaning fees into the nightly rate. The average daily rate then looks higher than the rate guests actually pay for the room.
- Leaving out the platform fee. Revenue and profit are overstated until the fee sits in its own column.
- Keeping no backup. One corrupted file can erase a year of records, so save a dated copy each month in cloud storage.
- Updating rarely. Entries made weeks late are hard to match against payouts, so reconciliation turns into guesswork.
- Typing categories by hand. Spelling variants split one cost into several lines, and drop-down lists with data validation prevent that.
Frequently Asked Questions
Can Google Sheets track Airbnb finances as well as Excel?
Yes. Google Sheets supports the same layout of input cells, monthly rows and subtotal formulas, and it adds sharing, which helps when a co-host or bookkeeper needs access. Very large files can feel slower in a browser, and some advanced Excel features behave differently, but for one to five listings either tool works, and basic formulas work in both. Version history in Google Sheets also helps undo accidental edits.
How should blocked nights and owner stays count in occupancy?
Pick one rule and apply it every month. The cleaner method keeps the formula from the body, booked nights over nights available to book, and removes nights the host blocked for personal use or repairs from the nights available, because the property could not be sold on those dates. Record owner stays and repair blocks in separate columns so every blocked night stays auditable, and keep the same rule in every month, because a rule that changes midway makes the trend line unreliable.
Do the tax rules change when a home is rented for only a few days?
They can. Publication 527 states that when an owner also uses a home as a residence and rents it fewer than 15 days in the tax year, the rent is not included in income (IRS Publication 527, 2025). Longer rentals of a home with personal use follow other rules that depend on the number of personal days, so a spreadsheet should log personal-use nights in their own column. A tax professional can confirm the rules for a specific property.
How often should a host update the spreadsheet?
Weekly is a practical minimum, and entering each booking or bill on the day it arrives is better. Frequent updates keep the sheet close to the payout statements, which makes mismatches easy to spot while the details are fresh. A monthly review that compares totals with the bank balance catches formula errors early. Weekly entries also keep receipts, guest messages and payout emails easy to find when a question comes up.
When does a host outgrow a spreadsheet?
The usual signals are a growing stack of paper receipts, many listings with separate owners, and several people editing the same file. At that point, manual entry can cost more time than software that scans receipts and produces owner reports. Until then, a well-organised spreadsheet keeps full control and can still be exported later, so the early files are never wasted and the history carries over.
Conclusion
An Airbnb spreadsheet turns scattered bookings and bills into one view of occupancy, revenue, costs and net profit, and the hypothetical example shows why monthly tracking matters: a listing that earns USD 17,591 net profit in a year keeps only USD 11,591 once loan principal is paid, and its February profit is USD 98. Hosts who want to forecast a single unit beyond this tracker can use eFinancialModels’ Single Airbnb Rental Unit Financial Model, an Excel model with inputs for occupancy, nightly rental fee, cleaning fee and seasonal factors, and a 10-year monthly forecast.