0 ITEMS

Airbnb Spreadsheet Template: Free Layout to Track Profit

A free Airbnb spreadsheet template needs only three tabs (inputs, calculation and results), and it answers one question: does a listing earn more cash than it costs after the loan payment. This guide gives the full layout, every formula and an illustrative example in which one listing earns $3,629 a year before tax.
Key Takeaways
- A working template needs three tabs: inputs for assumptions, a calculation tab for the annual profit and loss, and a results tab for return metrics.
- Net operating income (NOI) is booking revenue minus operating costs, before loan payments and income tax, so it measures the property itself.
- In the illustrative example, 219 booked nights produce $38,325 of revenue, $21,029 of NOI and $3,629 of pre-tax cash flow.
- The illustrative cash-on-cash return of 4.03%, cap rate of 7.01% and coverage ratio of 1.21 each answer a different question.
- Illustrative break-even occupancy is 52.8%, so at 50% occupancy and a $150 rate, pre-tax cash flow after loan payments is negative.
What Does a Free Airbnb Spreadsheet Template Need to Include?
A usable template needs five lines in a fixed order: booking revenue, operating costs, net operating income, loan payments and cash flow. Net operating income (NOI) is booking revenue minus operating costs, before loan payments and income tax. Three tabs keep that order clean. The inputs tab holds every assumption in one place, the calculation tab turns those assumptions into an annual profit and loss, and the results tab converts the profit into return metrics.
This guide gives a layout to build, not a file to download, and the layout is quick to build in any spreadsheet program. Hosts who prefer a ready-made structure can browse the eFinancialModels Airbnb financial models.
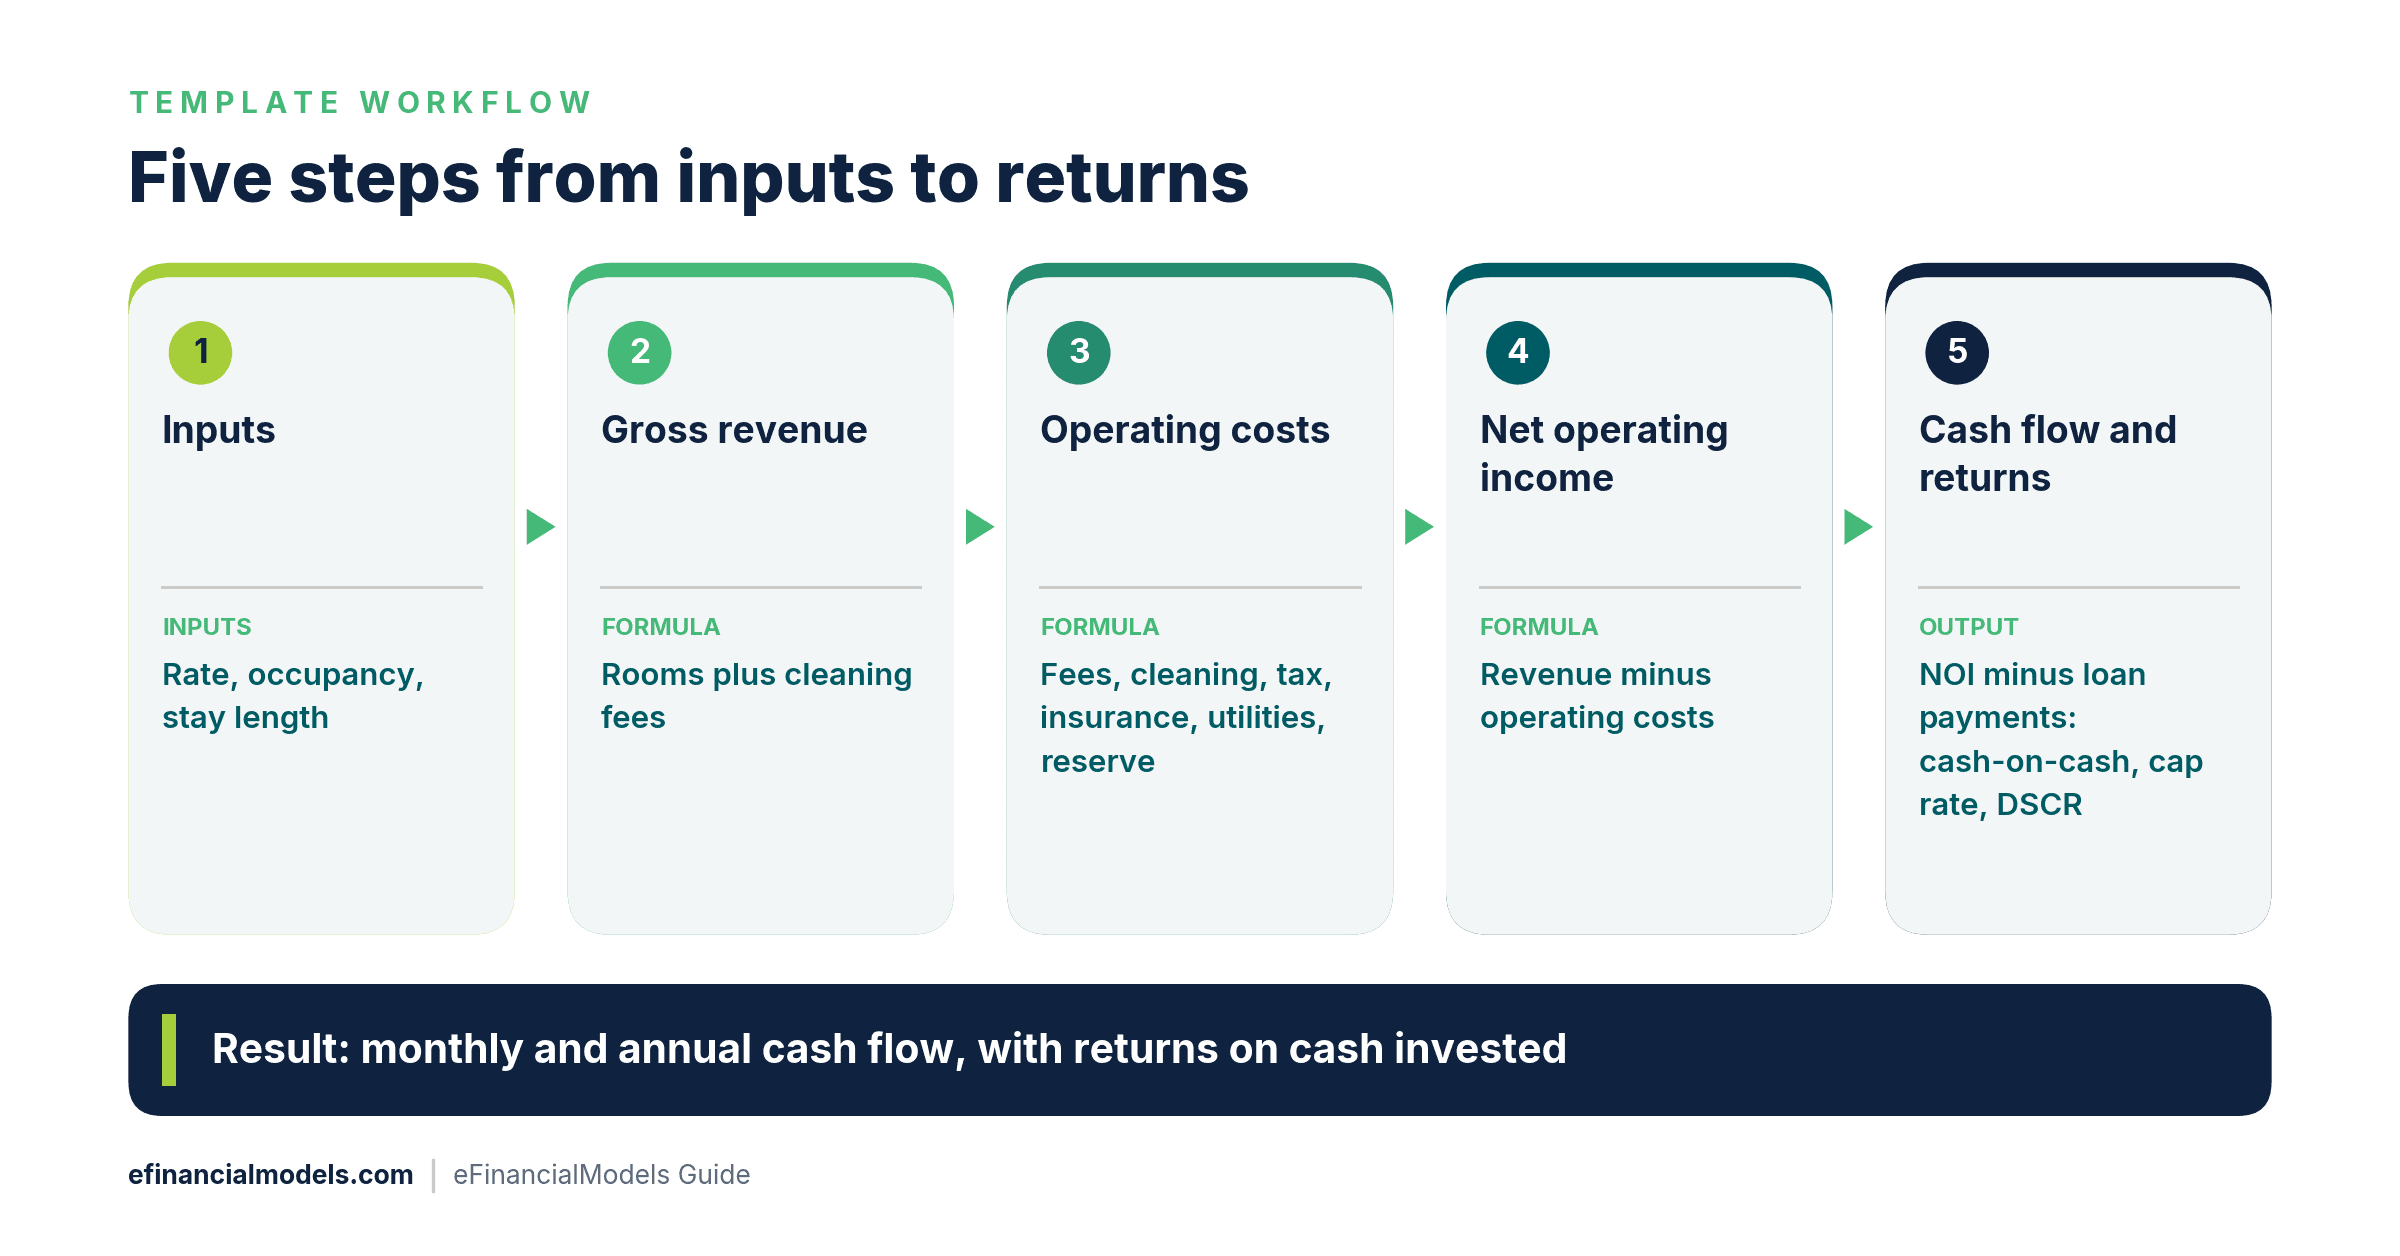
Five-step flow of the template, from the inputs tab to the cash flow and return metrics on the results tab.
What Goes on the Inputs Tab?
The inputs tab lists every number a host controls or estimates, with one value per cell and no formulas. The average daily rate (ADR) is the average room revenue earned per booked night. The example below assumes one illustrative listing with the following inputs.
| Input | Illustrative value |
|---|---|
| Nightly rate (ADR) | $150 |
| Occupancy | 60% of 365 days |
| Average stay | 3 nights |
| Cleaning fee charged to guest | $75 per stay |
| Cleaning cost paid | $70 per stay |
| Platform fee | 3% of room revenue plus cleaning fees |
| Mortgage payment (principal and interest) | $1,450 per month |
| Property tax / insurance | $2,400 / $1,800 per year |
| Utilities and internet / supplies | $320 / $90 per month |
| Maintenance and furnishing reserve | 5% of booking revenue |
| Purchase price / cash invested | $300,000 / $90,000 |
The $90,000 covers the down payment, closing costs and furnishing, and the $1,450 monthly payment is the principal and interest on the loan that funds the rest of the purchase.
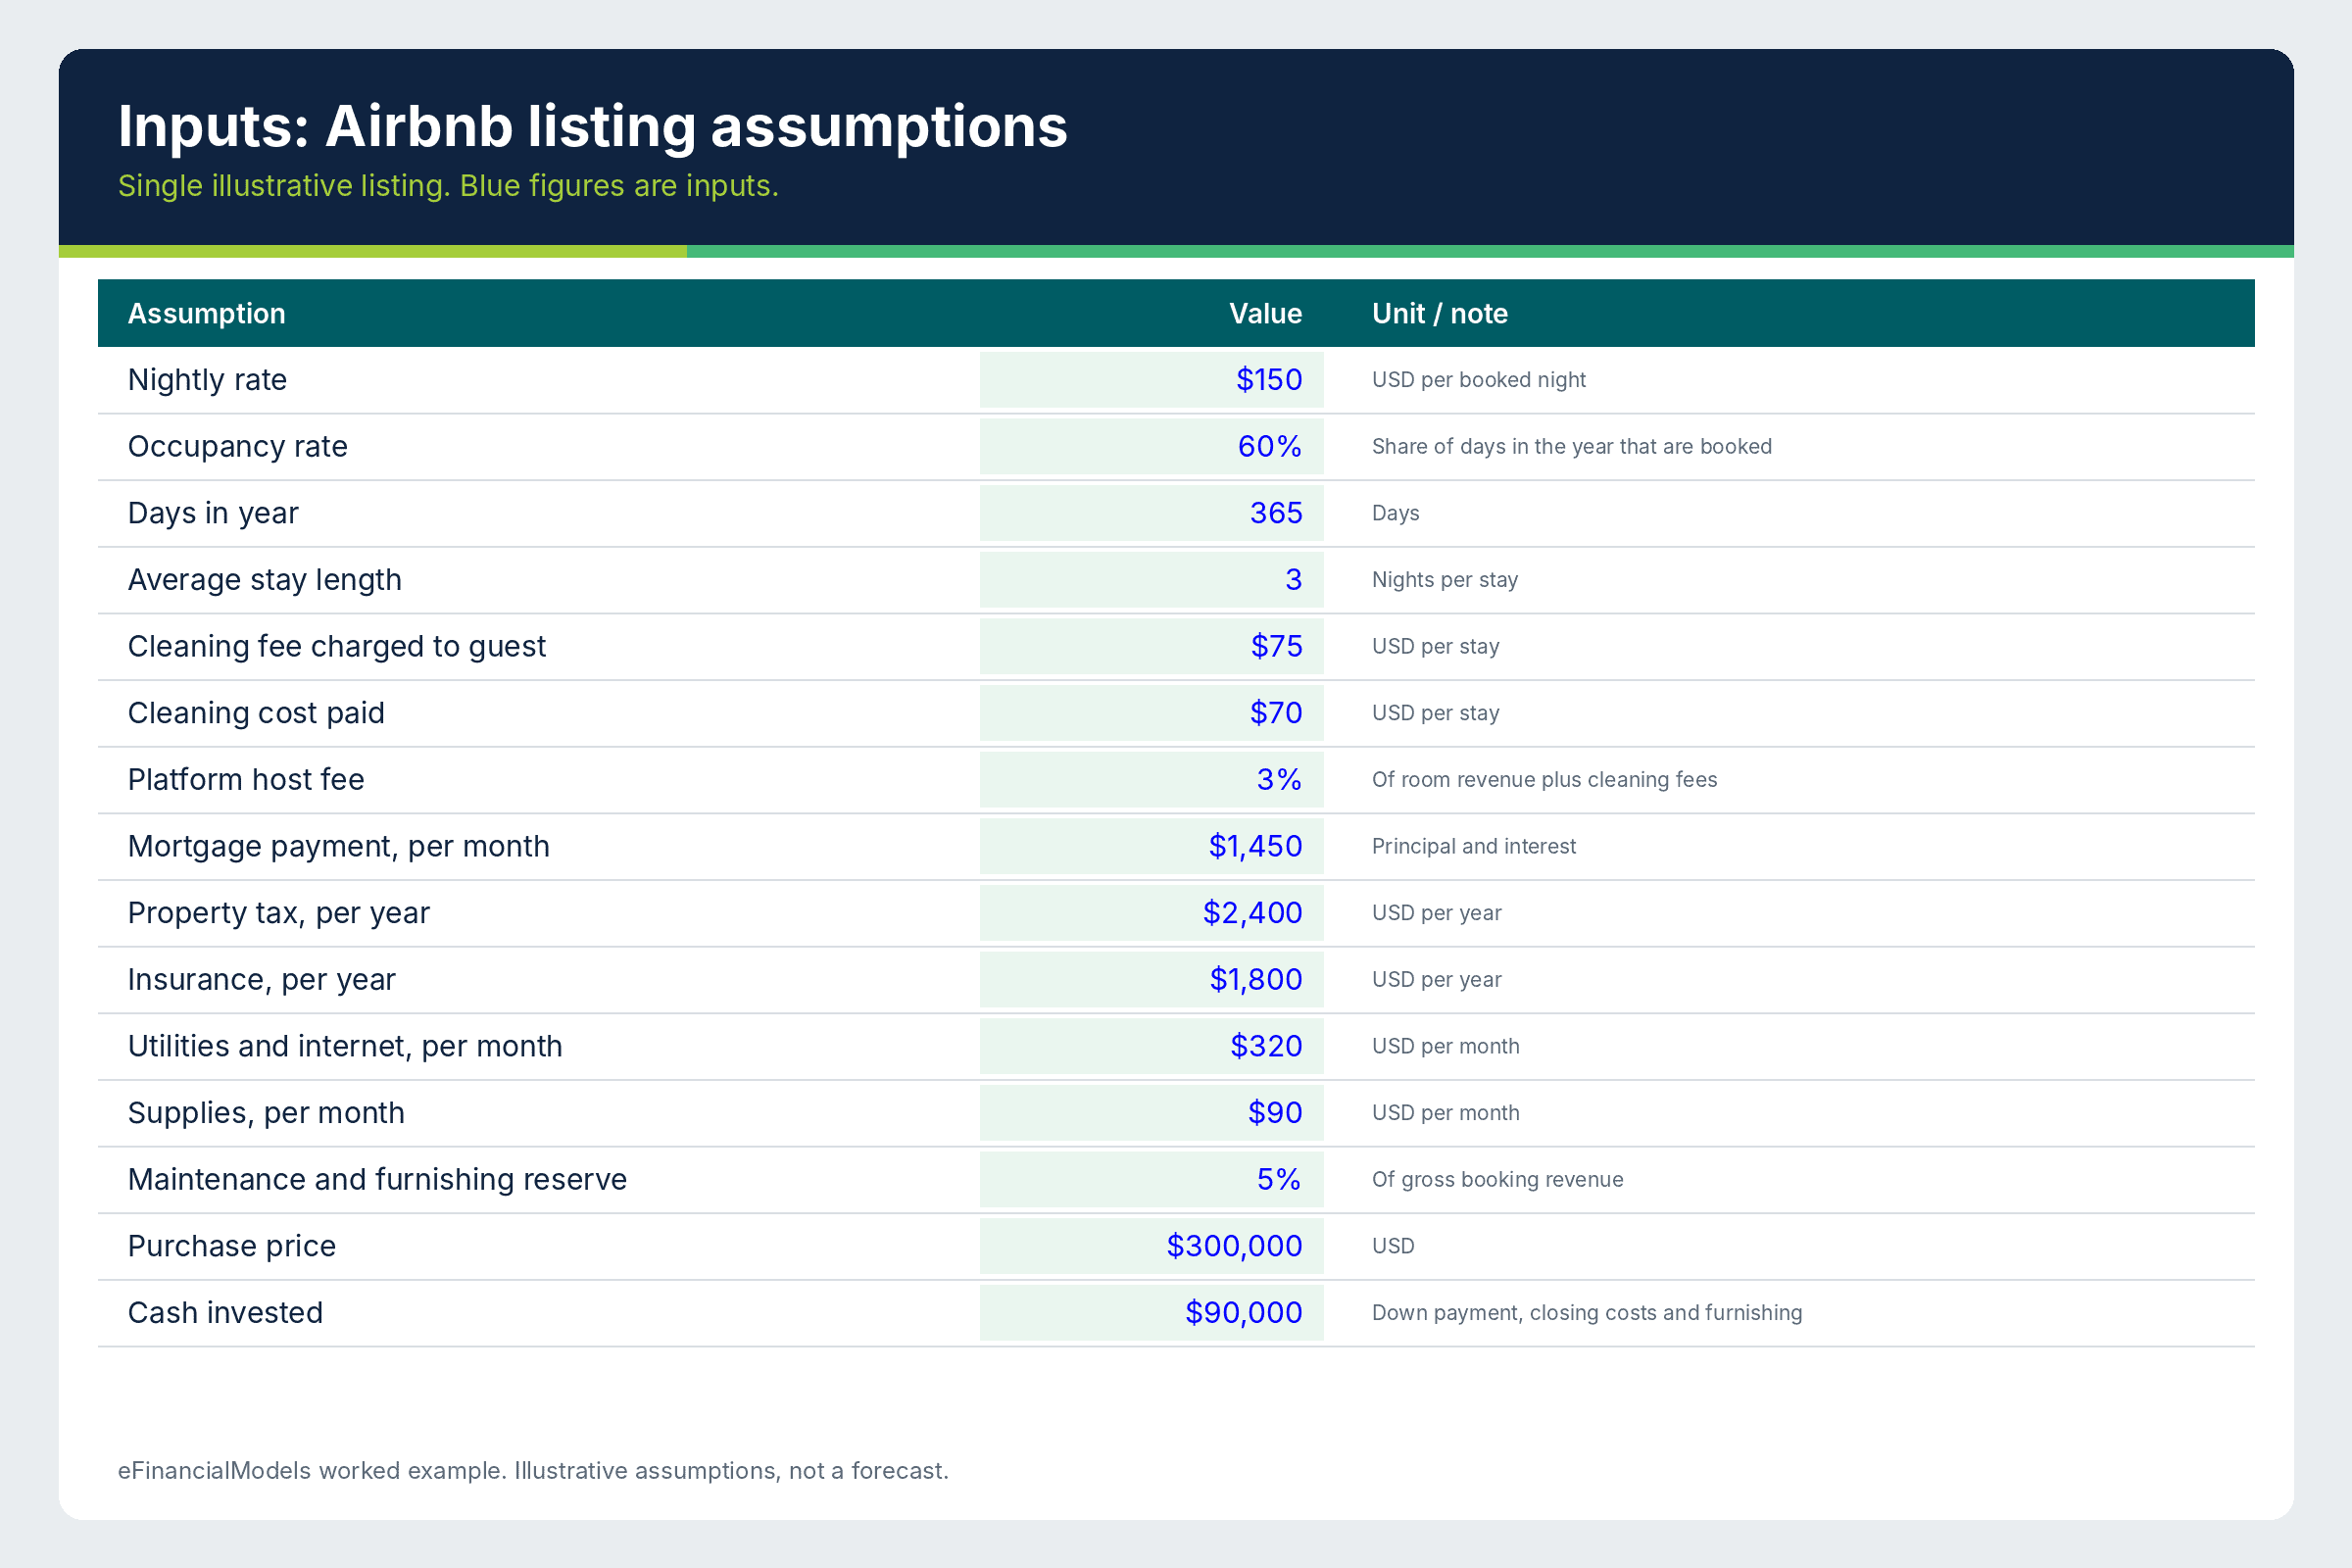
Inputs tab of the eFinancialModels worked example, built on illustrative assumptions.
The platform fee belongs in the inputs because Airbnb charges a service fee when a booking is confirmed. Airbnb’s help page says most hosts on the split-fee structure pay a 3% service fee, but some pay more.
The same page lists 15.5% for most hosts on the single-fee structure, where the entire fee is deducted from the host’s payout. The same page says Airbnb is transitioning all home hosts to a single service fee structure, and that the split-fee structure will be phased out.
The worked example uses the 3% split-fee rate as an illustrative assumption. At the 15.5% single-fee rate the platform fee would be roughly five times larger, enough to turn the example’s pre-tax cash flow negative, so a host should enter the rate shown in the account.
Which Revenue and Cost Lines Belong in the Calculation Tab?
The calculation tab converts inputs into dollars with one formula per line. Booked nights equal 365 times occupancy, stays equal booked nights divided by the average stay, and room revenue equals booked nights times the nightly rate. Cleaning fees collected equal stays times the guest cleaning fee. The template treats the cleaning fee a guest pays as revenue, while the amount paid to the cleaner belongs in costs.
Operating costs then follow: platform fee, cleaning cost, property tax, insurance, utilities, supplies and the reserve. The loan payment stays out of operating costs. The IRS (the US Internal Revenue Service) treats rental receipts as taxable income and allows deductions for rental expenses. Its residential rental guide adds that a landlord can deduct mortgage interest paid on the rental property but cannot simply deduct principal payments. Tax treatment varies by country and situation, so a host should confirm the rules with a qualified adviser.
Worked Example: What Does One Illustrative Listing Earn?
The inputs above produce the following annual figures. Booked nights are 365 x 60% = 219, stays are 219 / 3 = 73, room revenue is 219 x $150 = $32,850 and cleaning fees collected are 73 x $75 = $5,475. Gross booking revenue is therefore $38,325.
Operating costs total $17,296.00: platform fee $1,149.75 (3% of $38,325), cleaning cost $5,110 (73 x $70), property tax $2,400, insurance $1,800, utilities $3,840, supplies $1,080 and reserve $1,916.25 (5% of $38,325). Net operating income is $38,325 minus $17,296, or $21,029. Annual loan payments are 12 x $1,450 = $17,400, which leaves pre-tax cash flow of $3,629.
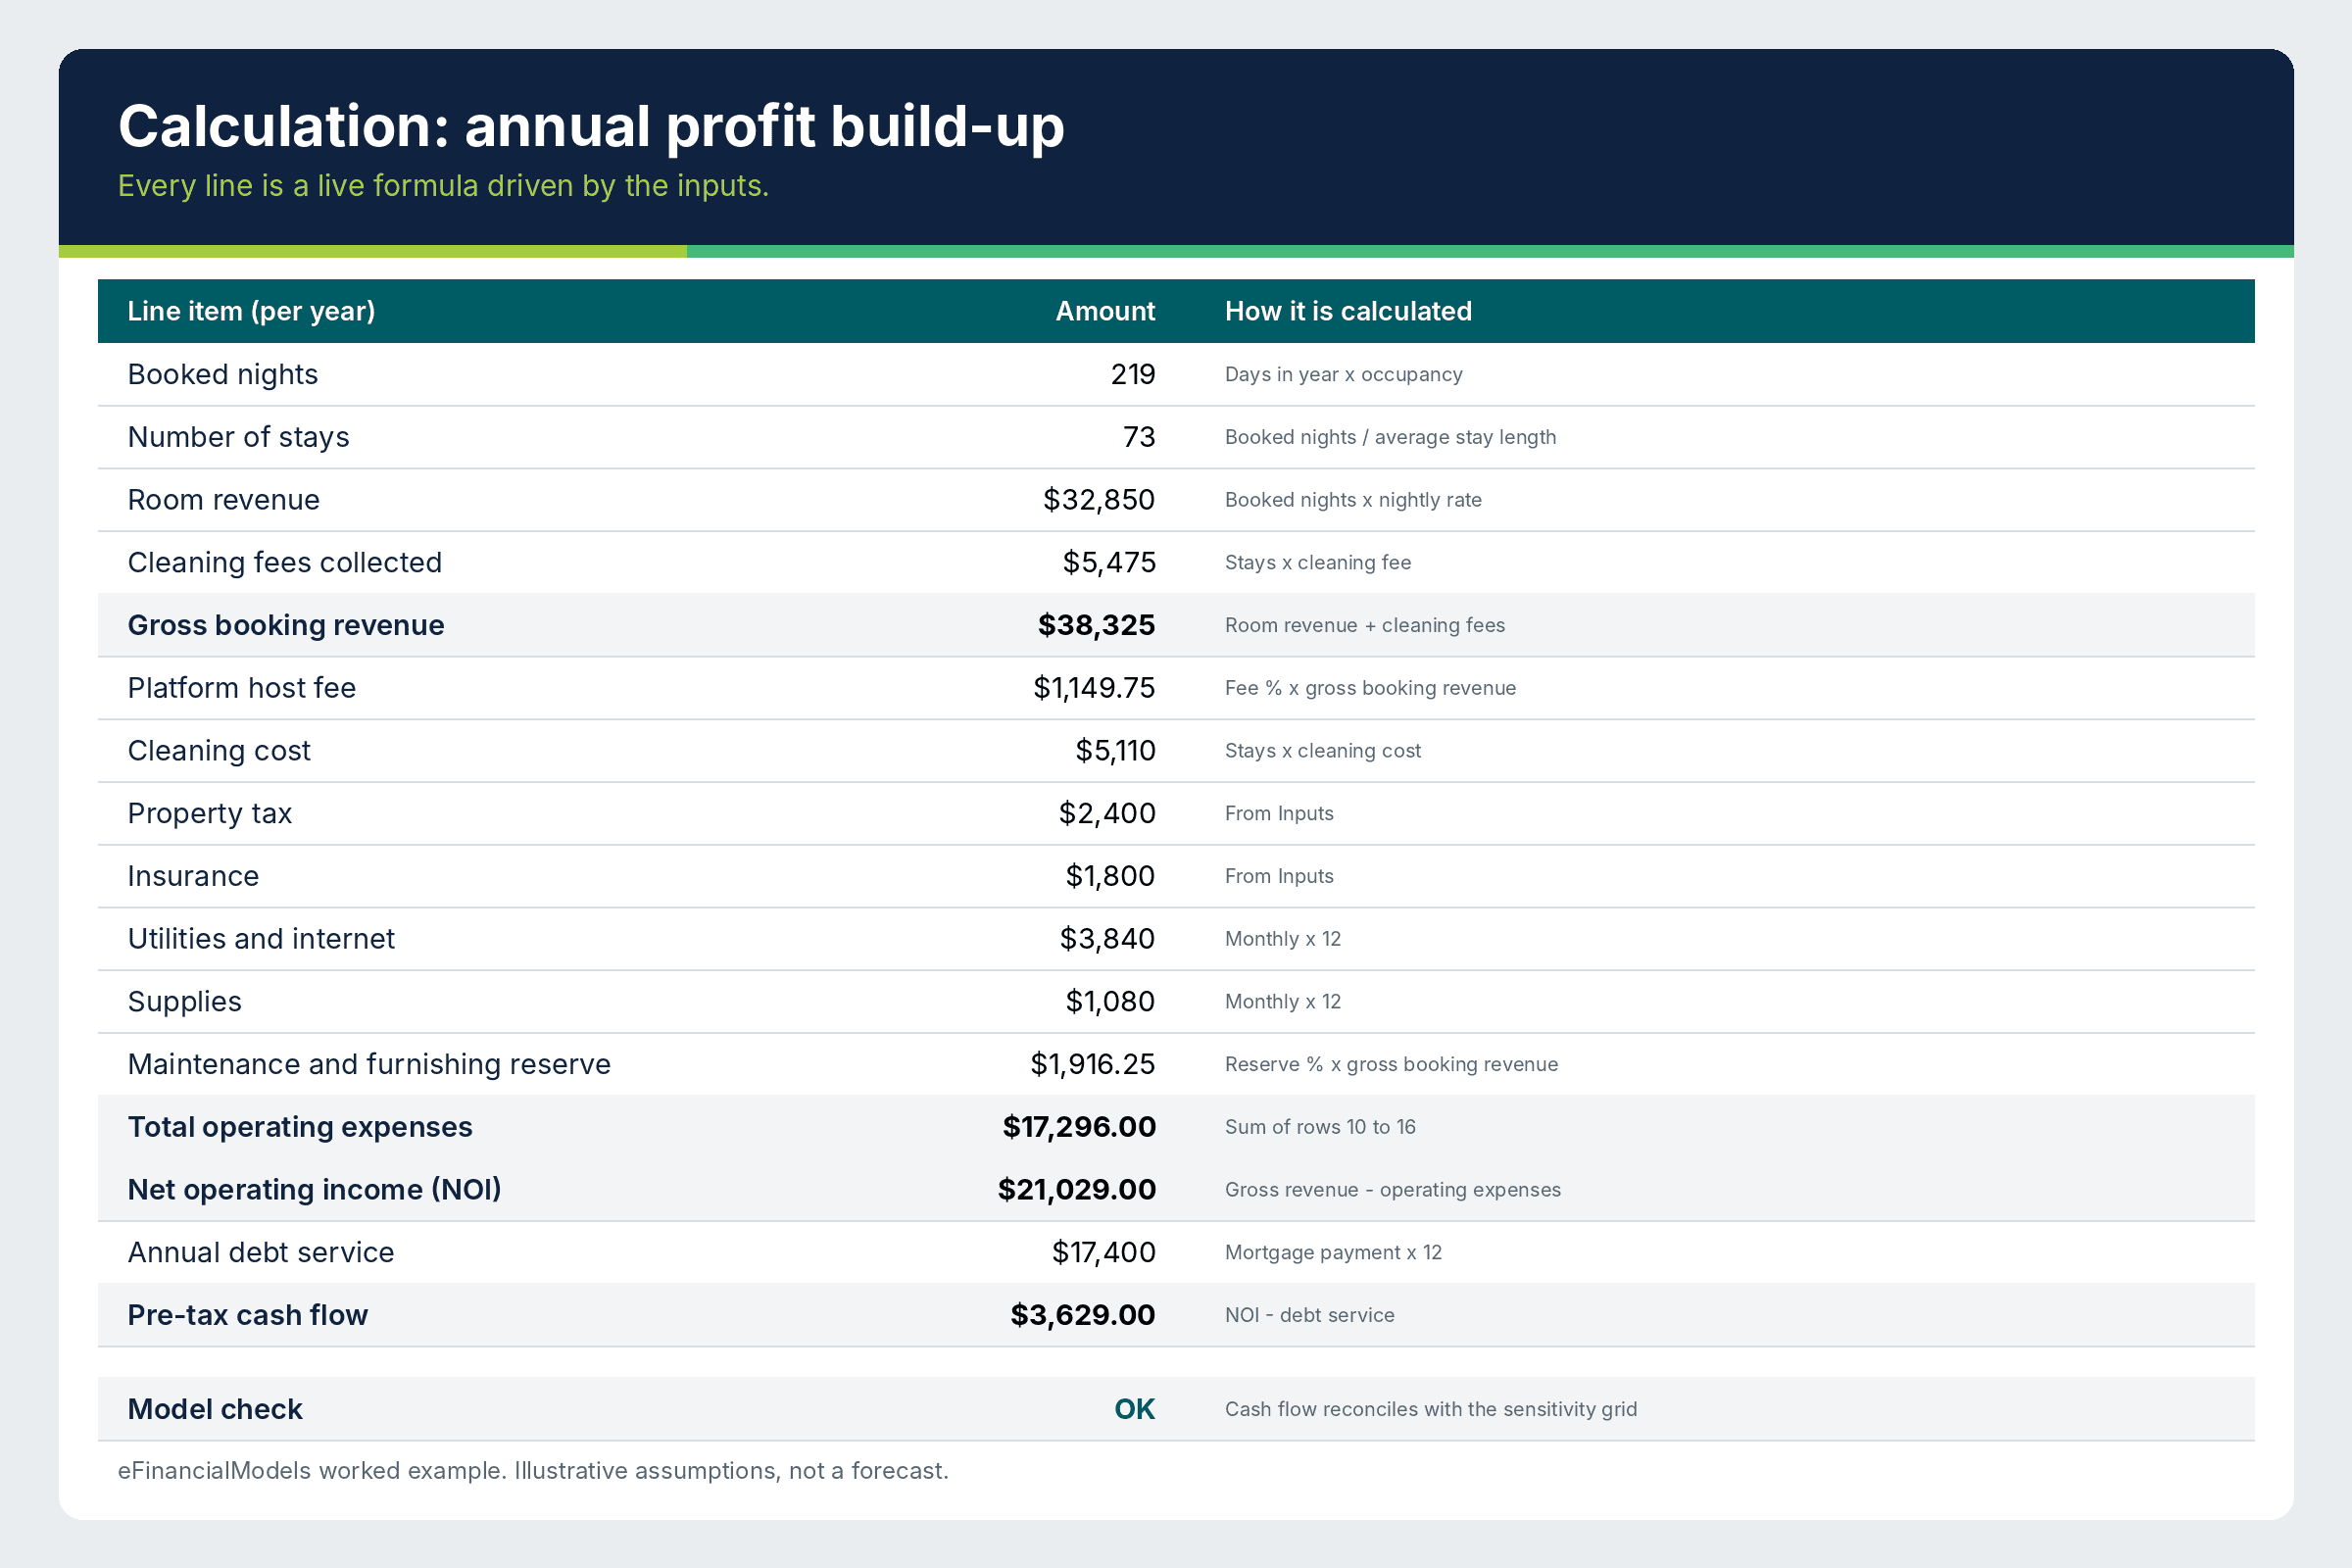
Calculation tab of the eFinancialModels worked example, with live formulas and illustrative assumptions.
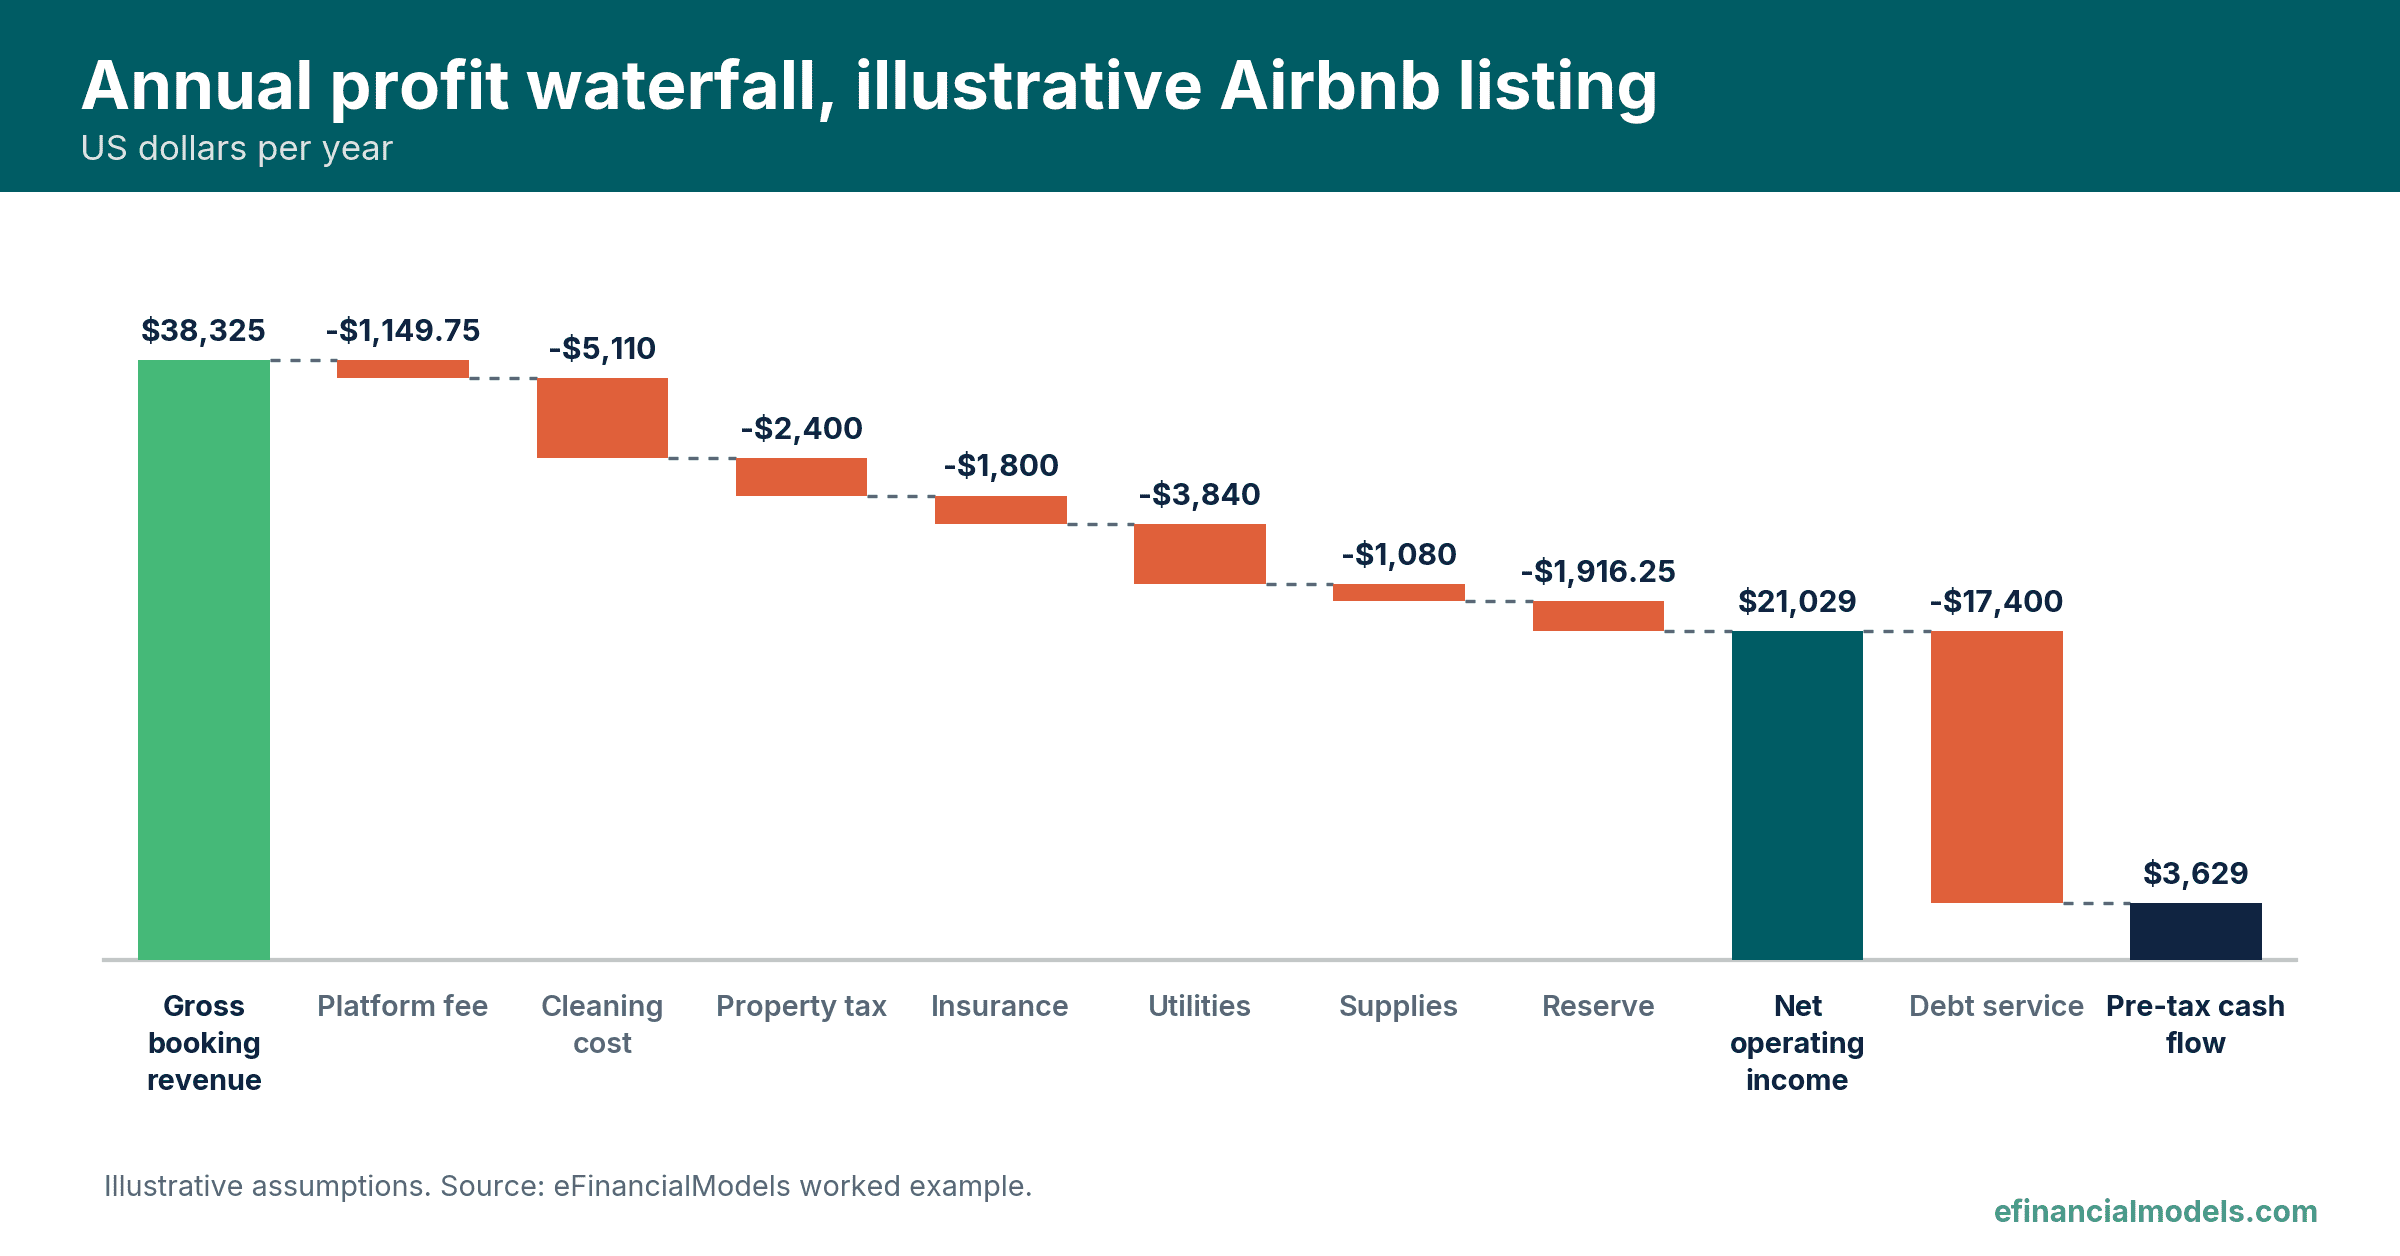
Waterfall of the illustrative listing, plotted from the same figures as the calculation tab.
Which Return Metrics Does the Worked Example Produce?
The results tab divides the profit figures by the right base. Cash-on-cash return is pre-tax cash flow divided by the cash the owner put in: $3,629 / $90,000 = 4.03%.
The cap rate is the ratio of a property’s annual income to its current market value, measured with NOI.
In the example the cap rate is $21,029 / $300,000 = 7.01%, with the purchase price standing in for market value.
The debt service coverage ratio (DSCR) is NOI divided by total debt service.
In the example the ratio is $21,029 / $17,400 = 1.21. A value below 1.00 means income does not cover the loan payment, so 1.21 means NOI can fall about 17% before coverage reaches 1.00. The three metrics disagree on purpose: the 7.01% cap rate ignores the loan, while the 4.03% cash return shows how much of the profit the loan absorbs.
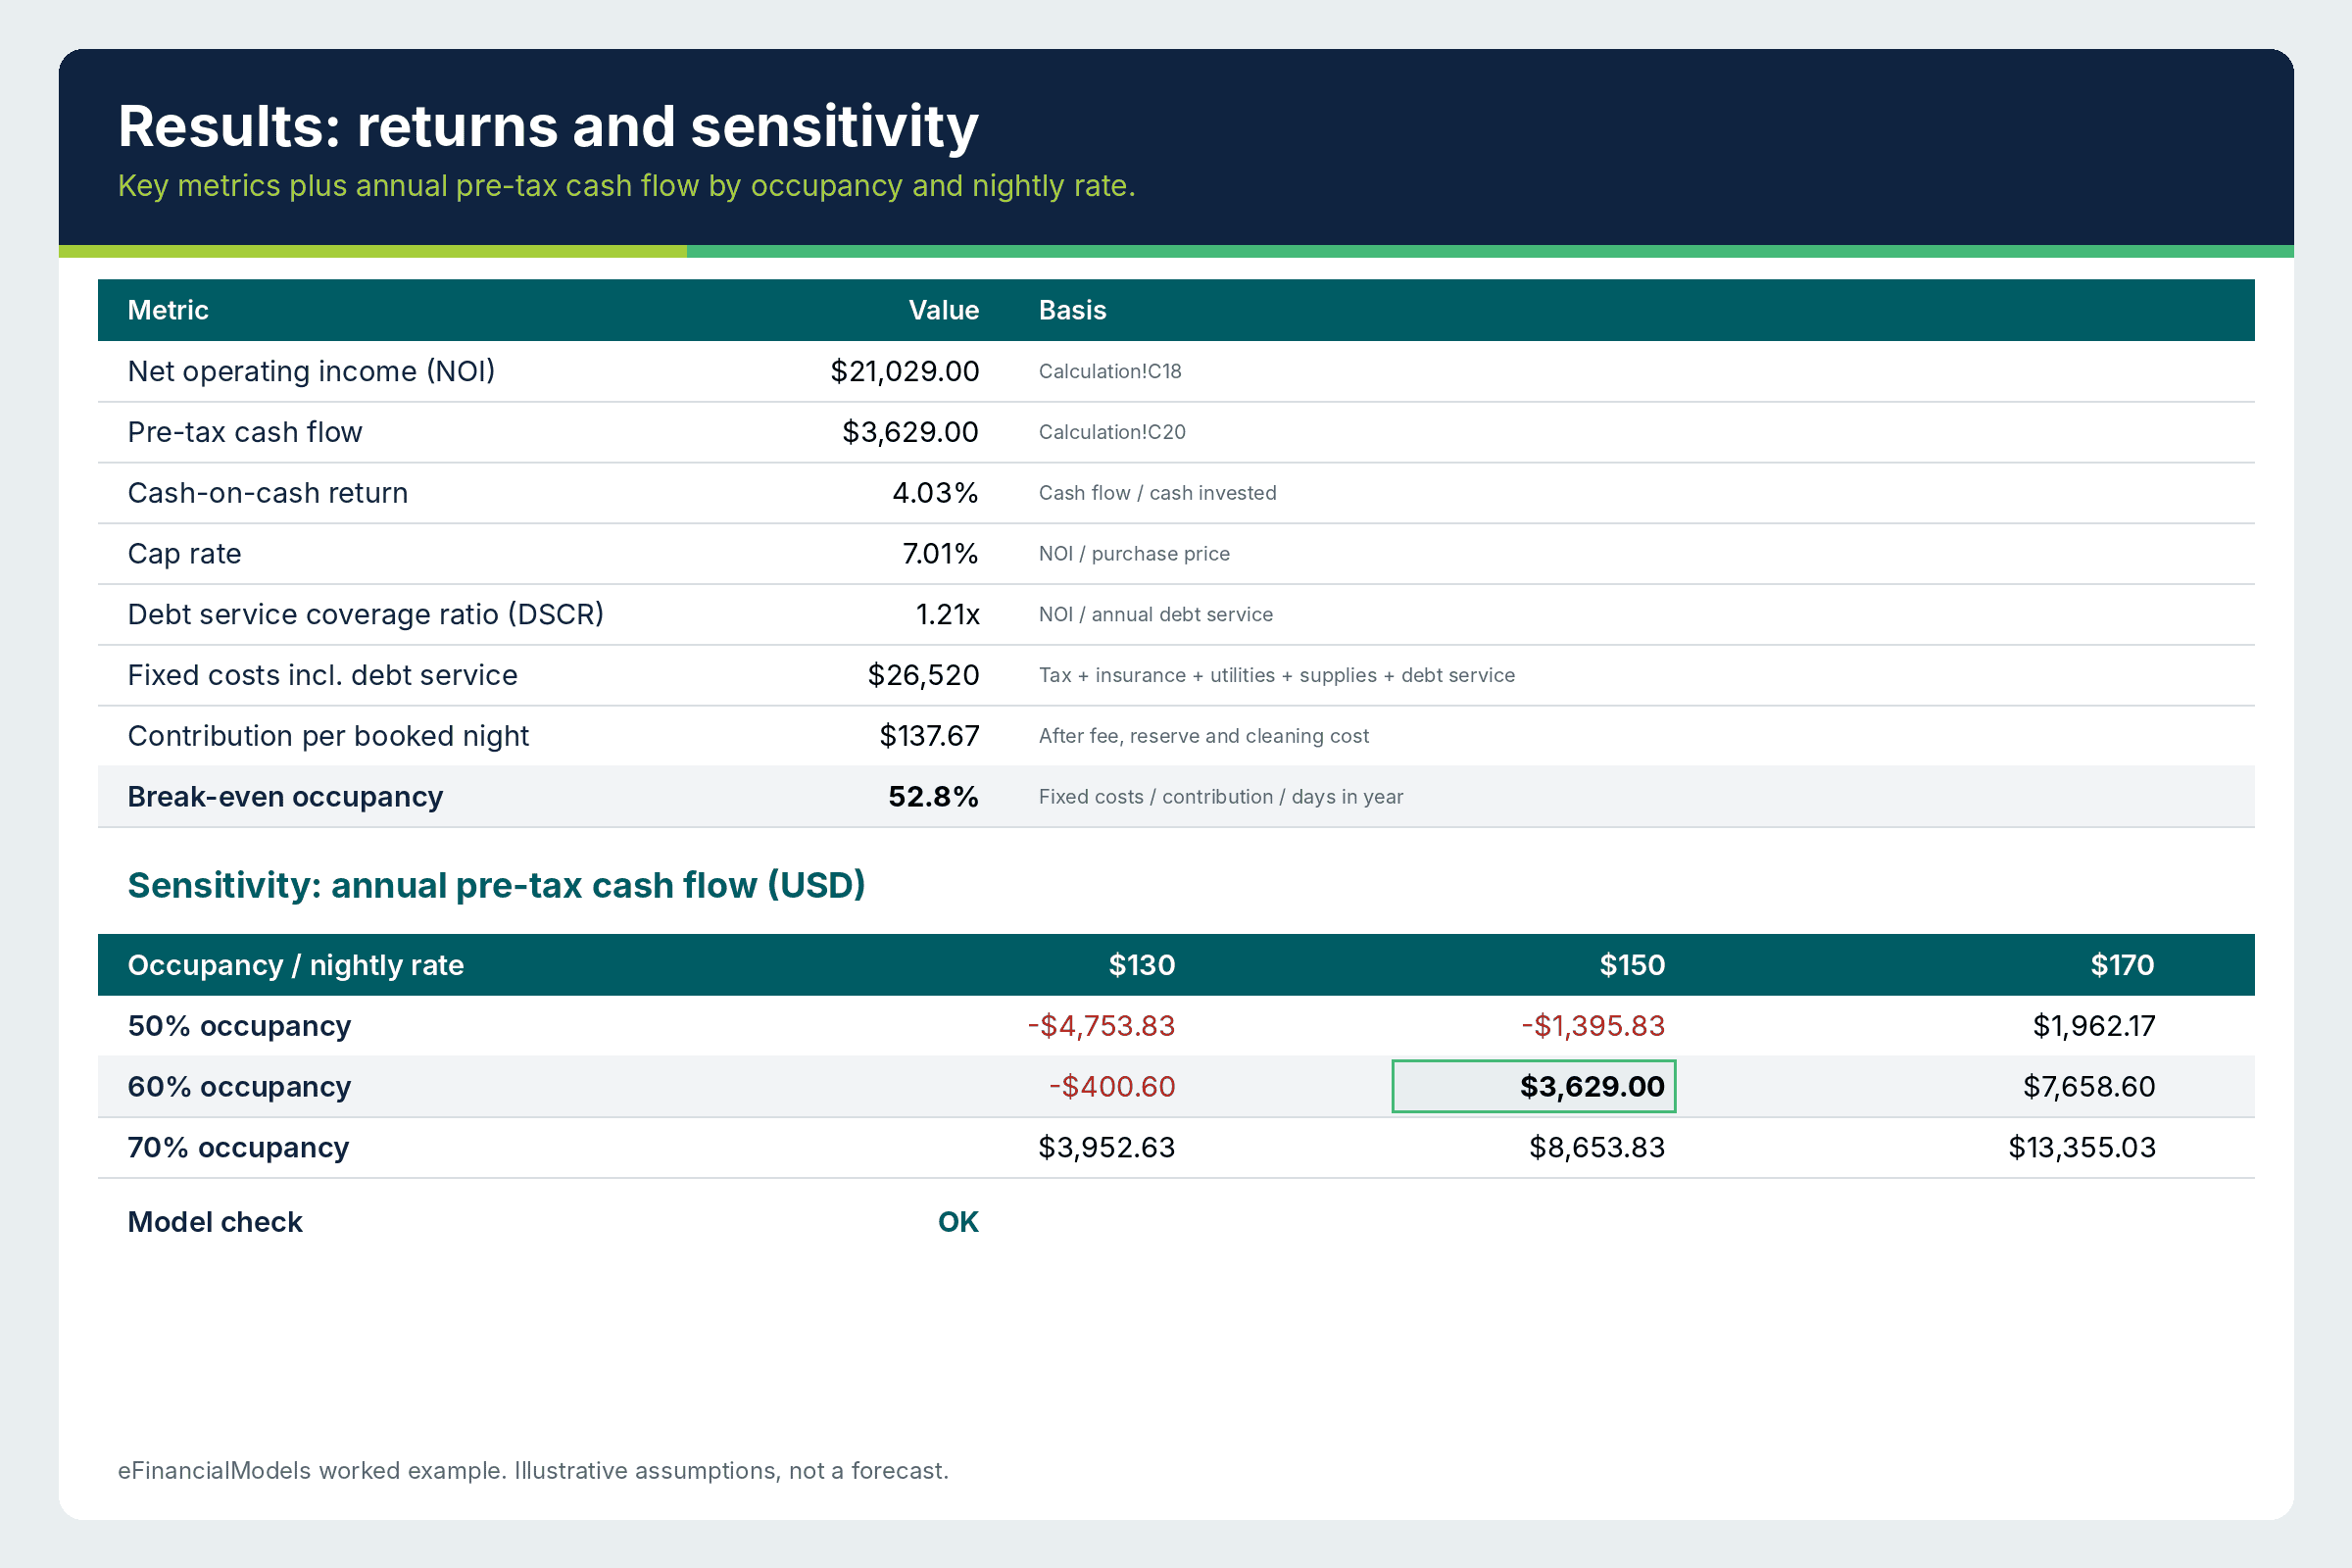
Results tab of the eFinancialModels worked example, with return metrics and the occupancy and rate grid.
How Does Occupancy Change the Worked Example Result?
A fixed set of costs makes cash flow sensitive to bookings. This break-even is a cash-flow break-even, so its fixed costs include loan payments even though NOI excludes them: property tax, insurance, utilities, supplies and loan payments sum to $26,520 a year. Contribution is the revenue of a booked night minus the costs that vary with each night. Each booked night is worth the following:
- Revenue: $150 + ($75 / 3) = $175.00
- Platform fee: 3% x $175.00 = $5.25
- Reserve: 5% x $175.00 = $8.75
- Cleaning cost: $70 / 3 = $23.33
- Contribution: $175.00 – $5.25 – $8.75 – $23.33 = $137.67
Break-even nights are $26,520 / $137.67 = 192.6, and 192.64 / 365 = 0.5278, or 52.8% occupancy. At the $150 rate, any occupancy below 52.8% therefore produces negative pre-tax cash flow, and any occupancy above it produces positive pre-tax cash flow.
| Occupancy | $130 rate | $150 rate | $170 rate |
|---|---|---|---|
| 50% | -$4,753.83 | -$1,395.83 | $1,962.17 |
| 60% | -$400.60 | $3,629.00 | $7,658.60 |
| 70% | $3,952.63 | $8,653.83 | $13,355.03 |
Because 50% sits below the 52.8% break-even, the 50% row is negative at the $150 rate, while the 60% row sits above it and is positive.
How Should a Host Update the Template Each Month?
A monthly log keeps the plan honest. A simple version adds one row per month with booked nights, room revenue, cleaning fees, platform fees, cleaning cost, utilities and the payout received, plus a column for the difference from plan. Airbnb states that it typically releases a payout about 24 hours after the guest checks in, so payout dates can be matched to stays and any gap investigated within days.
Conclusion
A free Airbnb template is a three-tab discipline: write assumptions once, calculate revenue and costs in a fixed order, and read the results through several metrics instead of one. The illustrative listing earns $3,629 after loan payments and needs 52.8% occupancy to break even.
Hosts who want monthly seasonality, debt financing and cash-on-cash yield already built in can start from the eFinancialModels Single Airbnb Rental Unit Financial Model, which projects a monthly forecast from occupancy rate, average daily rental fee and debt financing inputs.
Frequently Asked Questions
Can a spreadsheet replace the earnings reports inside the Airbnb account?
A spreadsheet complements the platform reports rather than replacing them. The account shows what was paid out, but only a personal model shows what remains after the mortgage, utilities and repairs that never pass through the platform. A good habit is to copy payout totals into the monthly log and let formulas subtract the costs that the platform cannot see, which turns a payout statement into a true profit figure for each month.
Should the template include income tax?
Most hosts keep the template pre-tax and handle tax separately, because tax depends on personal income, local rules and depreciation choices that differ from one owner to the next. A single extra row labelled estimated tax, filled with a figure from an accountant, can sit below cash flow without changing any earlier formula. That way the operating picture stays clean and the after-tax view is still one cell away.
What occupancy should a new listing assume?
A new listing has no history, so the safest approach is to build three cases: a cautious one, a base one and an optimistic one. Local comparable listings, seasonal demand and the calendar of nearby events inform the base case. The cautious case should assume realistically low demand, and the test is whether it still covers the loan payment. If only the optimistic case works, the purchase depends on luck rather than on the numbers.
Does the same layout work in Google Sheets or Excel?
Yes. Every formula in the layout uses basic arithmetic, so it behaves the same in Excel, Google Sheets or LibreOffice. The only difference is cell styling. Keeping inputs in blue text, formulas in black and one check cell that turns green when the grid’s centre value equals the calculation tab’s cash flow makes the file easy to audit, whichever program a host prefers, and it makes accidental overwrites easy to spot.