Regression Analysis
An Forecasting method in Microsoft Excel.

It is considered one of the methods of forecasting sales and it depends on the causal relationship between the expected activity factor, which is the independent factor, and the dependent factor, which is sales revenue.
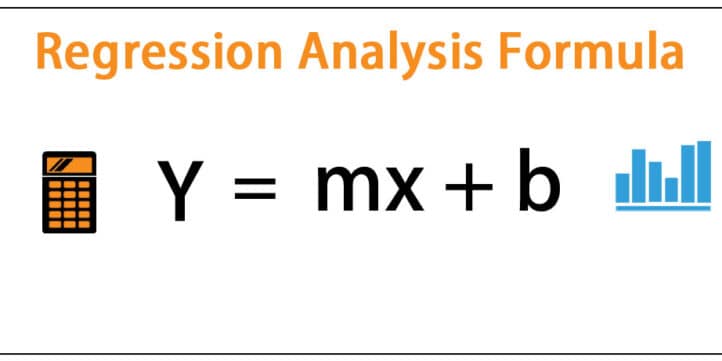
From this case study, you will learn how financial analyst use regression analyses for forecasting the sales volume regression is a statistical method used to determine the strength of the relationship between one dependent variable(usually Y) and a series of other changing variables(independent variable)
Y=a+bx+n
Y=cars sales
X=per capital income
a=the intercept
b=the slope
n=the reg.residual
ٍSubject of the following matters:
1- Analyze sales historical data by products, regions, and customers
2- Determining the entity’s market share and what is expected to undergo changes during the budget period, with a focus on the intensity of competition during the budget period.
3- Analyzing the pricing policies expected to be used and their impact on sales
4- Market studies and research.
5- Study the economic conditions and the conditions of the economic sector to which the company belongs and study the income of individuals.
6- Examining new products that are expected to enter the market during the budget period.
7- Determine the advertising policies
Thank you.
Rami Abbas.
This model template comes as a FREE version in .xlsx file type which can be opened using MS Excel.
Similar Products
Other customers were also interested in...
Private Equity Fund Model (Investor Cashflows)
Private Equity Financial Model to analyze fund cashflows and returns available to Limited Partners (... Read more
All My Financial Models, Spreadsheets, Templates, ...
Lifetime access to all future templates as well! Here is a set of spreadsheets that have some of the... Read more
Due Diligence P&L – Exhaustive Revenue a...
Model for in depth understanding of high level profit and loss and revenue analysis. Big-4 like chec... Read more
Due Diligence Tools and Methods
A suite of best practices to perform financial and commercial due diligence. Use it if you are consi... Read more
Advanced Financial Model with DCF & Valuation
General Overview Advanced Financial Model suitable for any type of business/industry and fully cu... Read more
Startup Company Financial Model – 5 Year Fin...
Highly-sophisticated and user-friendly financial model for Startup Companies providing a 5-Year adva... Read more
Joint Venture and Fund Cash Flow Waterfall Templat...
Here are all the spreadsheets I've built that involve cash flow distributions between GP/LP. Include... Read more
Feasibility Study Template – 10 years Model
Advance Feasibility studies template for 10 years ( Financial model for any projects & Feasibili... Read more
Complete Three-Statement Monthly Budget with Scena...
This is a comprehensive set of templates that will help you build your budget. The templates are bui... Read more
Financial Analysis Template
Financial analysis is used to evaluate economic trends, set financial policy, build long-term plans ... Read more
You must log in to submit a review.


