
0 ITEMS

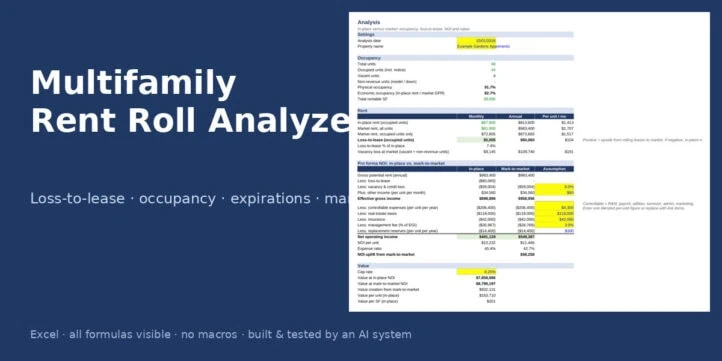
Multifamily Rent Roll Analyzer with Loss-to-Lease, Expirations and Mark-to-Market NOI
Paste a unit-level rent roll and get loss-to-lease, physical and economic occupancy, lease expiration exposure by bucket, unit-mix economics, and in-place versus mark-to-market NOI and value.
The rent roll is where most multifamily underwriting goes wrong: units leased above market that will roll down, half the leases expiring in one quarter, model units counted as income, a market rent assumption that was never tested against what is actually being paid. This Excel template takes a unit-level rent roll and turns it into the four things a buyer, lender or asset manager needs: loss-to-lease, occupancy, rollover exposure and a pro forma NOI at both in-place and market rents.
What the template is for
Acquisition underwriting of 10 to 150 unit properties, refinance packages, quarterly asset-management reviews, and checking a seller’s offering memorandum against the actual roll.
What it includes
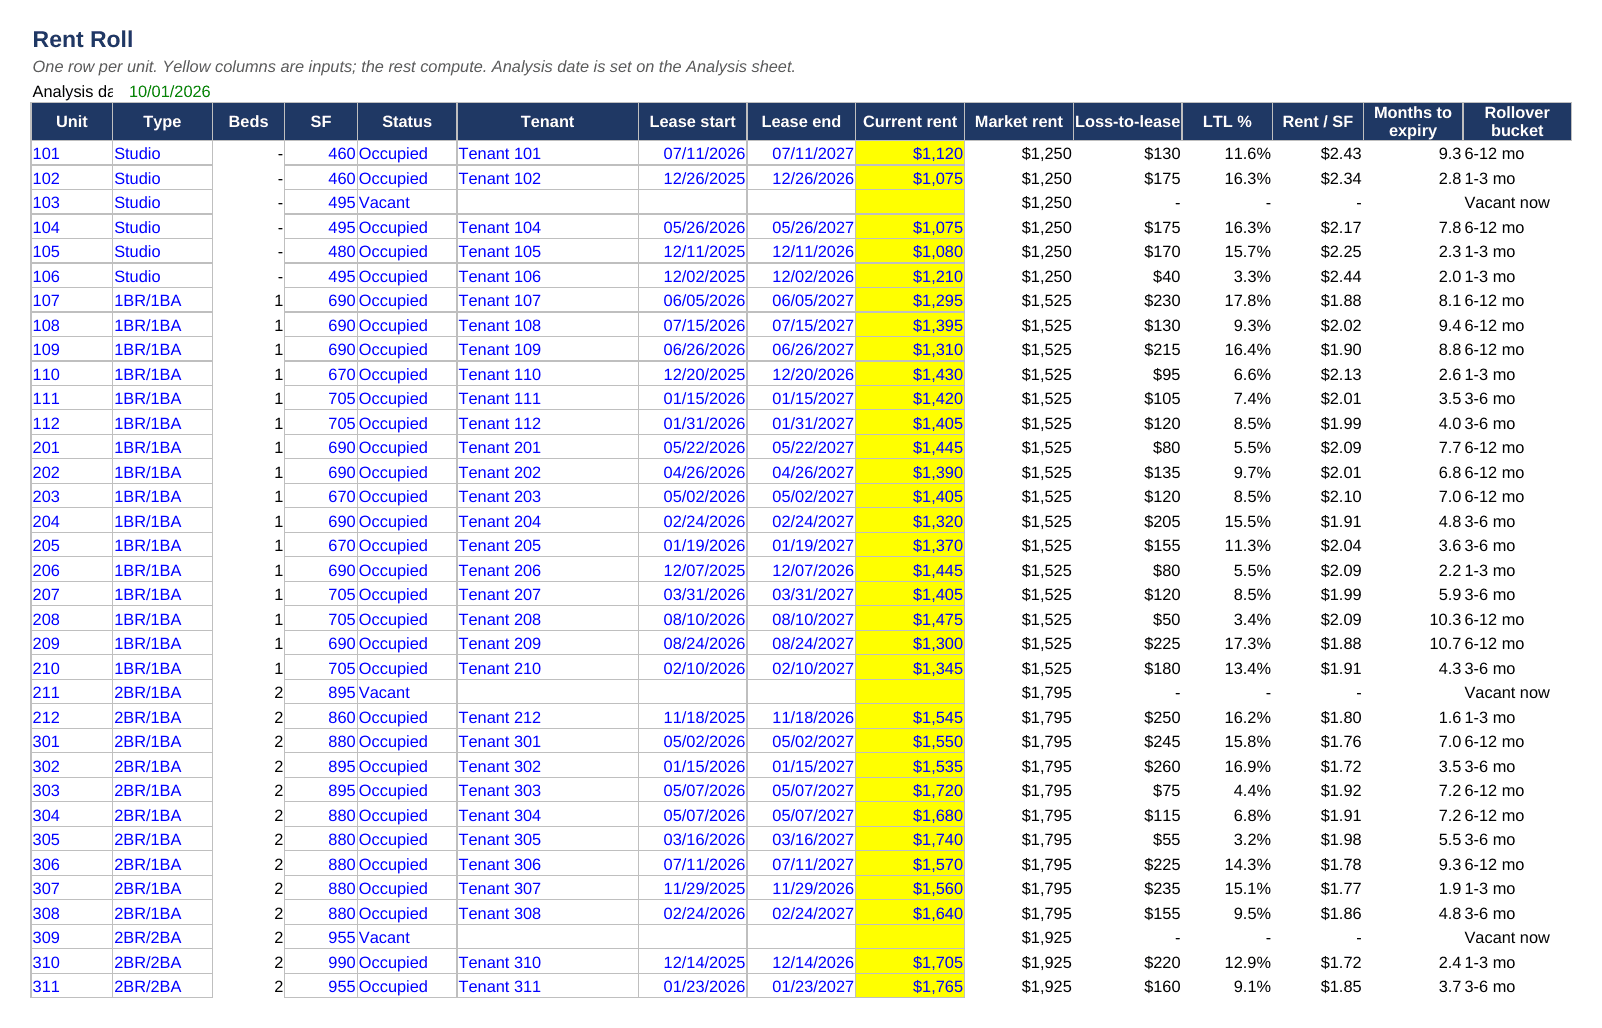
Rent Roll: 150 rows with unit number, unit type, square feet, status, tenant, lease start, lease end and current rent as inputs. For every row the sheet looks up the market rent for that unit type, computes loss-to-lease in dollars and percent, rent per square foot, months to expiry from the analysis date, and assigns a rollover bucket. Five statuses are handled differently: Occupied, Vacant, Notice (counted as occupied today but flagged for rollover within 30 days), Model and Down (non-revenue).
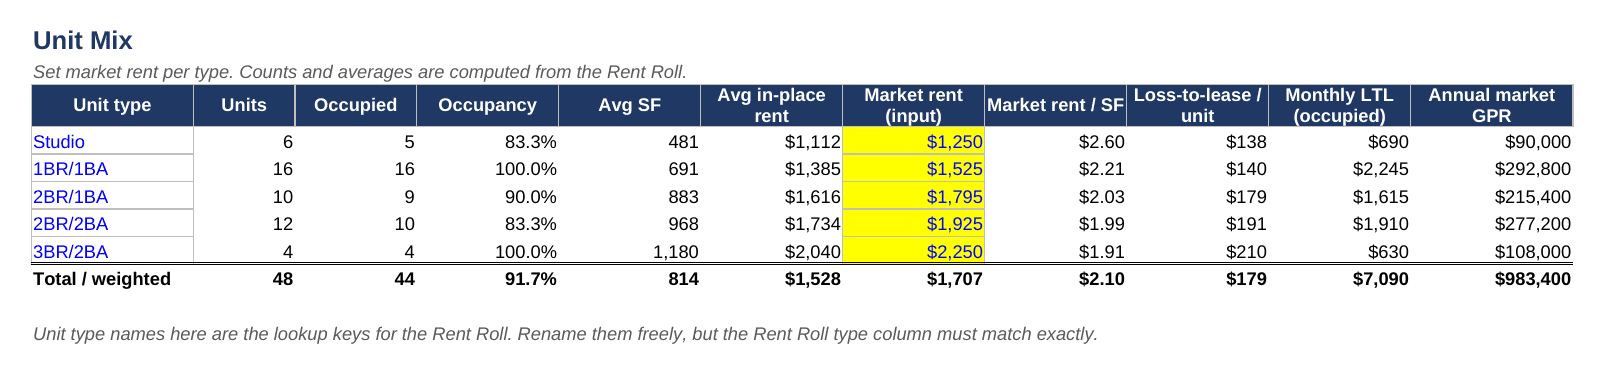
Unit Mix: for each unit type, the count, occupied count, occupancy, average square feet, average in-place rent, your market rent input, market rent per square foot, loss-to-lease per unit and in total, and annual market gross potential rent. The totals row gives the weighted figures for the whole property.
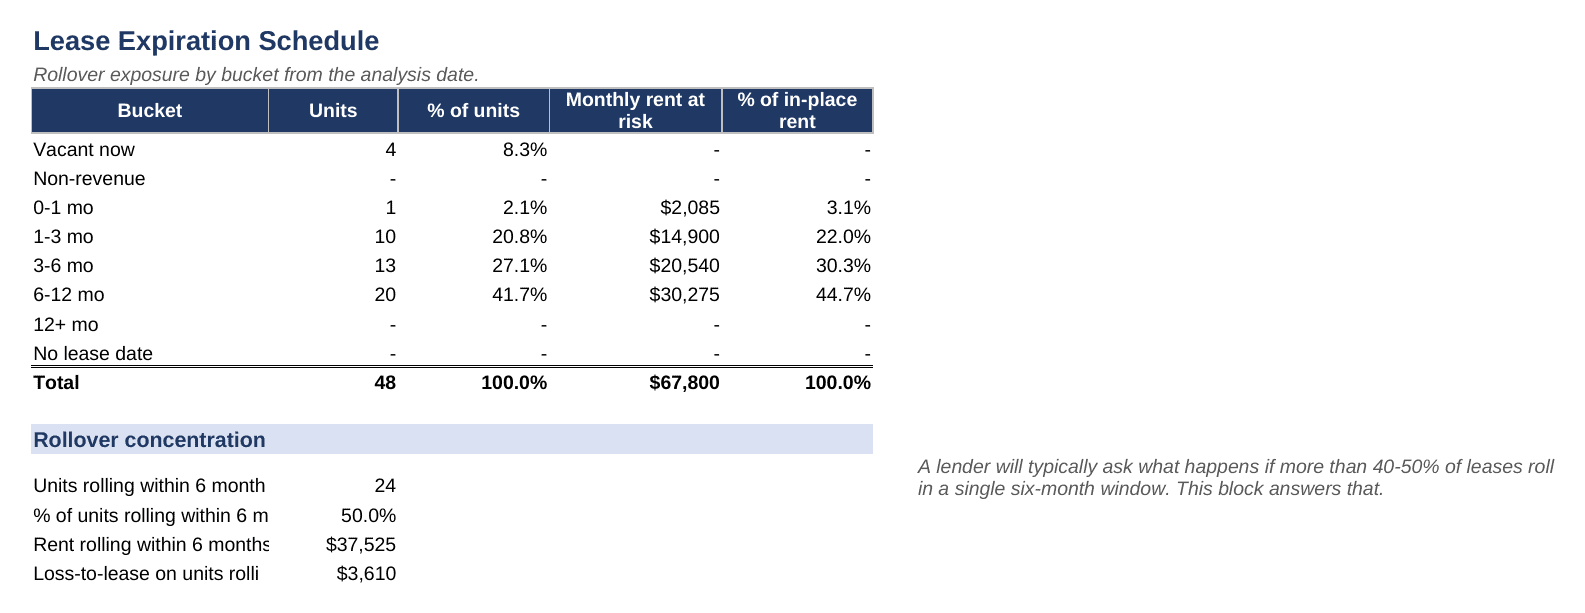
Expirations: units and monthly rent at risk by bucket (vacant now, non-revenue, 0 to 1 month, 1 to 3, 3 to 6, 6 to 12, over 12, and no lease date), plus the six-month rollover concentration and the loss-to-lease sitting in those near-term leases, which is the question a lender will ask first.
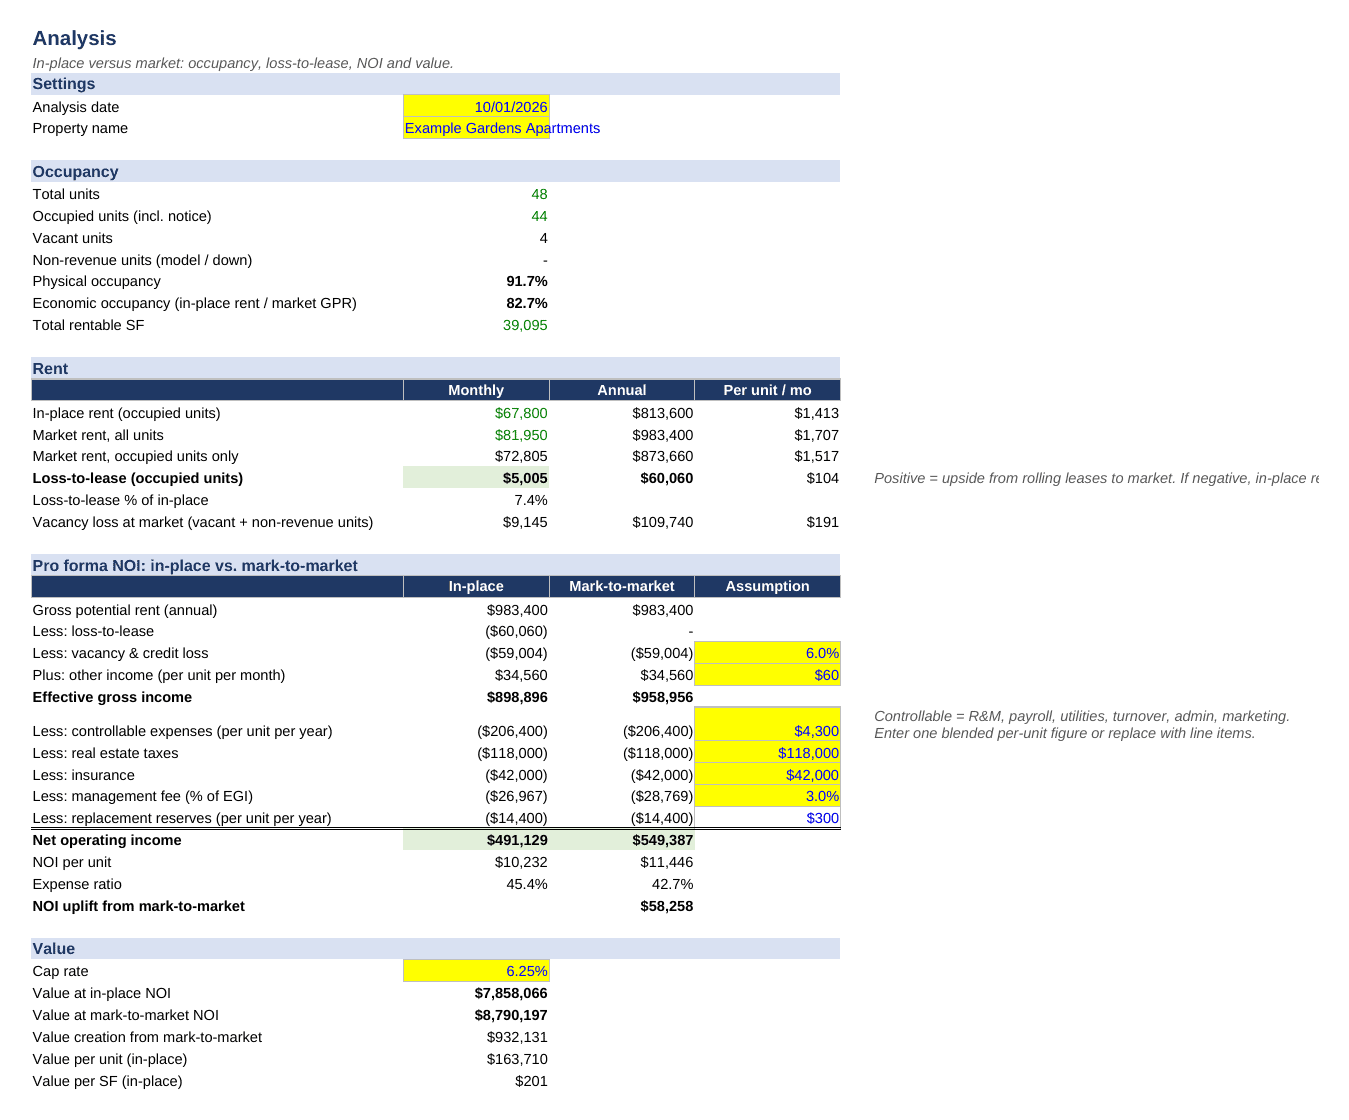
Analysis: physical occupancy, economic occupancy, in-place rent against market rent for occupied units and for all units, vacancy loss at market, and a pro forma NOI shown in two columns, in-place and mark-to-market, driven by your inputs for other income, vacancy, controllable expenses per unit, taxes, insurance, management fee and reserves. Value at your cap rate is shown under both cases together with the value created by rolling leases to market, value per unit and value per square foot.
How to use it
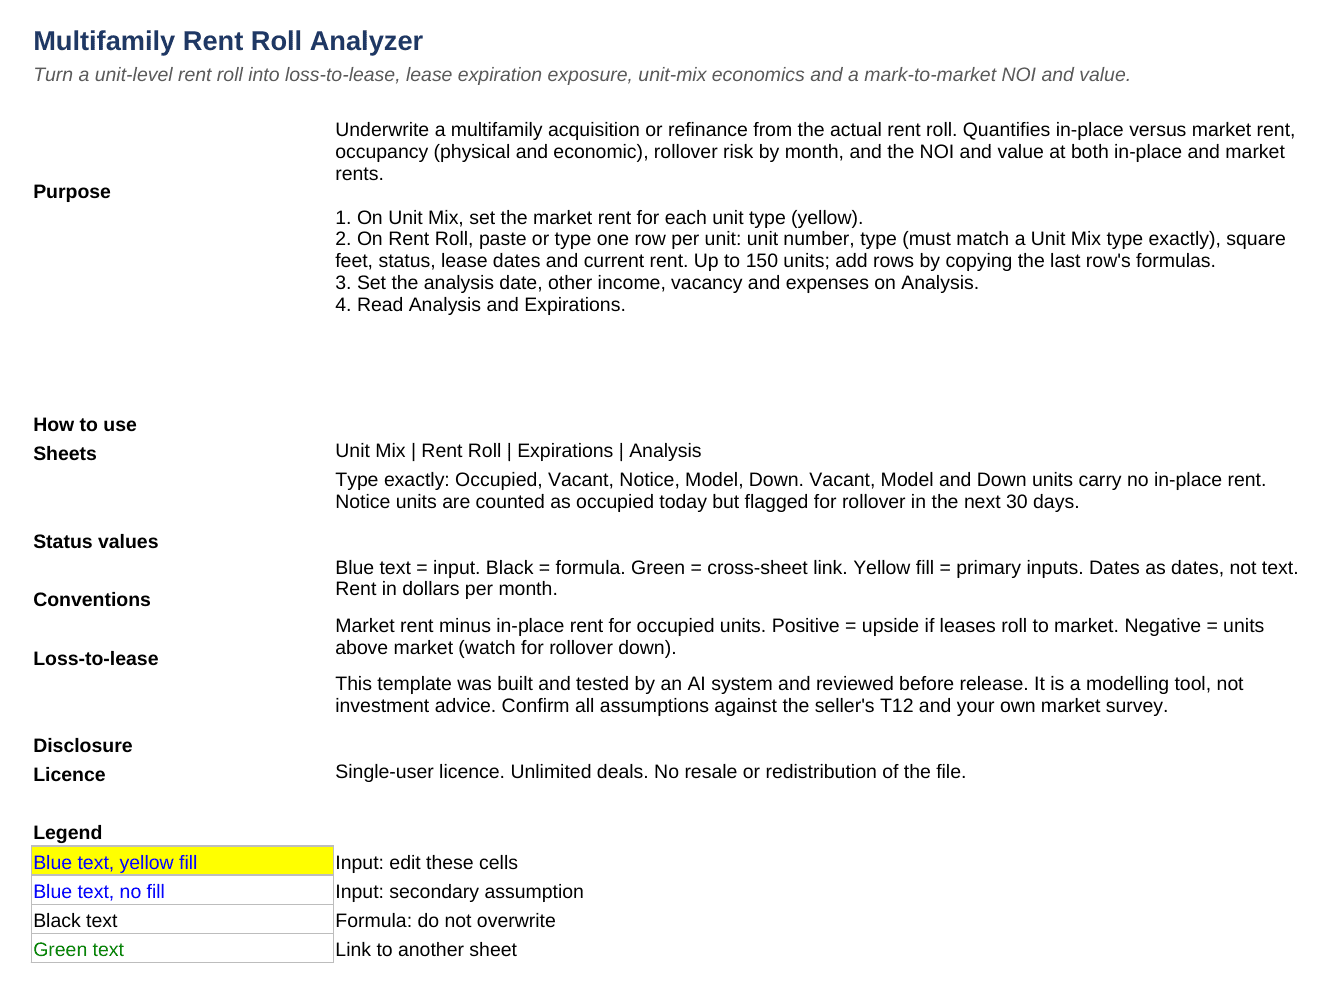
Set the market rents on Unit Mix, paste your roll into the yellow columns, set the analysis date and expense assumptions on Analysis, and read the results. Add rows by copying the formulas down. Blue text marks inputs, black text formulas, green text links. No macros, no locked cells, no external links; runs in Excel 2016 or later and LibreOffice.
This template was built and tested by an AI system under a standing specification from a finance professional, recalculated with an independent engine and reviewed before release. All cells are unlocked and every formula is visible. Example data is included. It is a modelling tool, not financial, investment, lending or legal advice.
Similar ProductsOther customers were also interested in...



 eFinancialModels
Electric Vehicle (EV) Charging Station Financial M...
With this comprehensive 5- or 10-year monthly tool, investors can assess the viability of setting up... Read more

Financial Model for Mobile App | Mobile App Busine...
The Mobile App Financial Plan Template in Excel allows you to develop financial projections when lau... Read more

 HenrySheykin
Food Truck Financial Model Excel Template
The Food Truck Financial Model helps entrepreneurs, founders, business owners, consultants, and anal... Read more

Green Hydrogen Production from Wind Energy Financi...
The Green Hydrogen from Wind Financial Model aims to comprehensively forecast a horizon of 40 years ... Read more

Simple Mutual Non-Disclosure Agreement Template
Protect your business secrets with ease using our Simple Mutual Non-Disclosure Agreement Template. S... Read more

Solar Energy Financial Model
The Solar Energy Financial Model Spreadsheet Template in Excel assists you in preparing a sophistica... Read more

 Peter Graf
The Customer-Centric Financial Model for Restauran...
Starting a restaurant without a financial plan is like driving a car blindfolded. You wouldn´t do i... Read more
You must log in to submit a review.