
0 ITEMS

EU Battery Passport, Recycled Content & Compliance Economics Model | 10-Year Forecast, Carbon, EPR, Closed-Loop, Supplier Switching & Program Margins
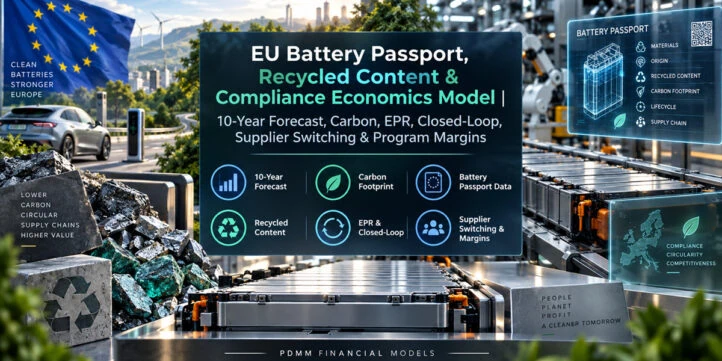
EU Battery Passport, Recycled Content & Compliance Economics Model 🔋 Turn EU battery-compliance requirements into a quantified 10-year operating and financial plan. This Excel model links battery chemistry, supplier risk, virgin and recycled material economics, carbon footprint, digital battery-passport costs, due-diligence headcount, EPR fees, end-of-life recovery, closed-loop recycling, supplier switching, cell and pack costs, and downstream EV and stationary-storage margins in one connected decision engine covering 2026-2035.
EU Battery Passport, Recycled Content & Compliance Economics Model
🔋 Turn EU battery-compliance requirements into a quantified 10-year operating and financial plan. This Excel model links battery chemistry, supplier risk, virgin and recycled material economics, carbon footprint, digital battery-passport costs, due-diligence headcount, EPR fees, end-of-life recovery, closed-loop recycling, supplier switching, cell and pack costs, and downstream EV and stationary-storage margins in one connected decision engine covering 2026-2035.
The workbook is built for teams that need to answer a difficult commercial question: what will compliance actually cost per kWh, how will that cost change under different operating choices, and what does it do to program profitability? Instead of treating regulation as a checklist, the model converts editable operating assumptions into annual cost, margin, risk, NPV, scenario, and dashboard outputs.
Seller-supplied and already tested; no Studio workbook audit was performed.
🎯 Buyer Problem & Decisions Supported
Battery manufacturers, EV programs, storage developers, procurement teams, finance teams, ESG functions, and advisers often hold compliance data in separate files: BOM data in one place, supplier information elsewhere, carbon assumptions in another file, and cost forecasts in a finance model. This workbook brings those decision streams together so users can test how chemistry, supplier mix, recycled-content attainment, carbon thresholds, EPR economics, recovery value, and closed-loop strategy interact.
Use the model to decide whether current assumptions are commercially sustainable, whether a higher-compliance pathway is affordable, where compliance cost is concentrated, whether a closed-loop program can improve economics, whether switching suppliers creates value after disruption risk, and how compliance pass-through changes EV or storage gross margin.
🧭 Model Workflow
1. Choose the active scenario, model horizon, start year, plant location, discount rate, tax rate, FX, carbon price, and other global controls.
2. Select battery chemistry and edit mineral intensity, supplier data, virgin/recycled price curves, recycled-content ramps, carbon factors, passport costs, headcount assumptions, EPR inputs, recovery economics, and operating program assumptions.
3. Let the workbook flow those drivers through annual compliance engines, cost-per-kWh calculations, recovery credits, closed-loop economics, supplier-switching economics, cell/pack cost, EV margin, and storage margin.
4. Compare Base, Accelerated Compliance, and Non-Compliance Penalty cases and review the two-way recycled-material sensitivity table.
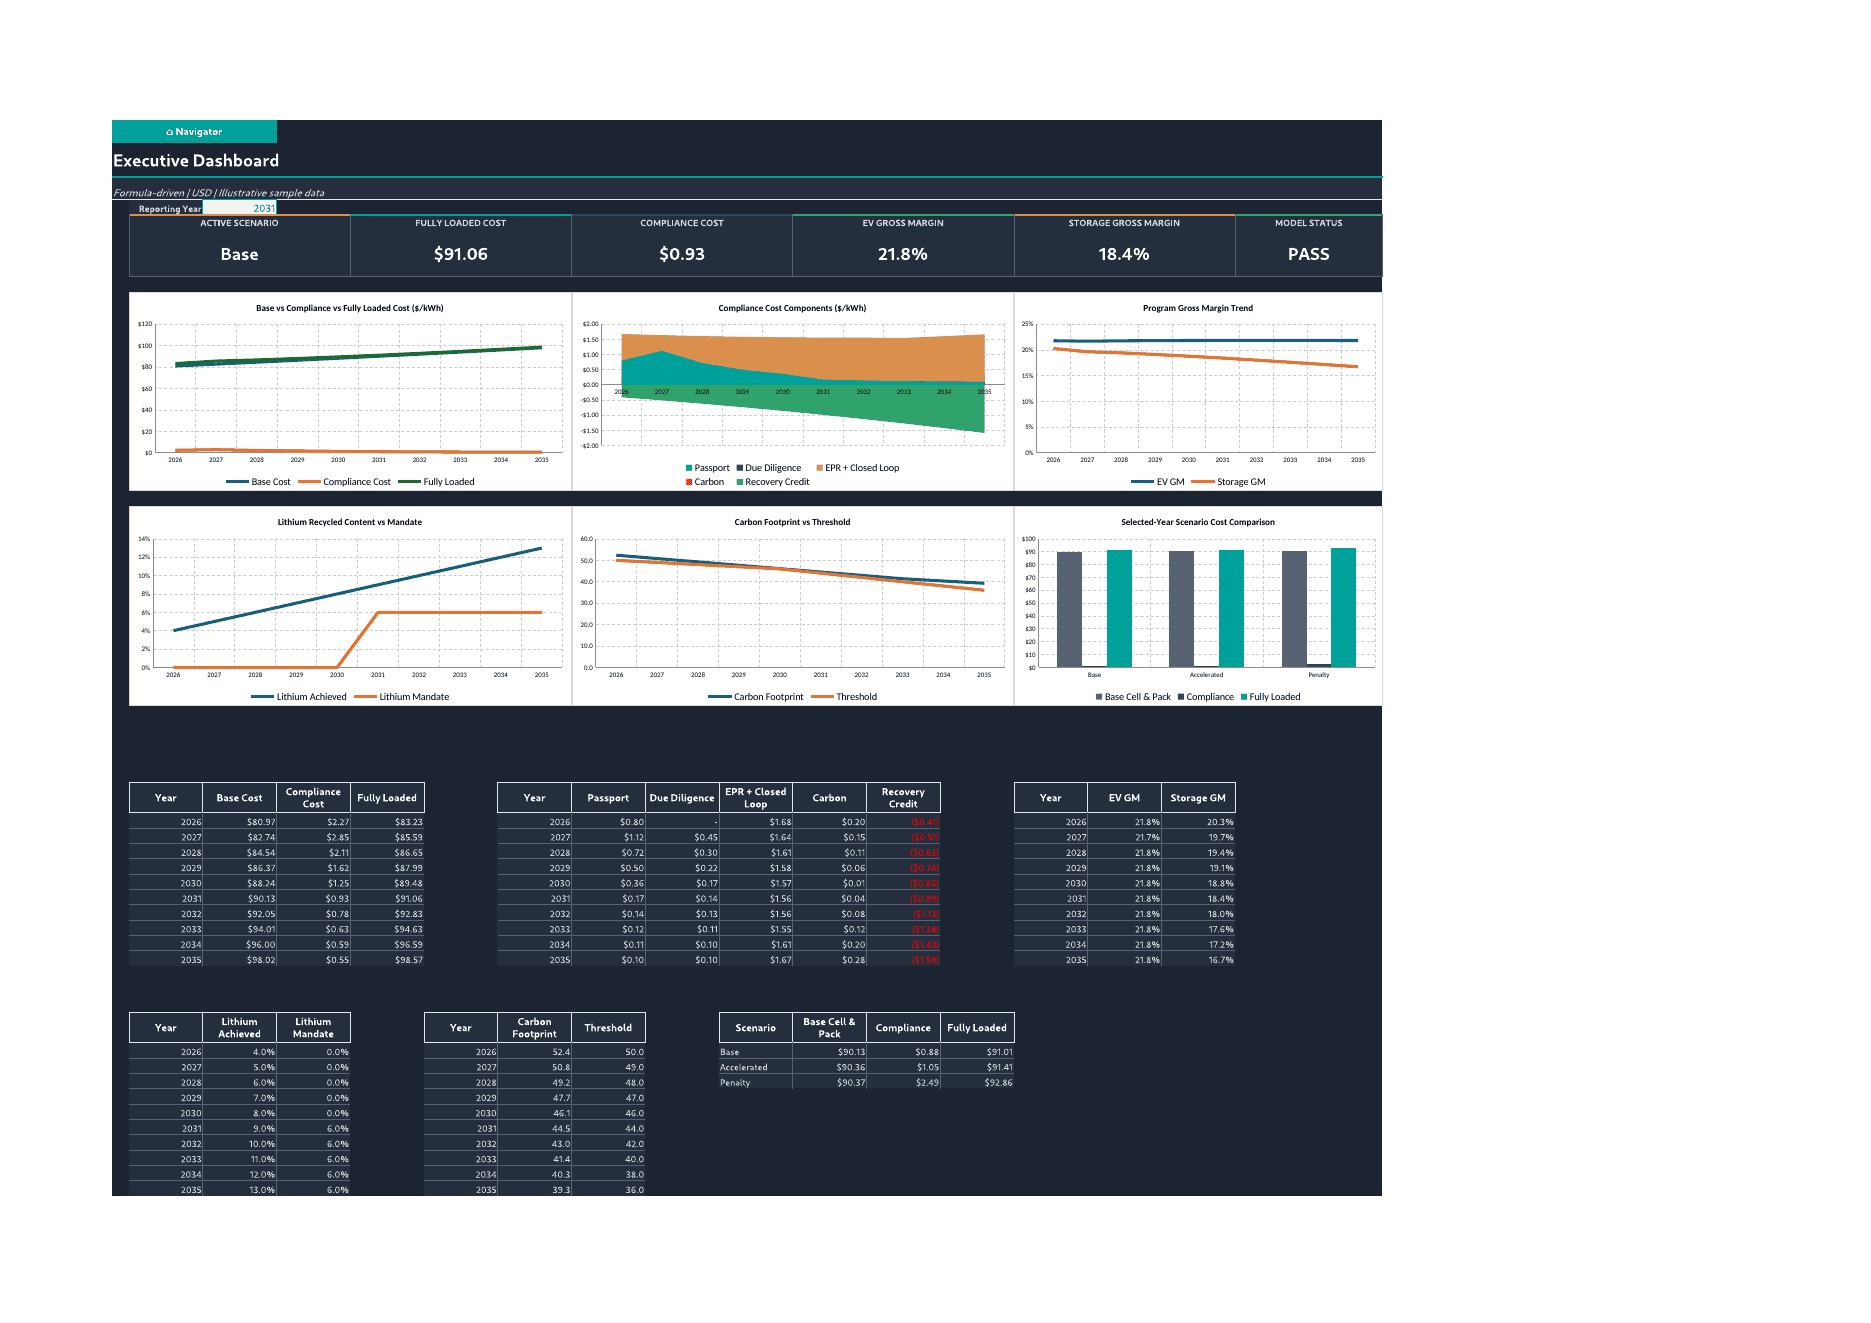
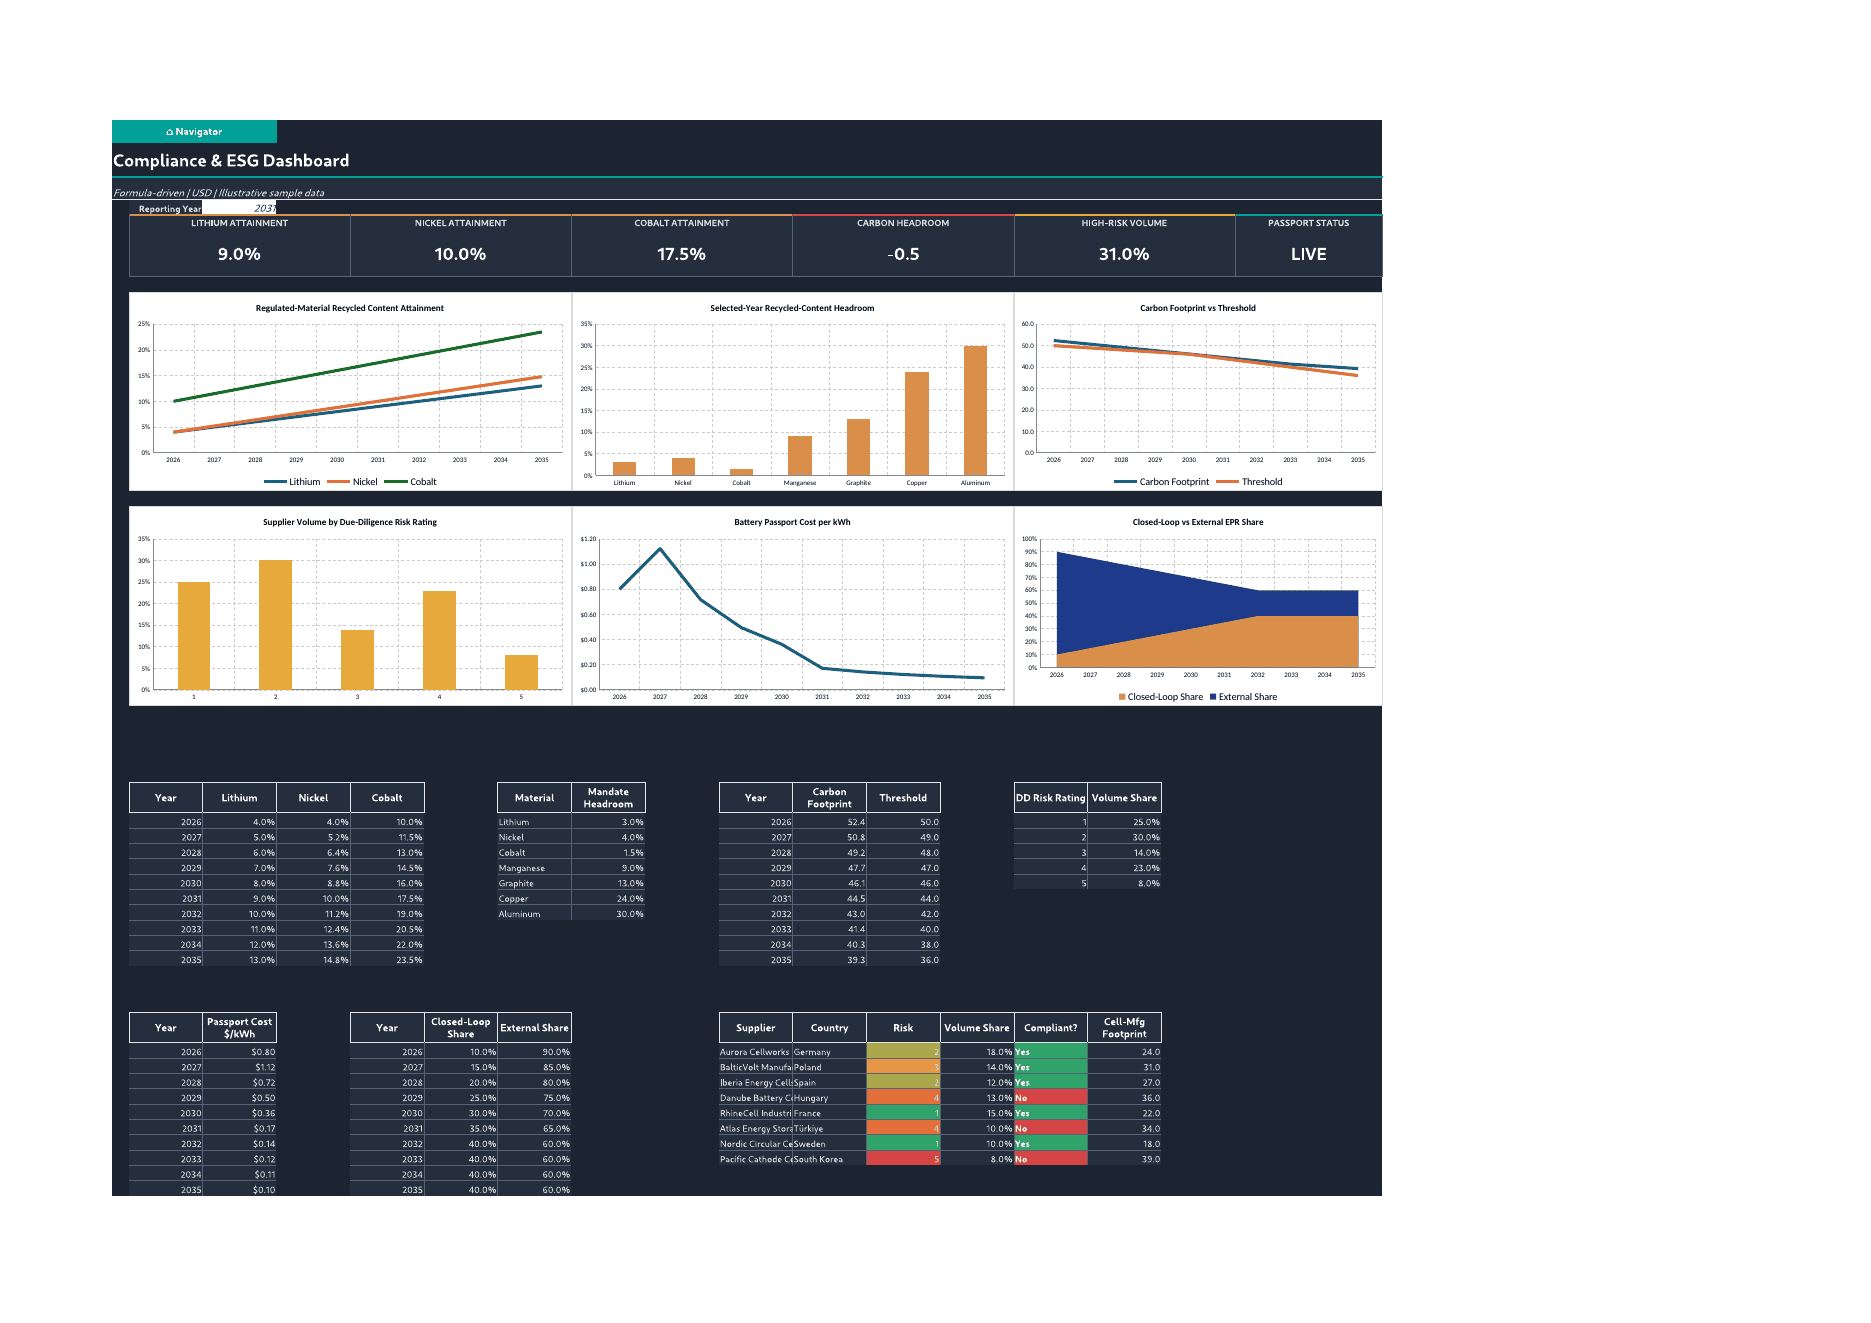
5. Use the Executive Dashboard and Compliance & ESG Dashboard to communicate headline KPIs, trends, cost bridges, regulatory attainment, supplier risk, and program-margin impact.
✏️ Editable Inputs & Core Drivers
The workbook includes editable scenario multipliers for production volume, recycled-content achievement, mandate uplift, cost inflation, carbon-threshold severity, recycled-price movement, closed-loop target share, and non-compliance penalty per kWh. It also includes chemistry-specific mineral intensity for LFP, NMC 622, NMC 811, NCA, LMFP, and Na-ion; supplier country, manufacturing footprint, due-diligence risk, volume share, audit status, contract adjustment, switching cost, and lead time; annual virgin and recycled material prices; carbon-stage assumptions; passport capex and recurring costs; function-level compliance FTE economics; EPR fee inputs; recovery efficiencies; processing costs; closed-loop capex; and program-level EV and stationary-storage commercial assumptions.
🧮 Calculations & Decision Engines
The model calculates achieved recycled content by material and compares it with mandate levels; builds cradle-to-gate battery carbon footprint and carbon cost; converts battery-passport implementation and recurring costs into $/kWh; scales supplier due-diligence headcount and cost with volume and supplier count; calculates chemistry-based EPR fees; estimates end-of-life recovery value net of processing; compares internal closed-loop processing with external EPR; evaluates supplier switching using risk, delay, requalification cost, contract economics, regulatory exposure, and discounted NPV; builds annual bottom-up cell and pack cost; and bridges base cost to fully loaded compliance cost.
It then carries the resulting cost into EV and stationary-storage program P&Ls, including ASP or price growth, non-battery cost inflation, compliance-cost pass-through, gross profit, gross margin, and margin erosion. Scenario and sensitivity modules show how the same economics move when compliance ambition, market prices, volume, and penalty assumptions change.
📚 Worksheet Coverage
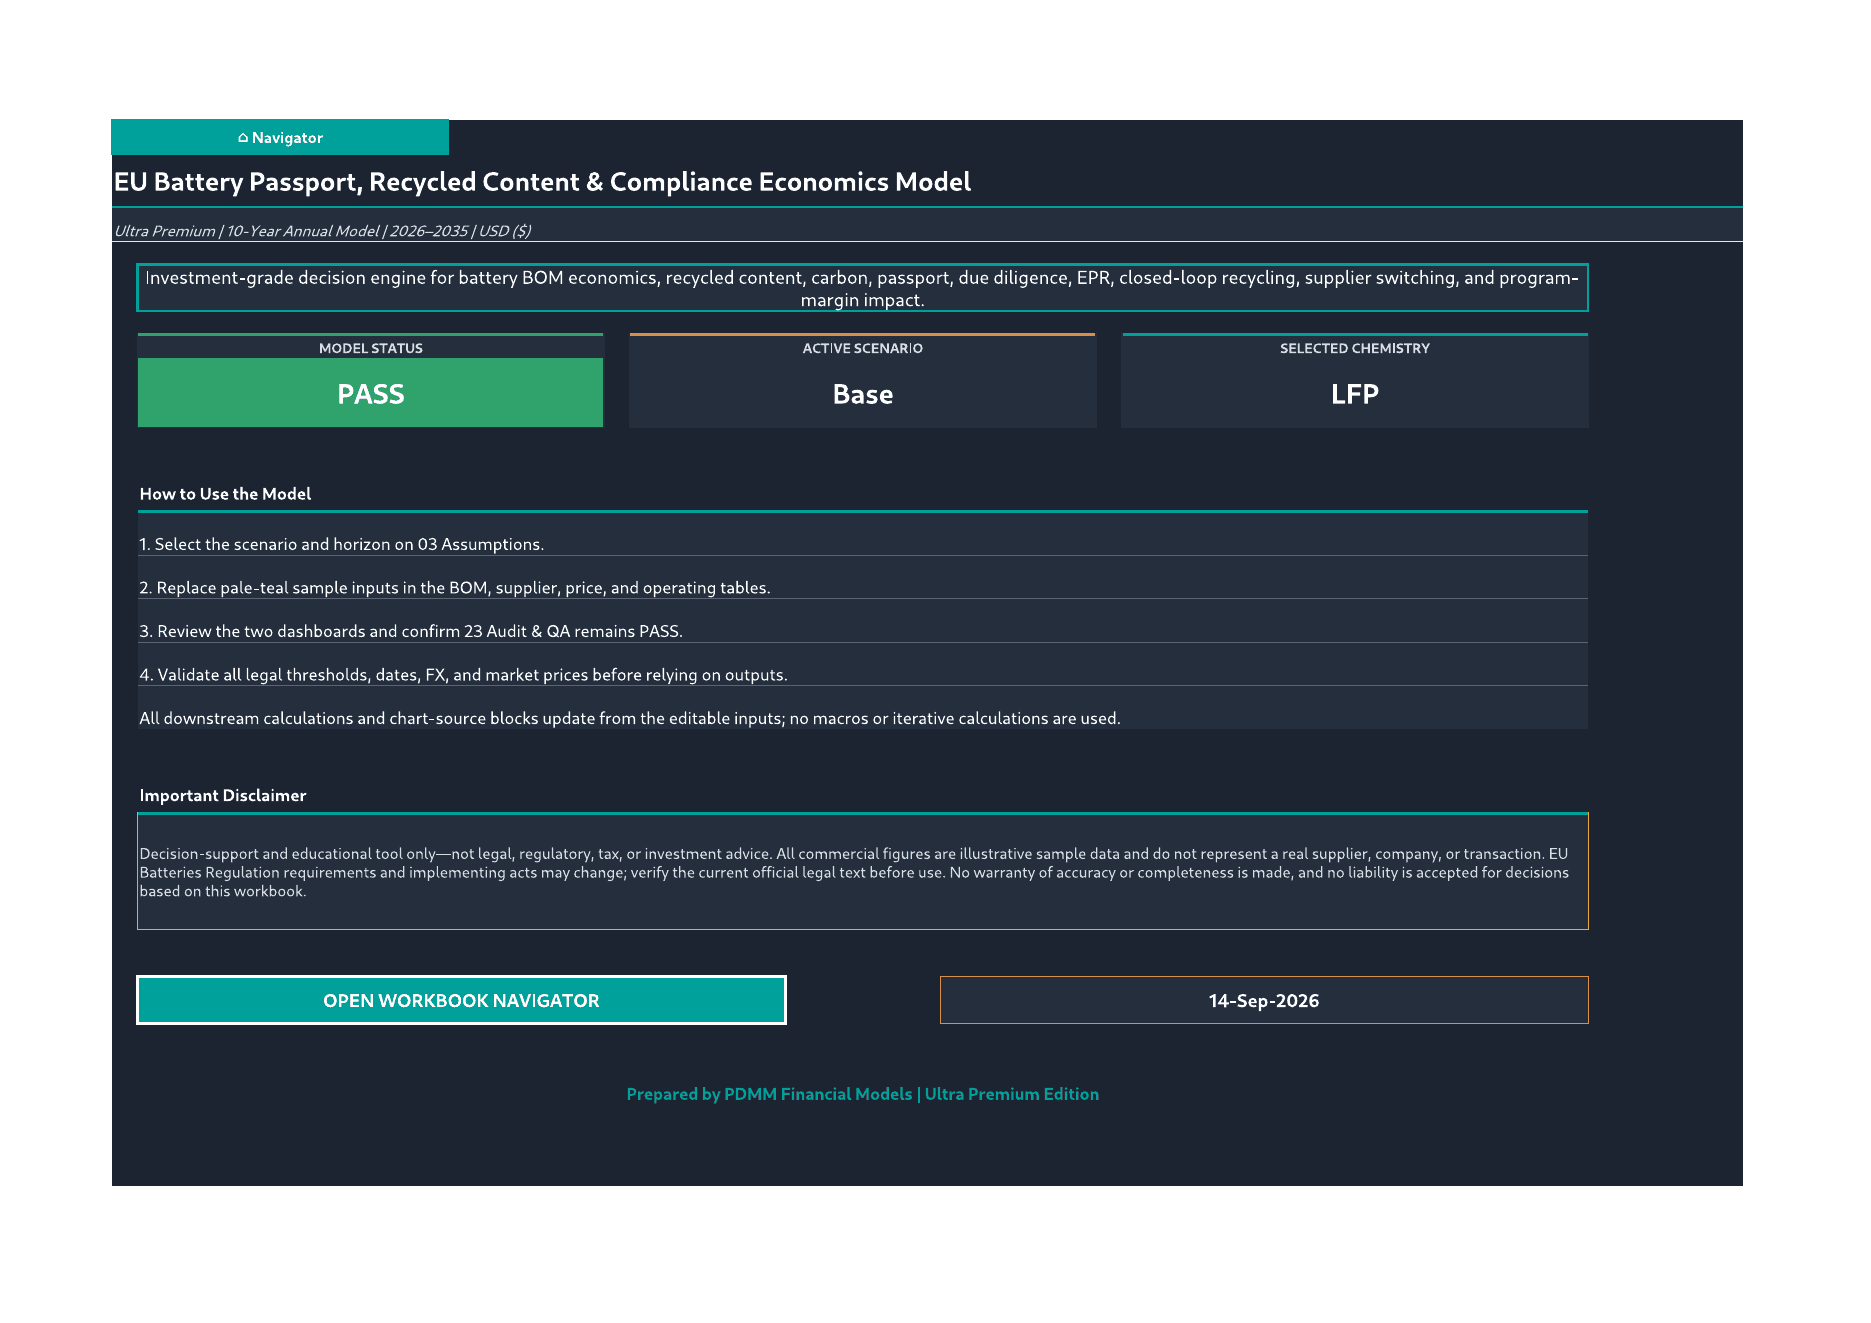
- 01 Cover / 02 Navigator – model scope, instructions, clickable navigation, cell-role legend, and workbook map.
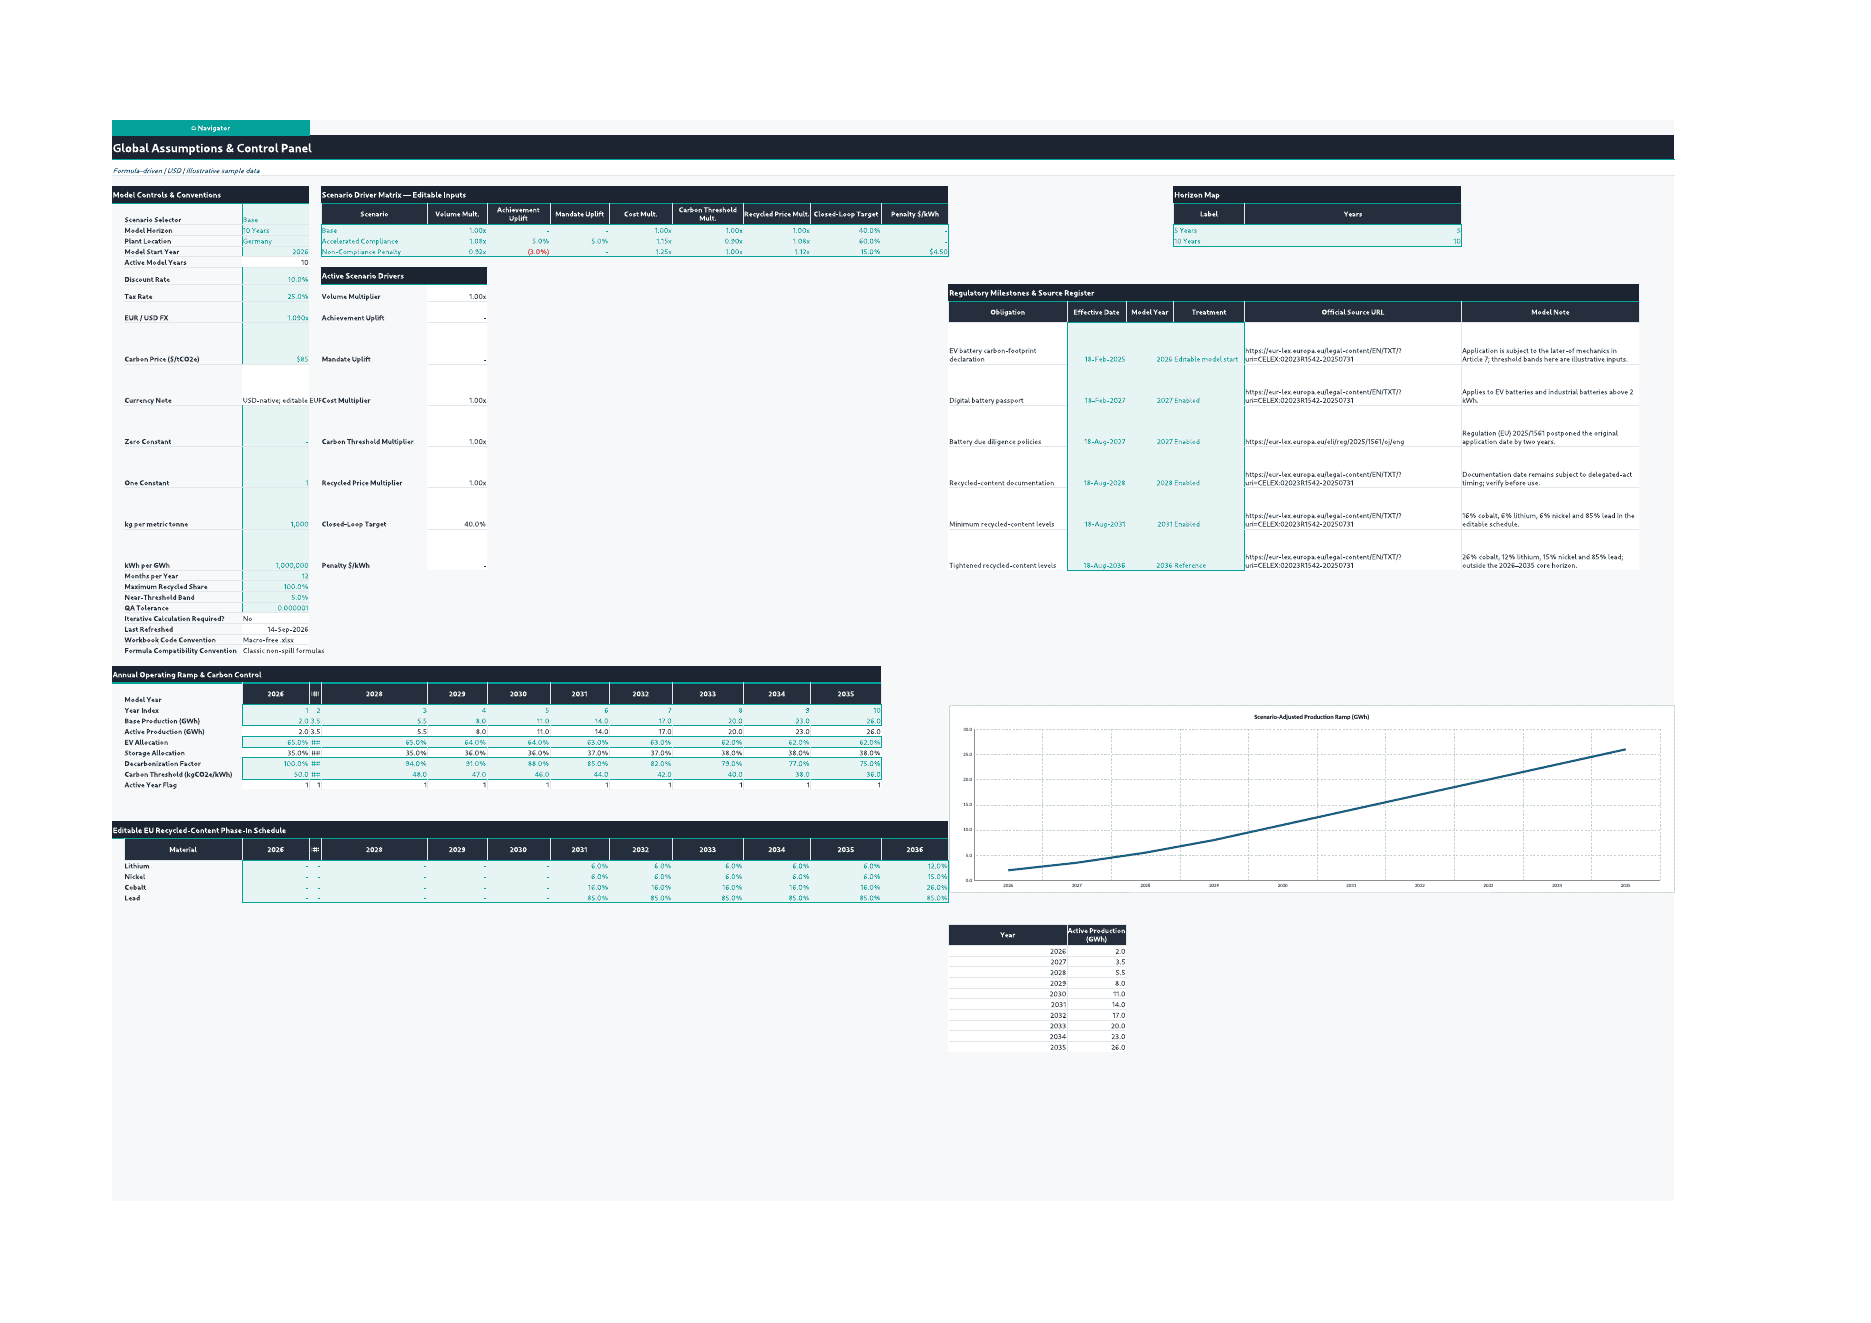
- 03 Assumptions – global controls, scenario driver matrix, annual production ramp, horizon selection, regulatory milestone schedule, and source register.
- 04 BOM & Chemistry – chemistry selector, mineral intensity reference table, selected BOM, pack/cell mass, and material-cost snapshot.
- 05 Supplier Register / 06 Material Prices – supplier origin, footprint, risk, compliance and contracted share plus annual virgin and recycled price curves.
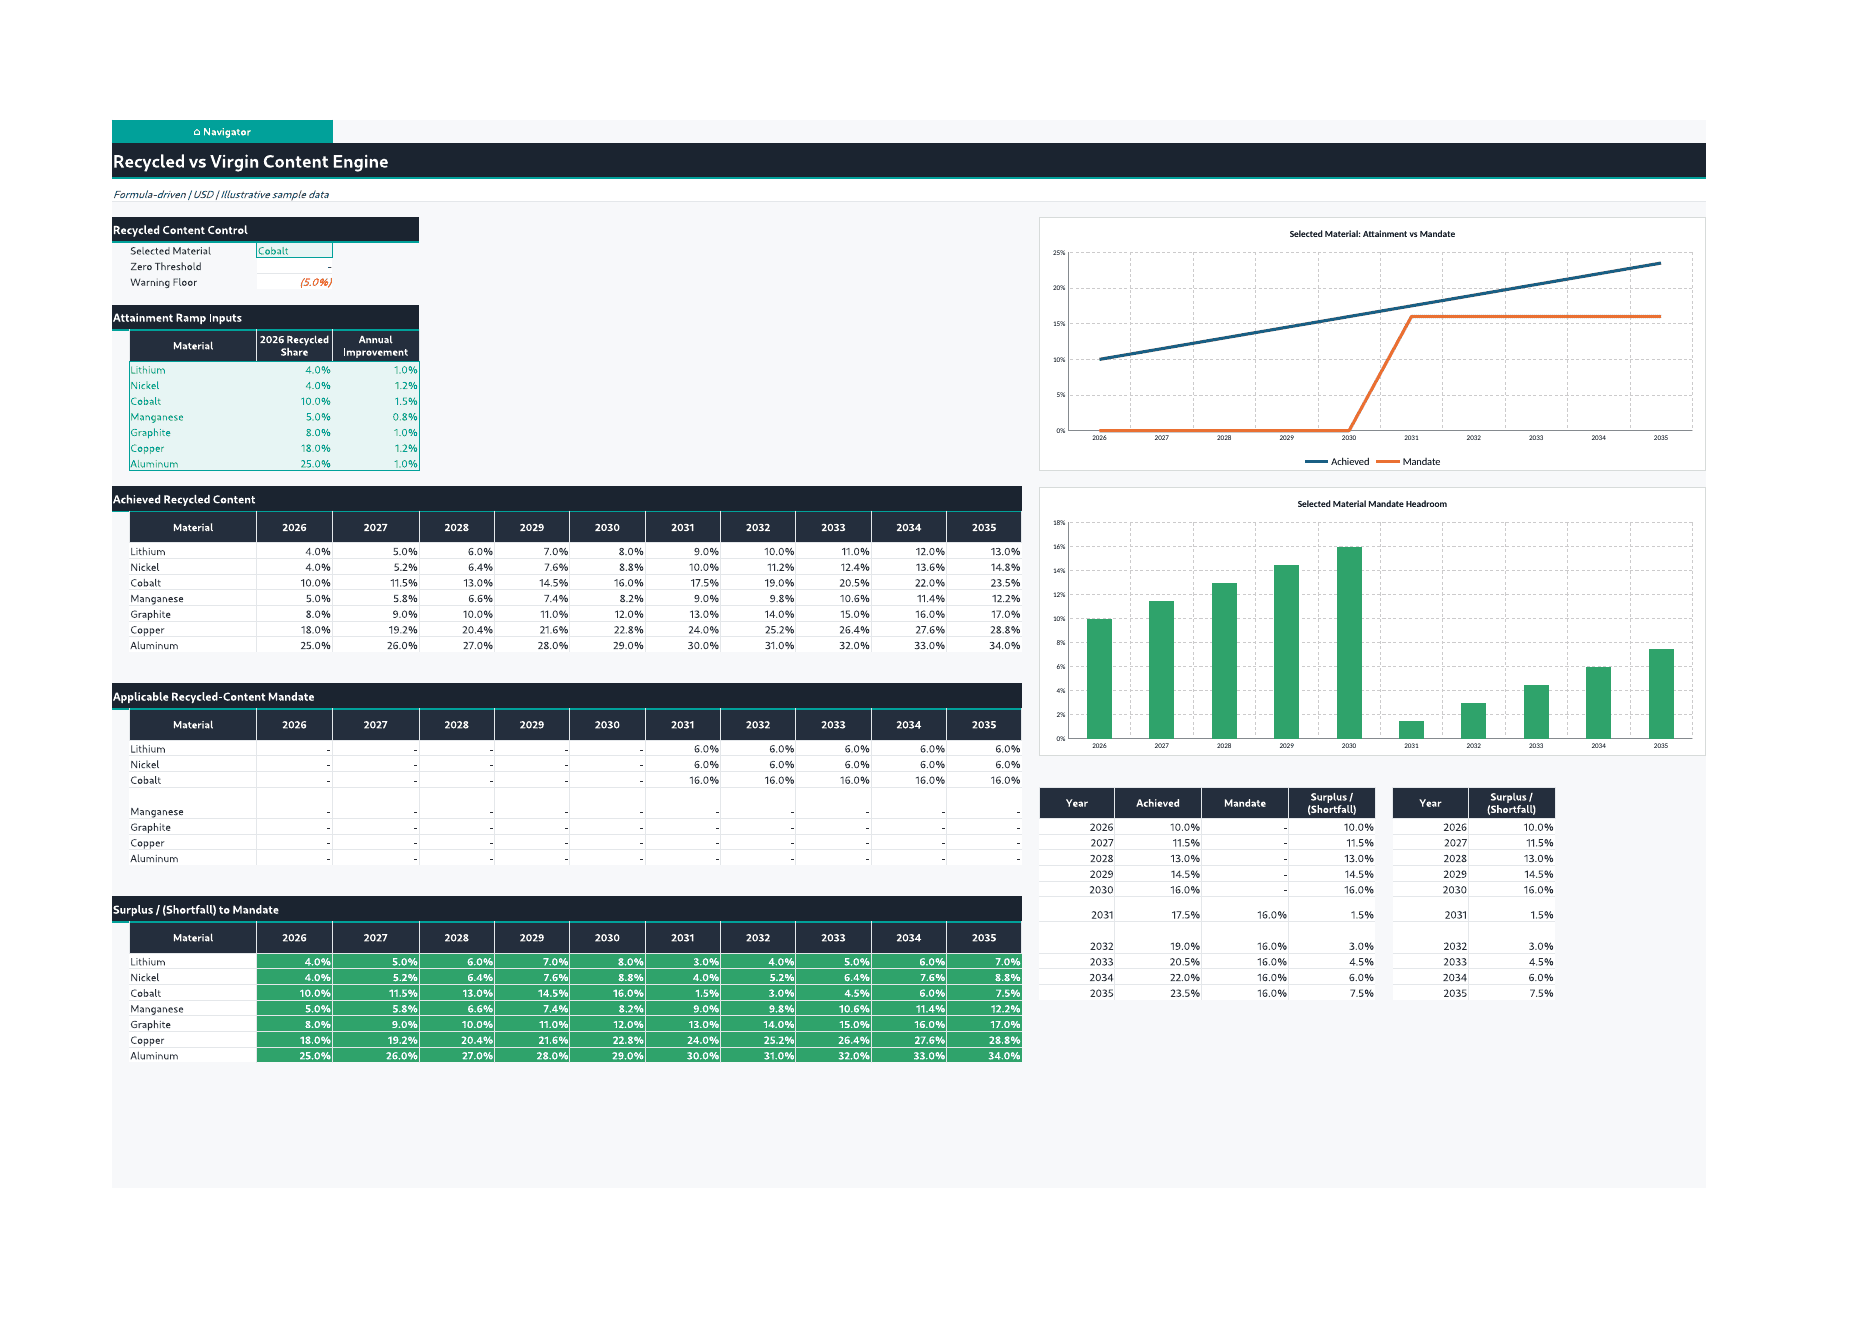
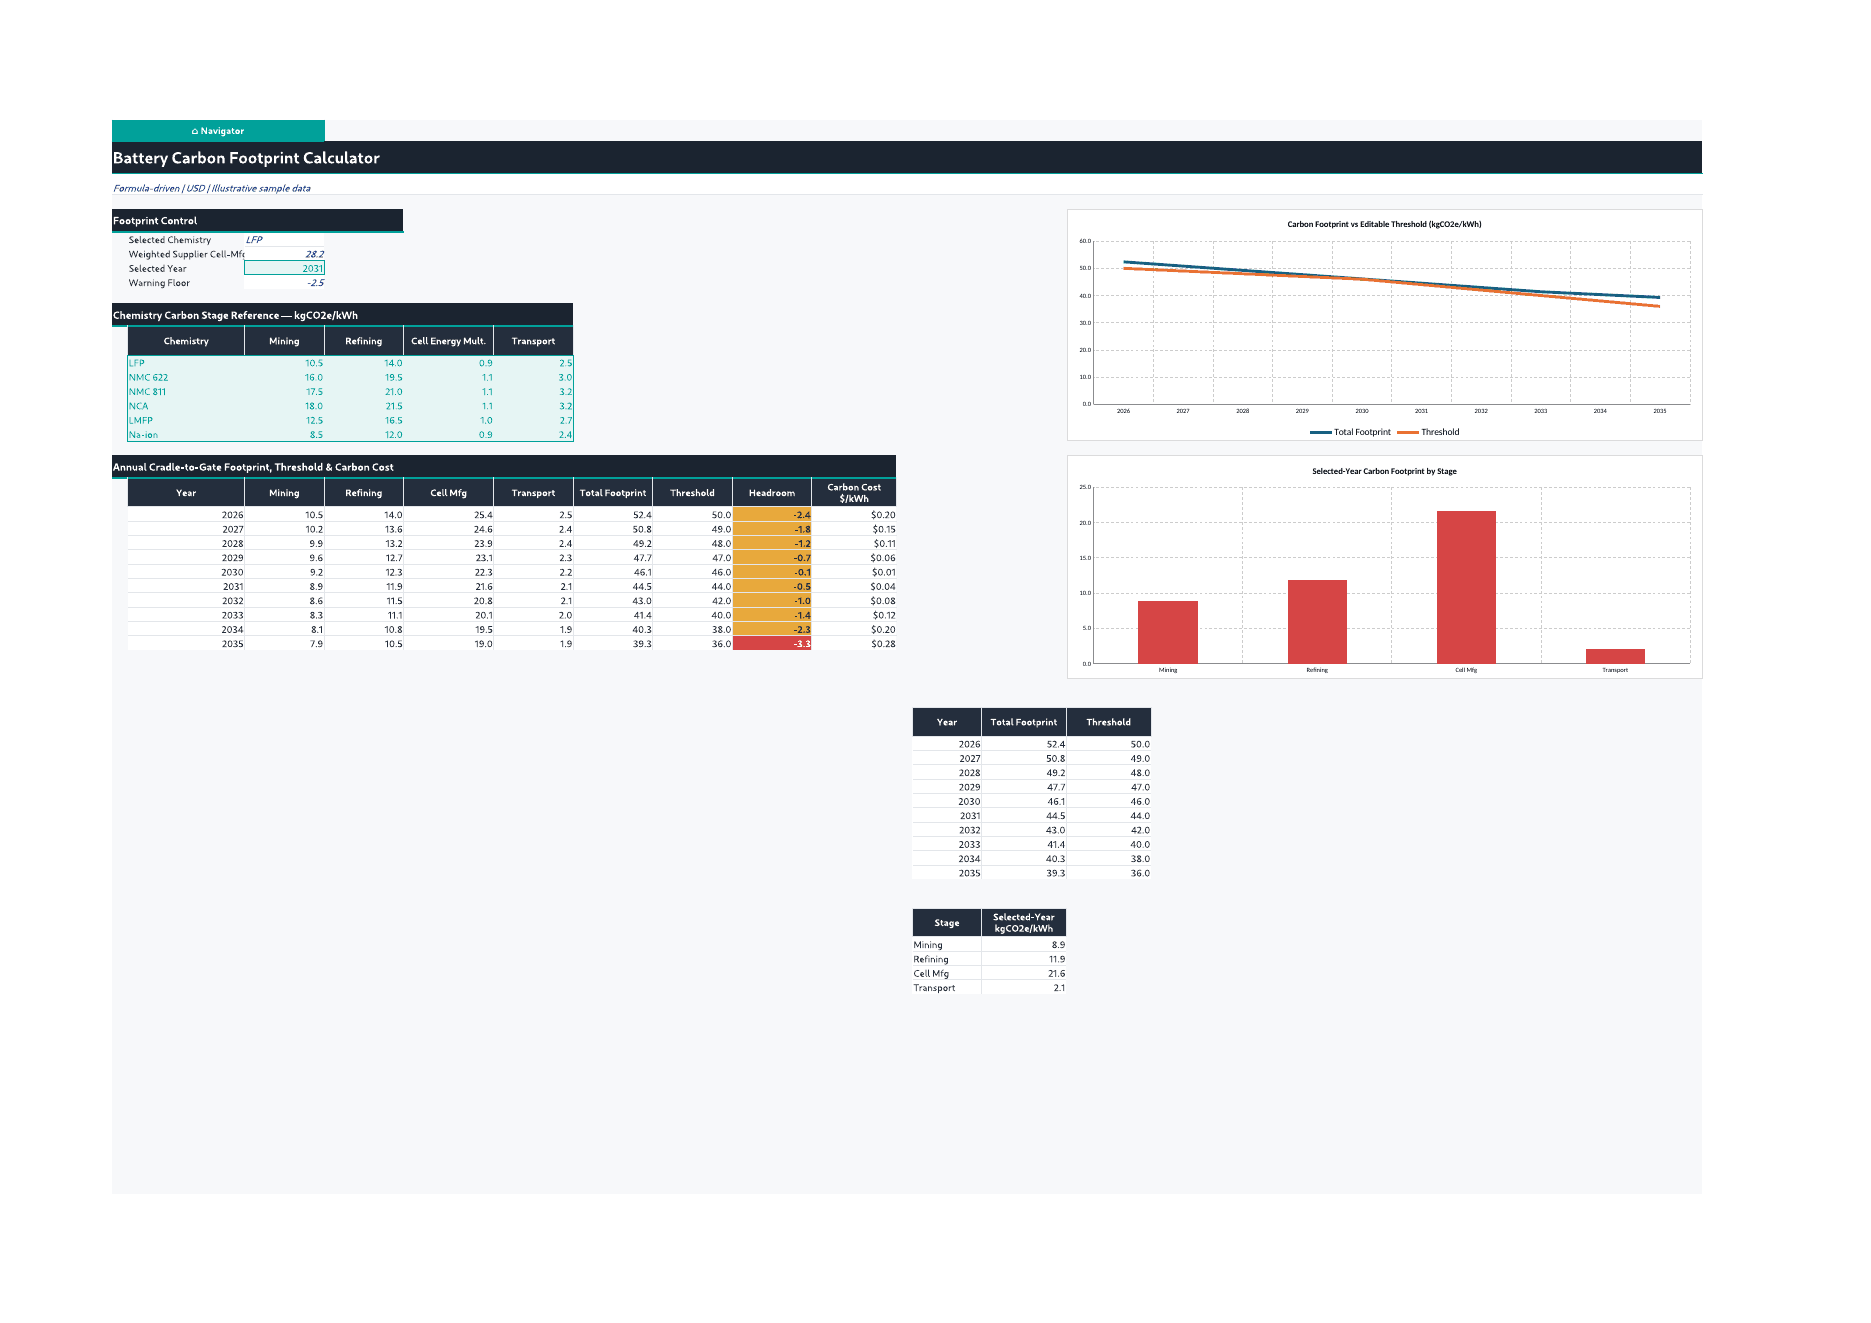
- 07 Recycled Content / 08 Carbon Footprint – attainment versus mandate calculations and cradle-to-gate footprint, threshold, headroom, and carbon cost.
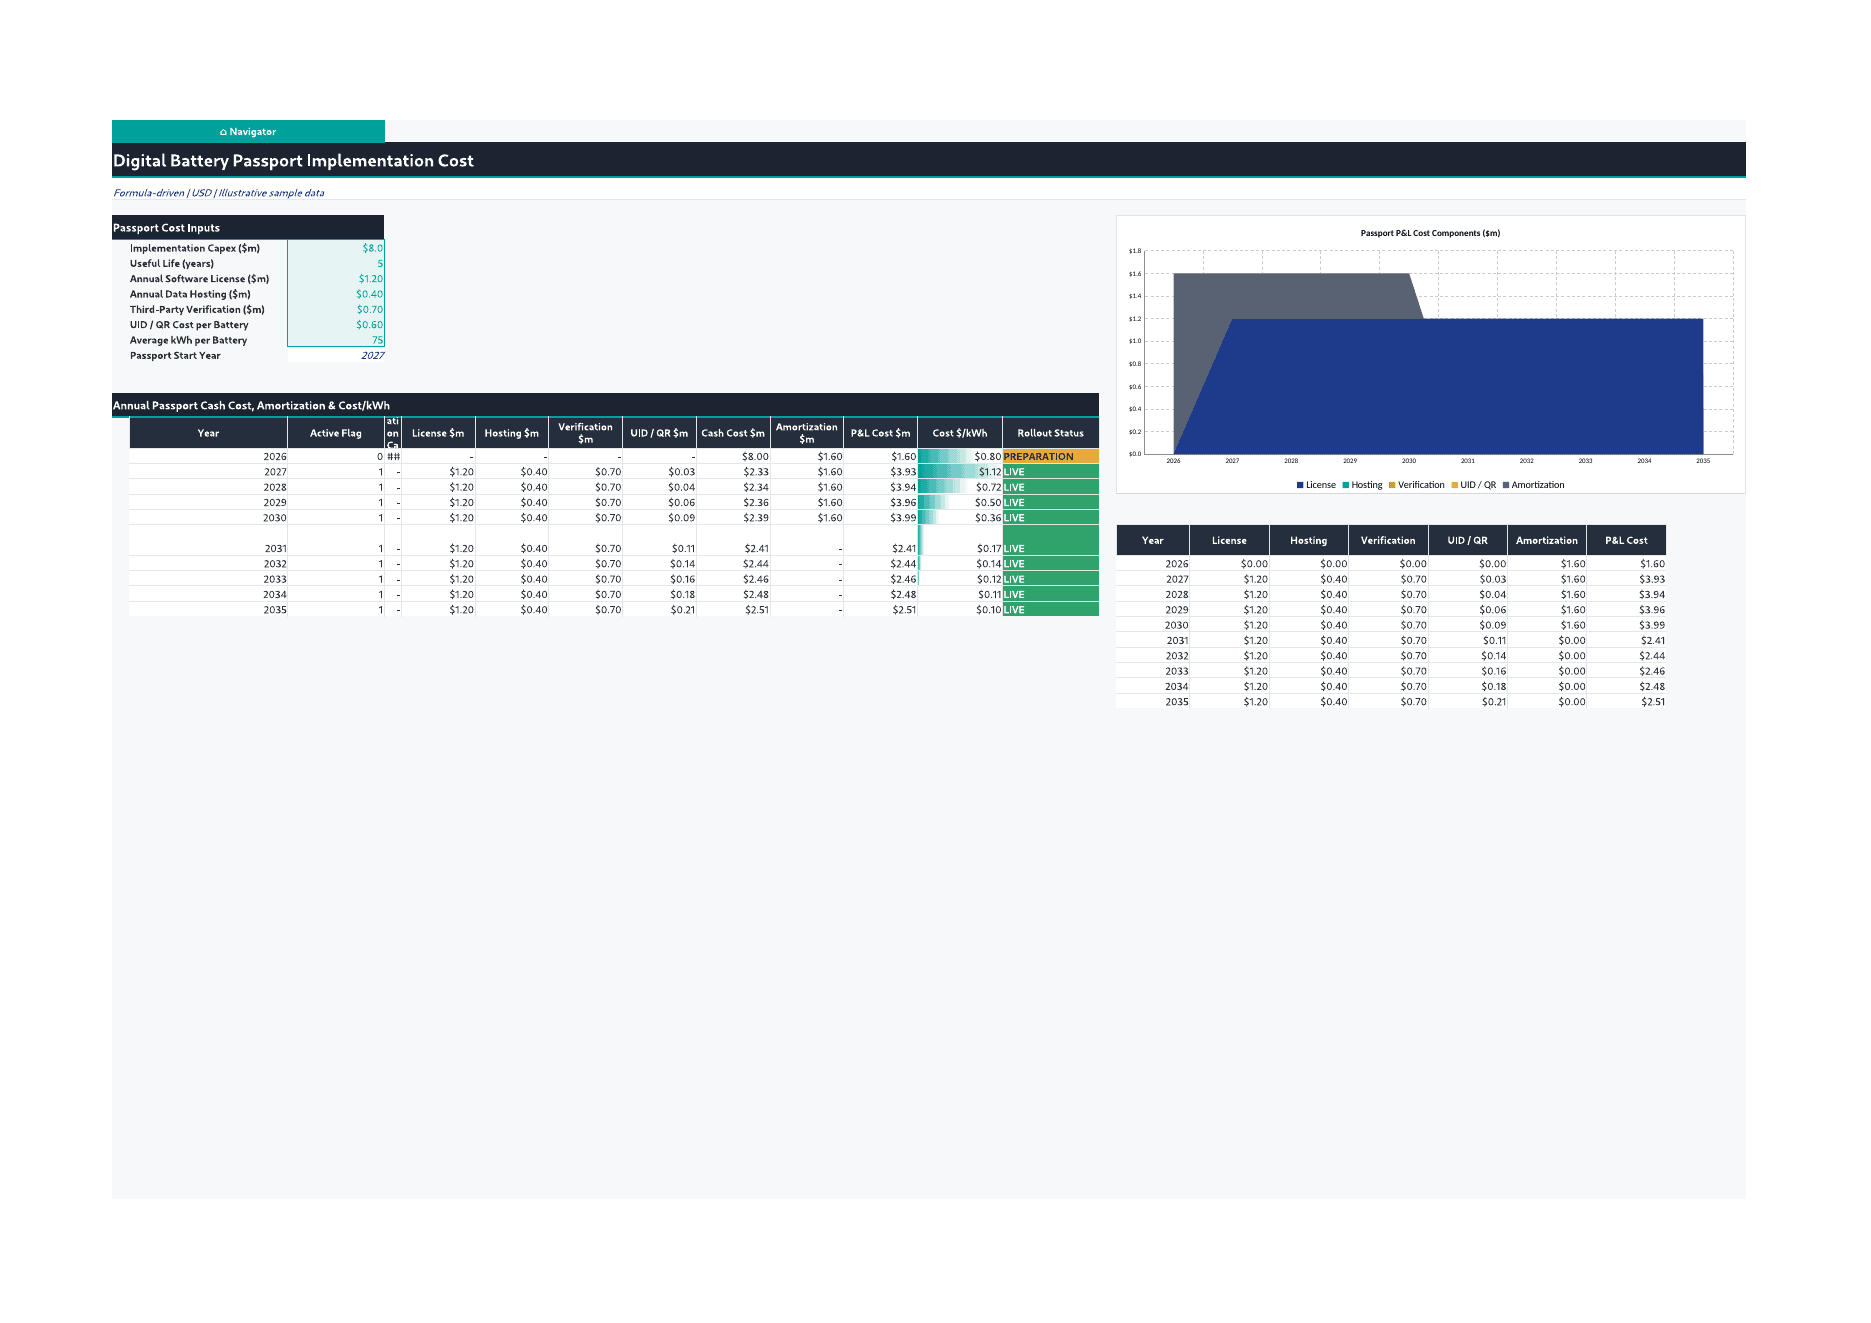
- 09 Battery Passport / 10 DD & Headcount – implementation capex, recurring software/data/verification/UID costs, amortization, rollout status, FTE build-up, and compliance labor cost.
- 11 EPR Fees / 12 EOL Recovery – chemistry-based EPR cost per kWh and recovery economics including collection, recovered mass, gross value, processing cost, and manufacturer value capture.
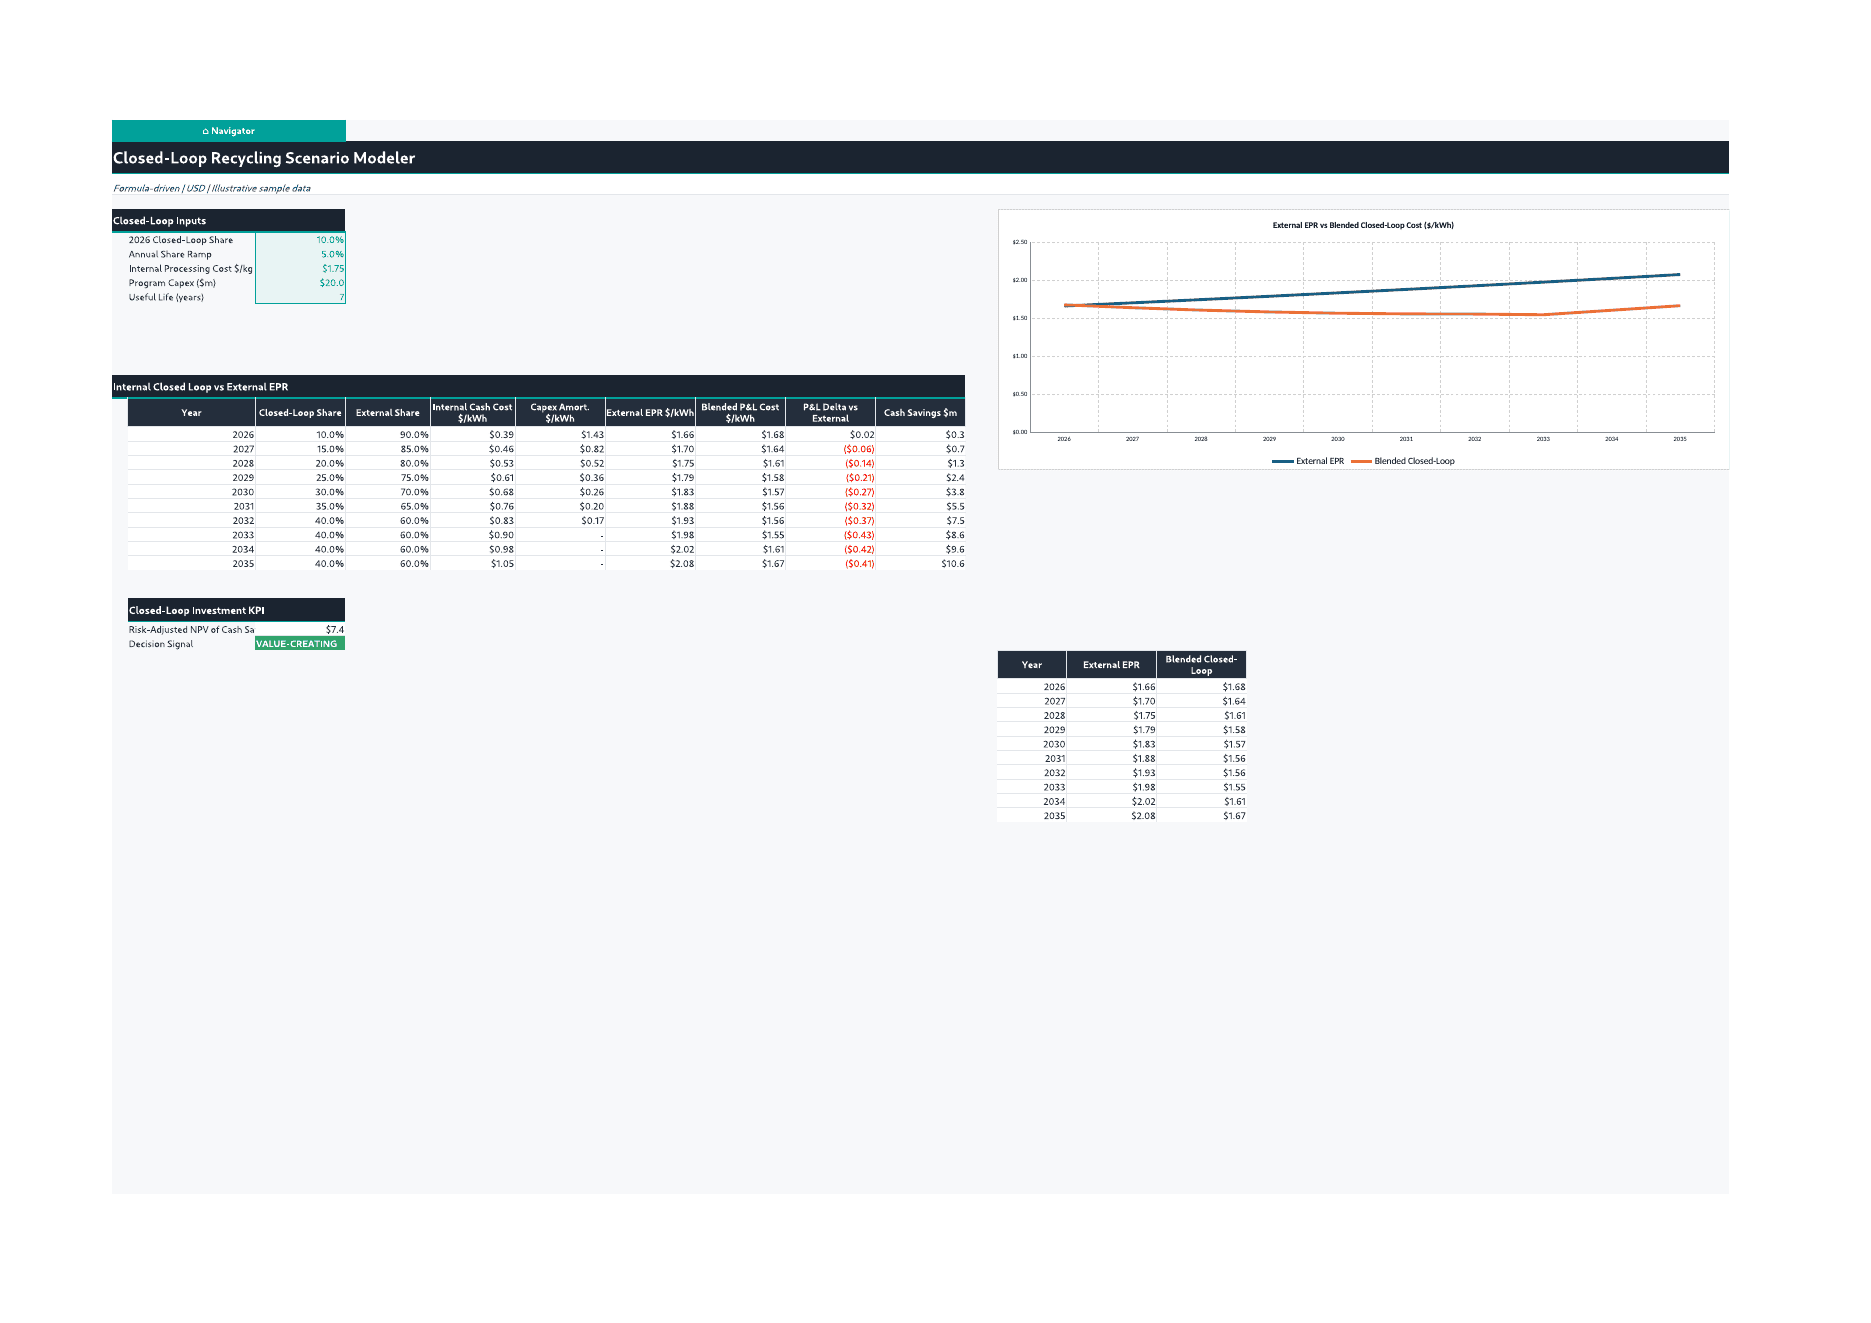
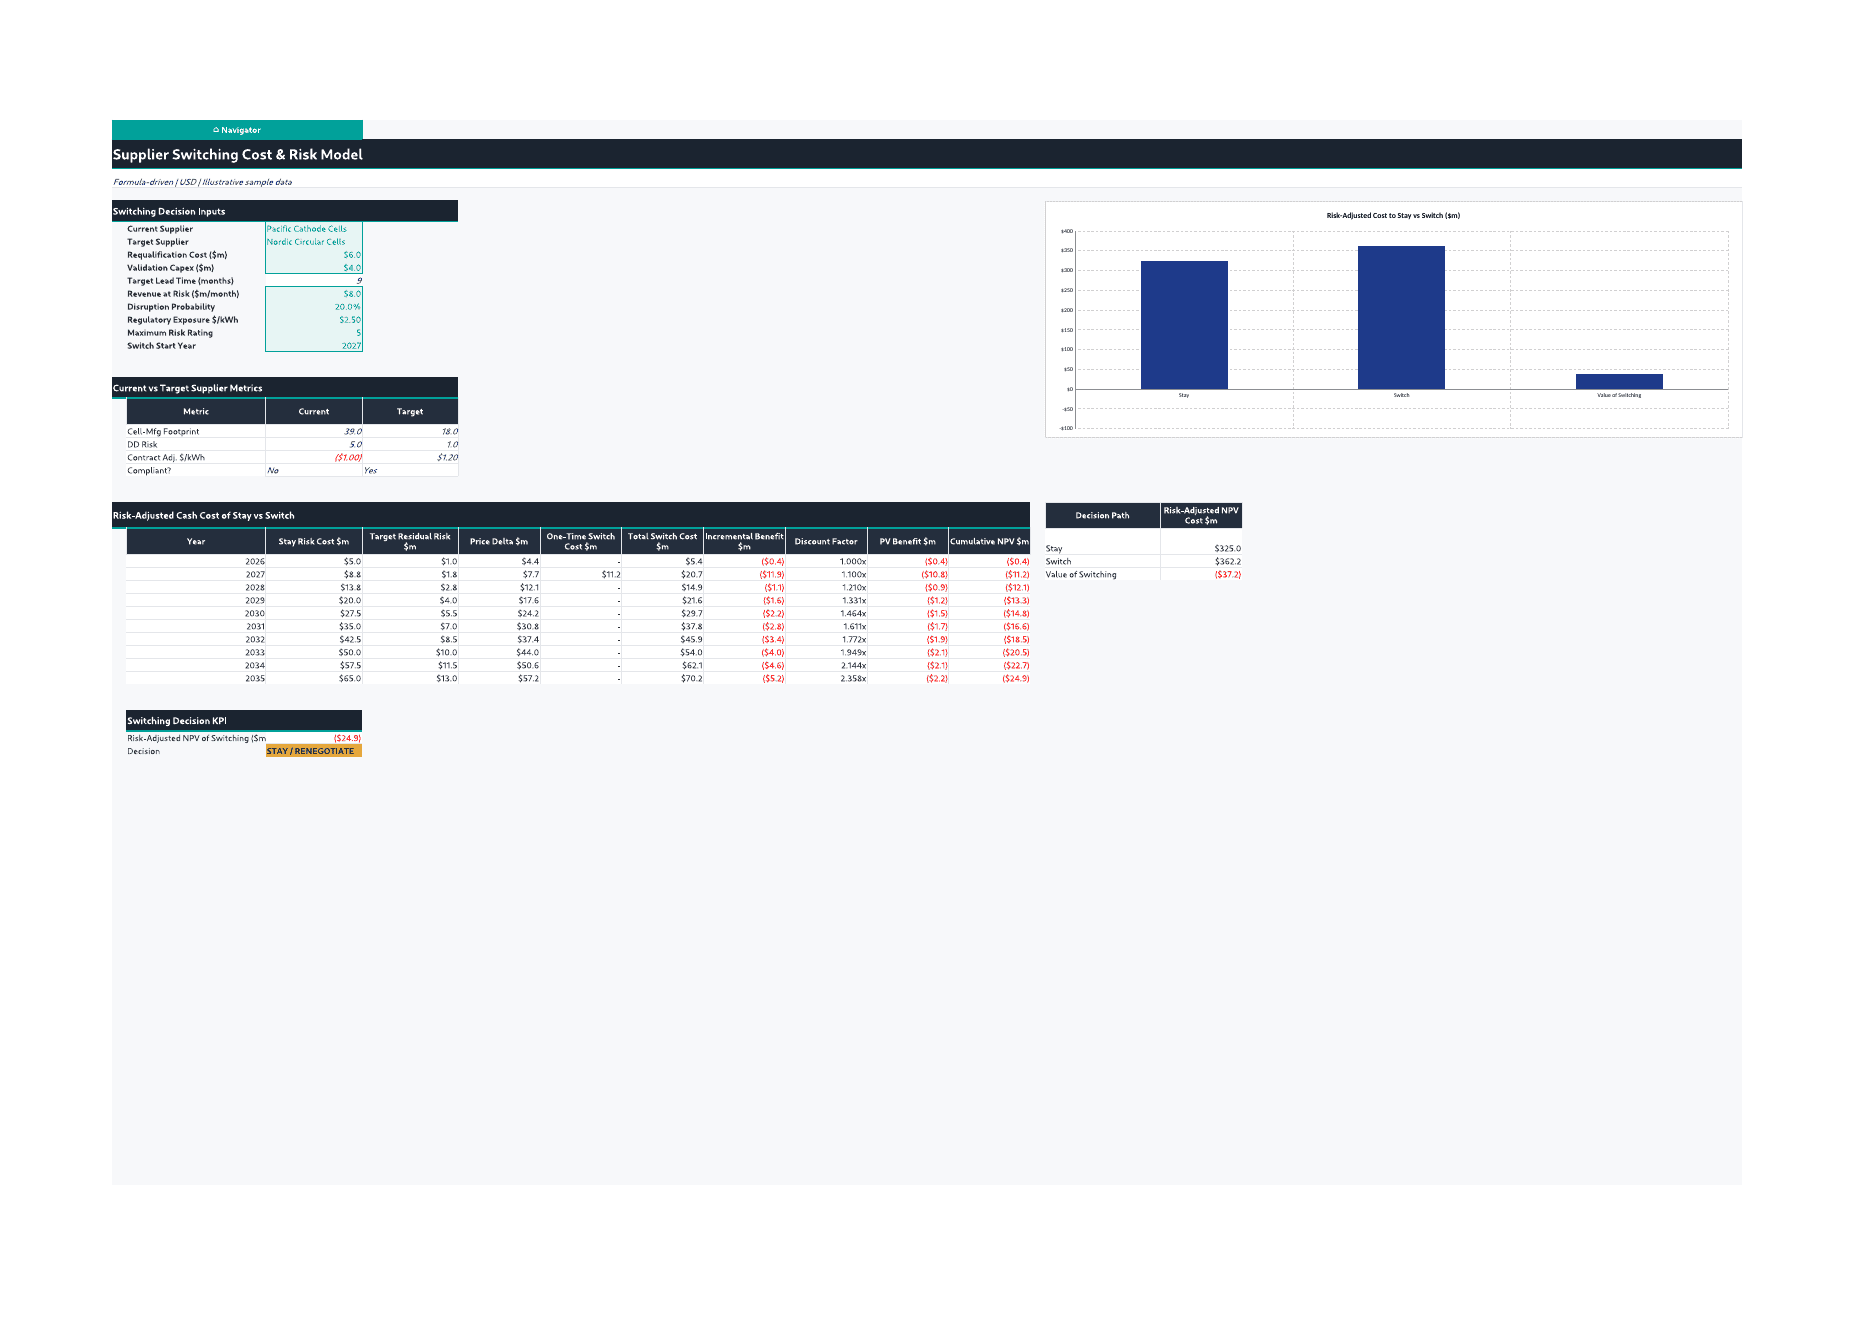
- 13 Closed-Loop / 14 Supplier Switching – internal closed-loop versus external EPR economics, capex and cash savings, plus current-versus-target supplier decision analysis and risk-adjusted switching economics.
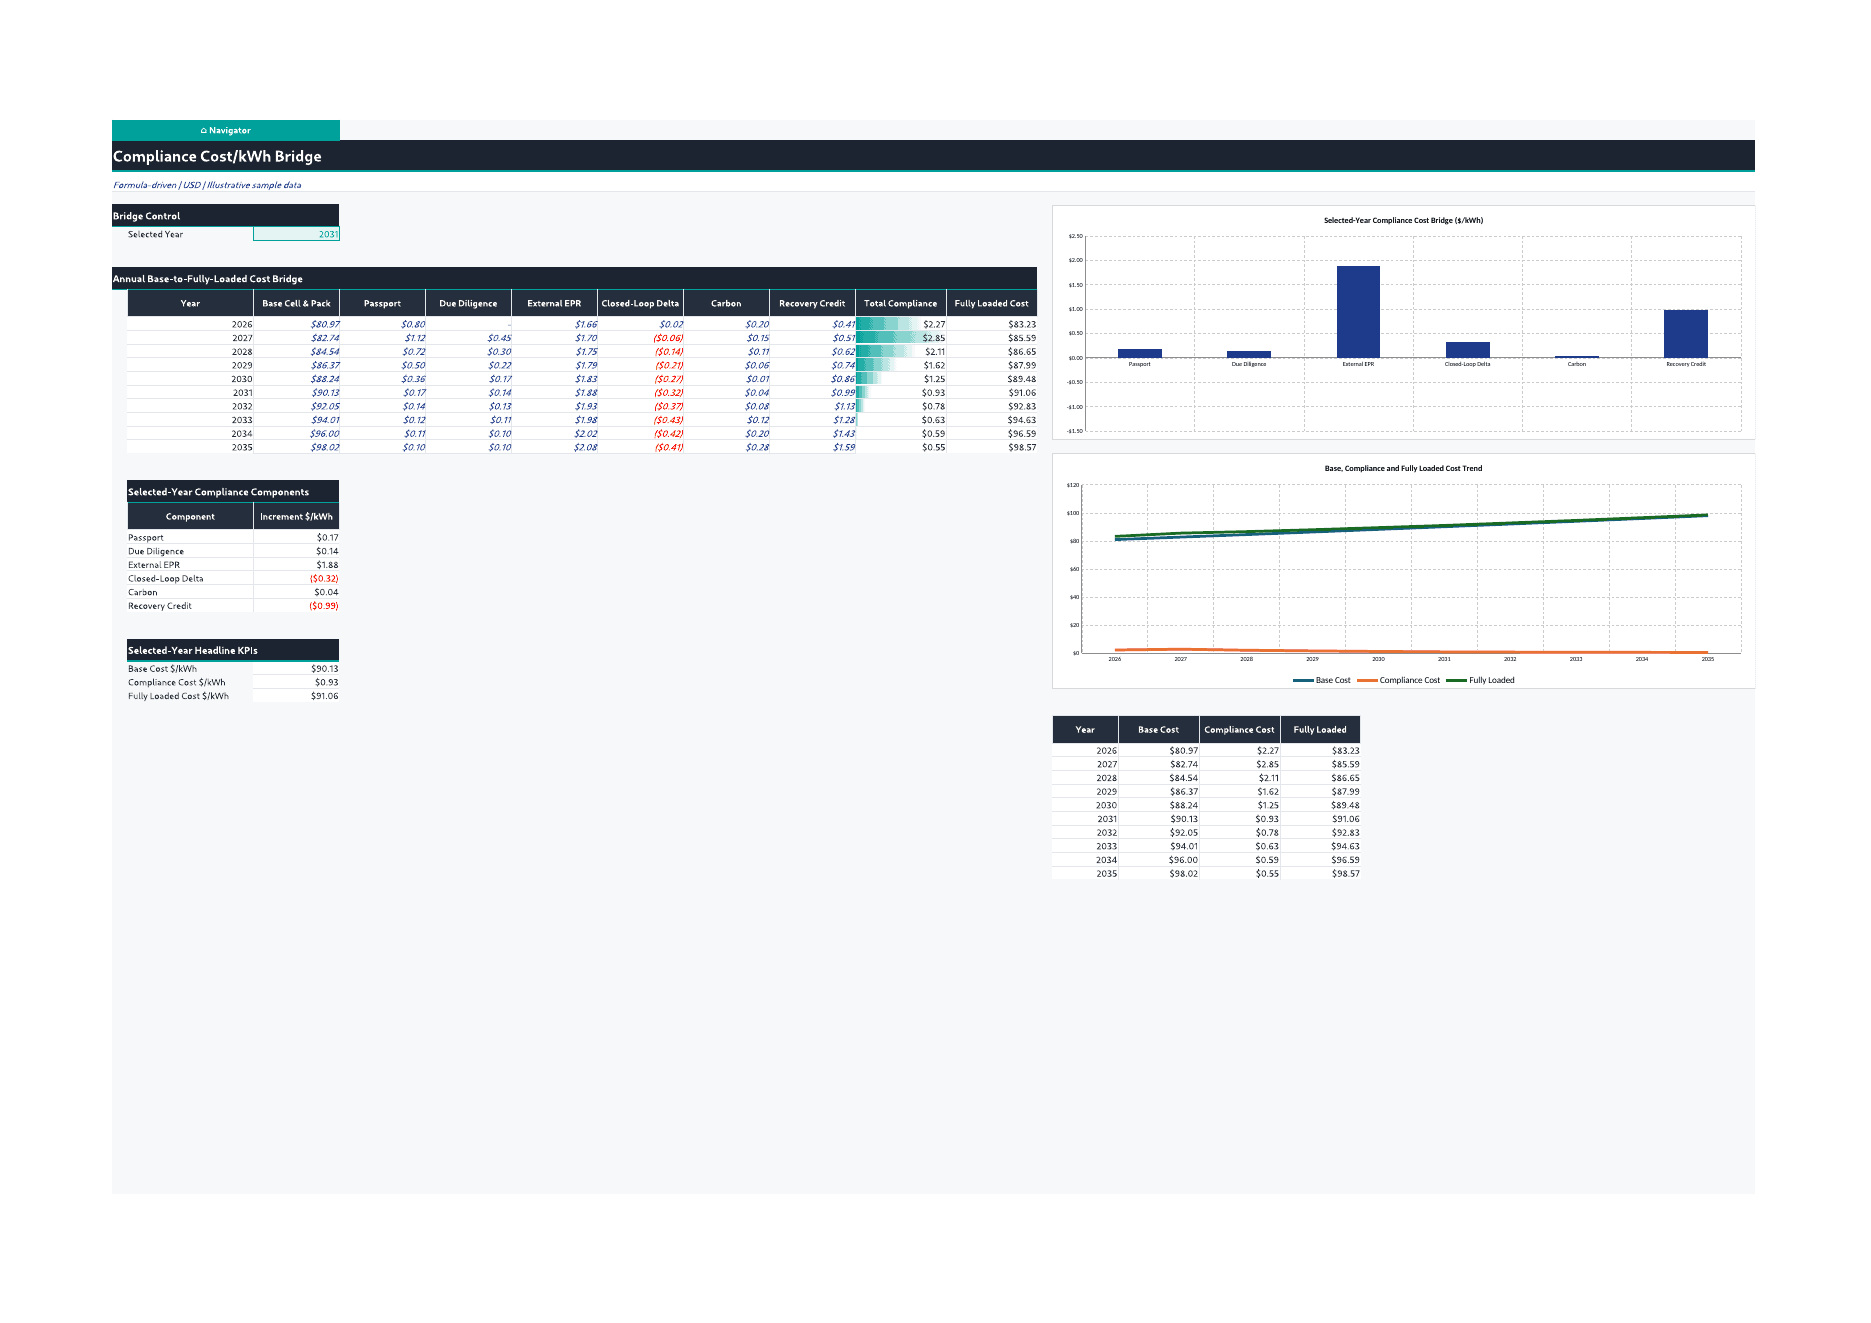
- 15 Cell & Pack Cost / 16 Compliance Bridge – annual bottom-up battery cost and a transparent bridge from base cell/pack cost to fully loaded compliance cost.
- 17 EV Program / 18 Storage Program – annual volume, unit economics, revenue, gross profit, gross margin, compliance pass-through, and margin erosion for EV and stationary-storage applications.
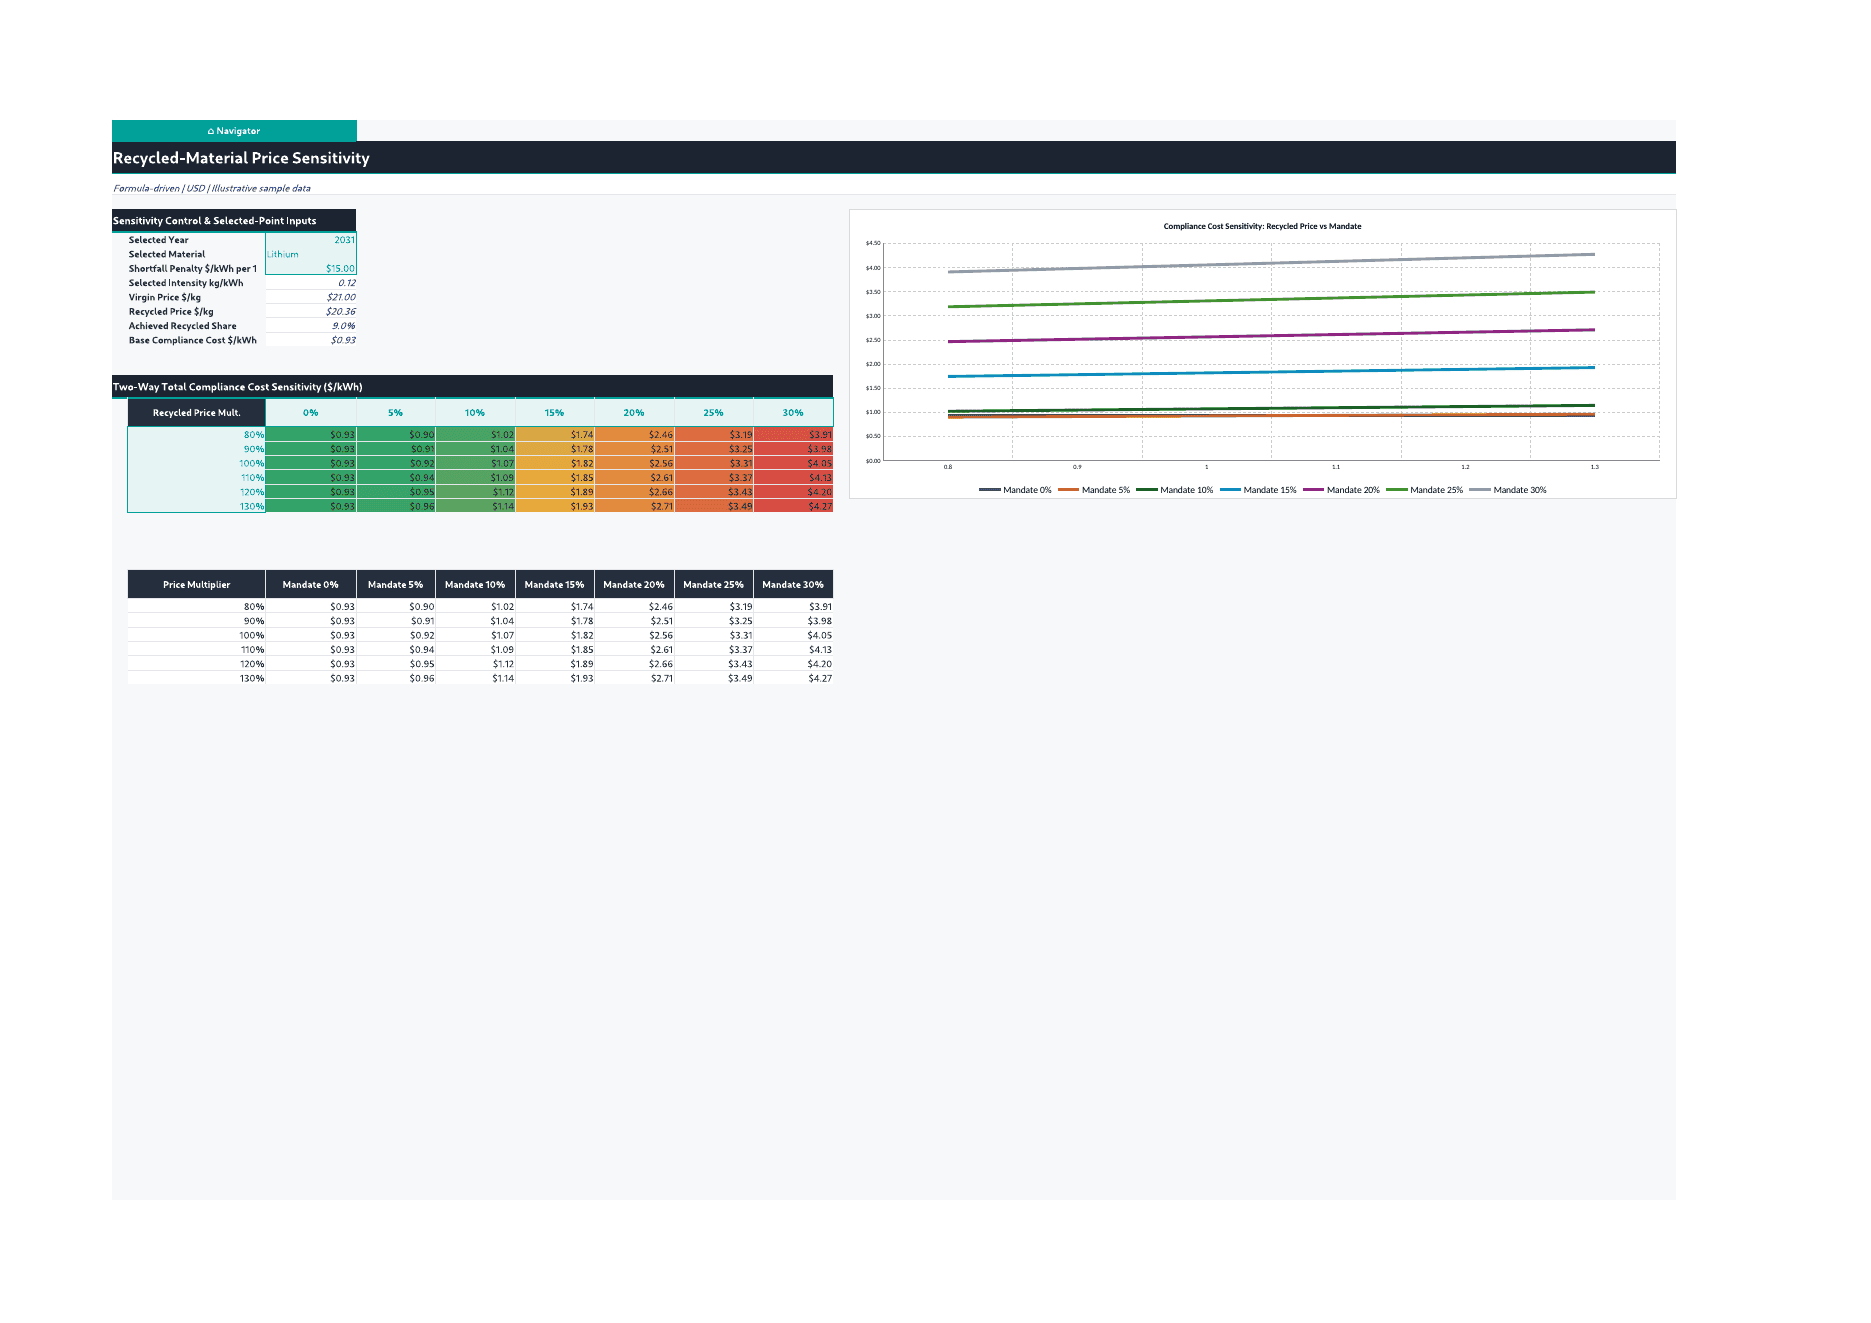
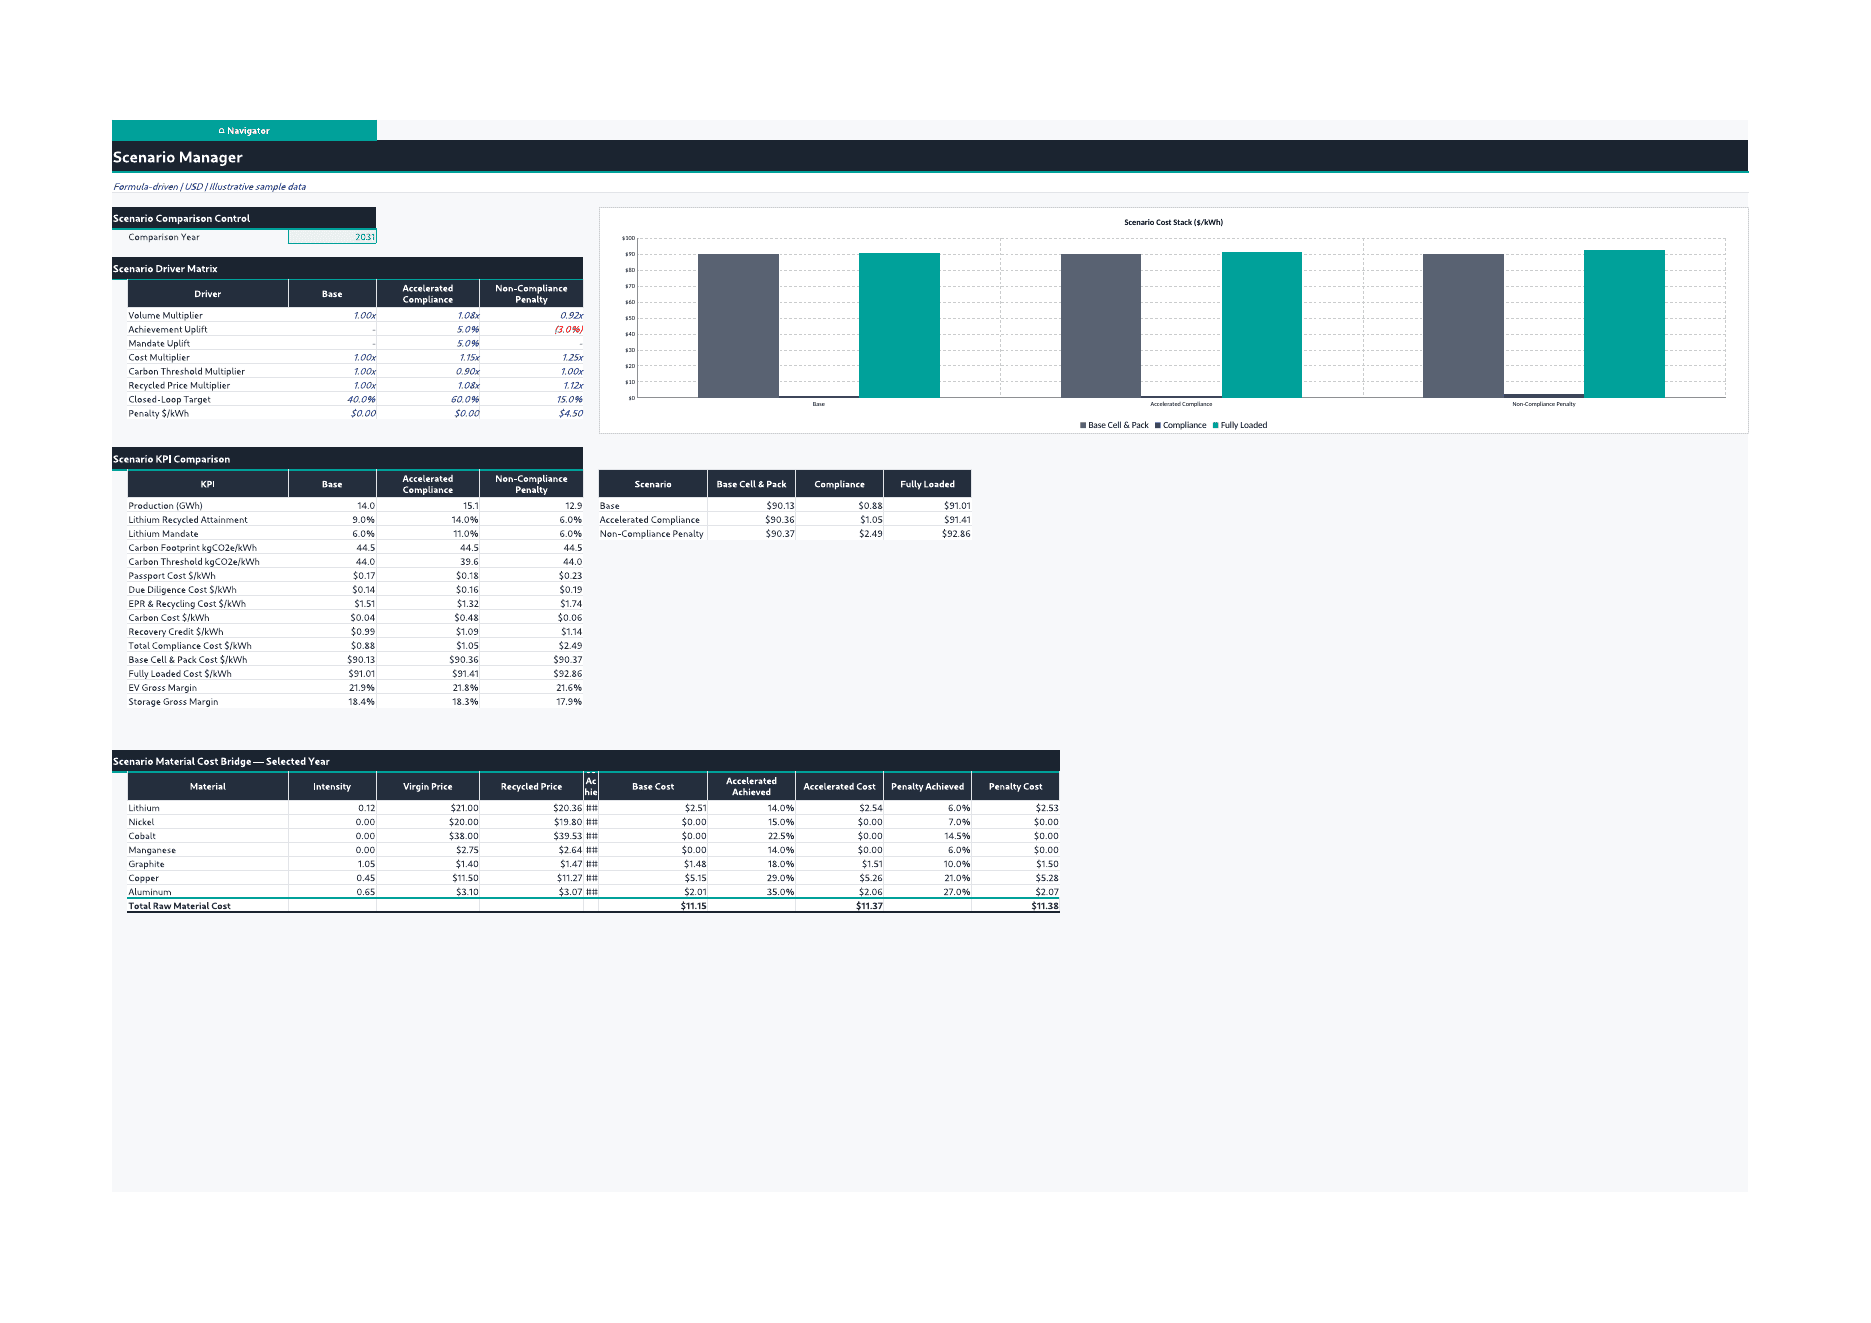
- 19 Sensitivity / 20 Scenario Manager – two-way recycled-material price and mandate sensitivity plus Base, Accelerated Compliance, and Non-Compliance Penalty scenario comparison.
- 21 Executive Dashboard / 22 Compliance Dashboard – KPI cards, time-series charts, scenario comparisons, recycled-content trends, carbon headroom, supplier risk, passport cost, closed-loop share, and program margins.
- 23 Audit & QA / 24 Disclaimer & Methodology – the workbook’s own control/status reporting plus methodology notes and source references embedded by the model author.
📊 Key KPIs & Outputs
Headline outputs include production GWh, base cell and pack cost $/kWh, passport cost $/kWh, due-diligence cost $/kWh, EPR and closed-loop cost $/kWh, carbon cost $/kWh, recovery credit $/kWh, total compliance cost $/kWh, fully loaded battery cost $/kWh, recycled-content attainment and headroom, carbon footprint and threshold headroom, supplier high-risk/non-compliant volume share, closed-loop share, supplier-switching decision economics, EV gross margin, storage gross margin, and scenario-specific cost and margin comparisons.
🔄 Scenarios & Sensitivity
The Base case represents the central operating plan. Accelerated Compliance increases volume and achievement while changing cost, carbon-threshold, recycled-price, and closed-loop assumptions. Non-Compliance Penalty reduces achievement and volume while adding a direct $/kWh penalty. The sensitivity engine separately tests recycled-material price multipliers against alternative mandate levels for a selected material and year, giving users a clear view of cost exposure around the central case.
💼 Recommended Use Cases
- Regulatory planning: quantify the annual economic effect of EU battery-passport, recycled-content, carbon, due-diligence, EPR, and recovery requirements.
- 10-year forecasting: build a 2026-2035 compliance-cost and fully loaded battery-cost outlook.
- Profitability analysis: measure EV and stationary-storage gross-margin erosion after compliance cost and pass-through.
- Cash-flow planning: estimate passport capex, closed-loop capex, recurring cash costs, recovery value, and supplier-switching cash consequences.
- Pricing decisions: test how much compliance cost can be passed through to vehicle or storage pricing.
- Scenario planning: compare Base, Accelerated Compliance, and Non-Compliance Penalty pathways.
- Sensitivity analysis: stress recycled-material price and mandate assumptions around a selected year and material.
- Operational planning: scale supplier due-diligence headcount, supplier risk, recycling mix, and recovery activity with production.
- Procurement strategy: compare supplier footprint, risk, contract adjustment, switching cost, lead time, and target economics.
- Investment / NPV decisions: evaluate risk-adjusted supplier switching and closed-loop recycling economics using discounted cash-flow logic.
- Management reporting: use the executive and compliance dashboards for concise KPI, trend, bridge, and risk communication.
👥 Intended Users
Designed for battery manufacturers, EV OEM finance and procurement teams, stationary-storage developers, corporate finance and FP&A teams, sustainability/ESG functions, supply-chain and compliance teams, consultants, transaction advisers, and investors evaluating battery-economics exposure. It is especially useful when users want one Excel framework that connects technical battery inputs to financial outcomes without macros.
📦 Delivered Files
- One Excel `.xlsx` workbook with 24 worksheets and illustrative sample data.
- One 24-page full-sheet PDF preview with one clean page per worksheet.
The workbook is formula-driven, USD-based, and uses editable inputs throughout the core operating and compliance engines. Replace the illustrative assumptions with your own battery chemistry, supplier, pricing, regulatory, recovery, and commercial data to tailor the outputs to a specific program or organization.
Similar ProductsOther customers were also interested in...



 eFinancialModels
Electric Vehicle (EV) Charging Station Financial M...
With this comprehensive 5- or 10-year monthly tool, investors can assess the viability of setting up... Read more

Financial Model for Mobile App | Mobile App Busine...
The Mobile App Financial Plan Template in Excel allows you to develop financial projections when lau... Read more

 HenrySheykin
Food Truck Financial Model Excel Template
The Food Truck Financial Model helps entrepreneurs, founders, business owners, consultants, and anal... Read more

Green Hydrogen Production from Wind Energy Financi...
The Green Hydrogen from Wind Financial Model aims to comprehensively forecast a horizon of 40 years ... Read more

Simple Mutual Non-Disclosure Agreement Template
Protect your business secrets with ease using our Simple Mutual Non-Disclosure Agreement Template. S... Read more

Solar Energy Financial Model
The Solar Energy Financial Model Spreadsheet Template in Excel assists you in preparing a sophistica... Read more

 Peter Graf
The Customer-Centric Financial Model for Restauran...
Starting a restaurant without a financial plan is like driving a car blindfolded. You wouldn´t do i... Read more
You must log in to submit a review.