
0 ITEMS

Business Development Company (BDC) NAV, NII, Dividend Coverage & Leverage Financial Model – 5-Year Forecast
A Business Development Company can report attractive investment yields and still create a weak shareholder outcome if deployment runs ahead of funding capacity, non-accruals rise, fair-value marks reduce NAV, interest expense absorbs incremental income, or dividends grow faster than recurring NII. This Excel model is built to connect those moving parts in one integrated 20-quarter / 5-year decision framework. The workbook is designed for BDC operators, private-credit and direct-lending teams, finance leaders, portfolio managers, analysts, accountants, consultants, lenders and investors who need to understand how portfolio activity, credit quality, funding and distributions flow through NII, NAV/share, leverage, liquidity and the financial statements.


📊 BDC NAV, NII, Dividend Coverage & Leverage Financial Model
A Business Development Company can report attractive investment yields and still create a weak shareholder outcome if deployment runs ahead of funding capacity, non-accruals rise, fair-value marks reduce NAV, interest expense absorbs incremental income, or dividends grow faster than recurring NII. This Excel model is built to connect those moving parts in one integrated 20-quarter / 5-year decision framework.
The workbook is designed for BDC operators, private-credit and direct-lending teams, finance leaders, portfolio managers, analysts, accountants, consultants, lenders and investors who need to understand how portfolio activity, credit quality, funding and distributions flow through NII, NAV/share, leverage, liquidity and the financial statements.
🎯 What decisions does the model support?
Use the model to answer practical questions such as how much capital can be deployed, whether the current dividend is supported by recurring NII, how credit stress affects NAV, how much leverage headroom remains, whether liquidity is sufficient for unfunded commitments, and how different operating assumptions change shareholder economics over five years.
The integrated model keeps the selected case linked through portfolio schedules, investment income, debt, NAV, cash flow and the headline dashboards, so an assumption change can be reviewed through the full decision chain rather than in an isolated calculator.
🧩 Centralized editable inputs and scenarios
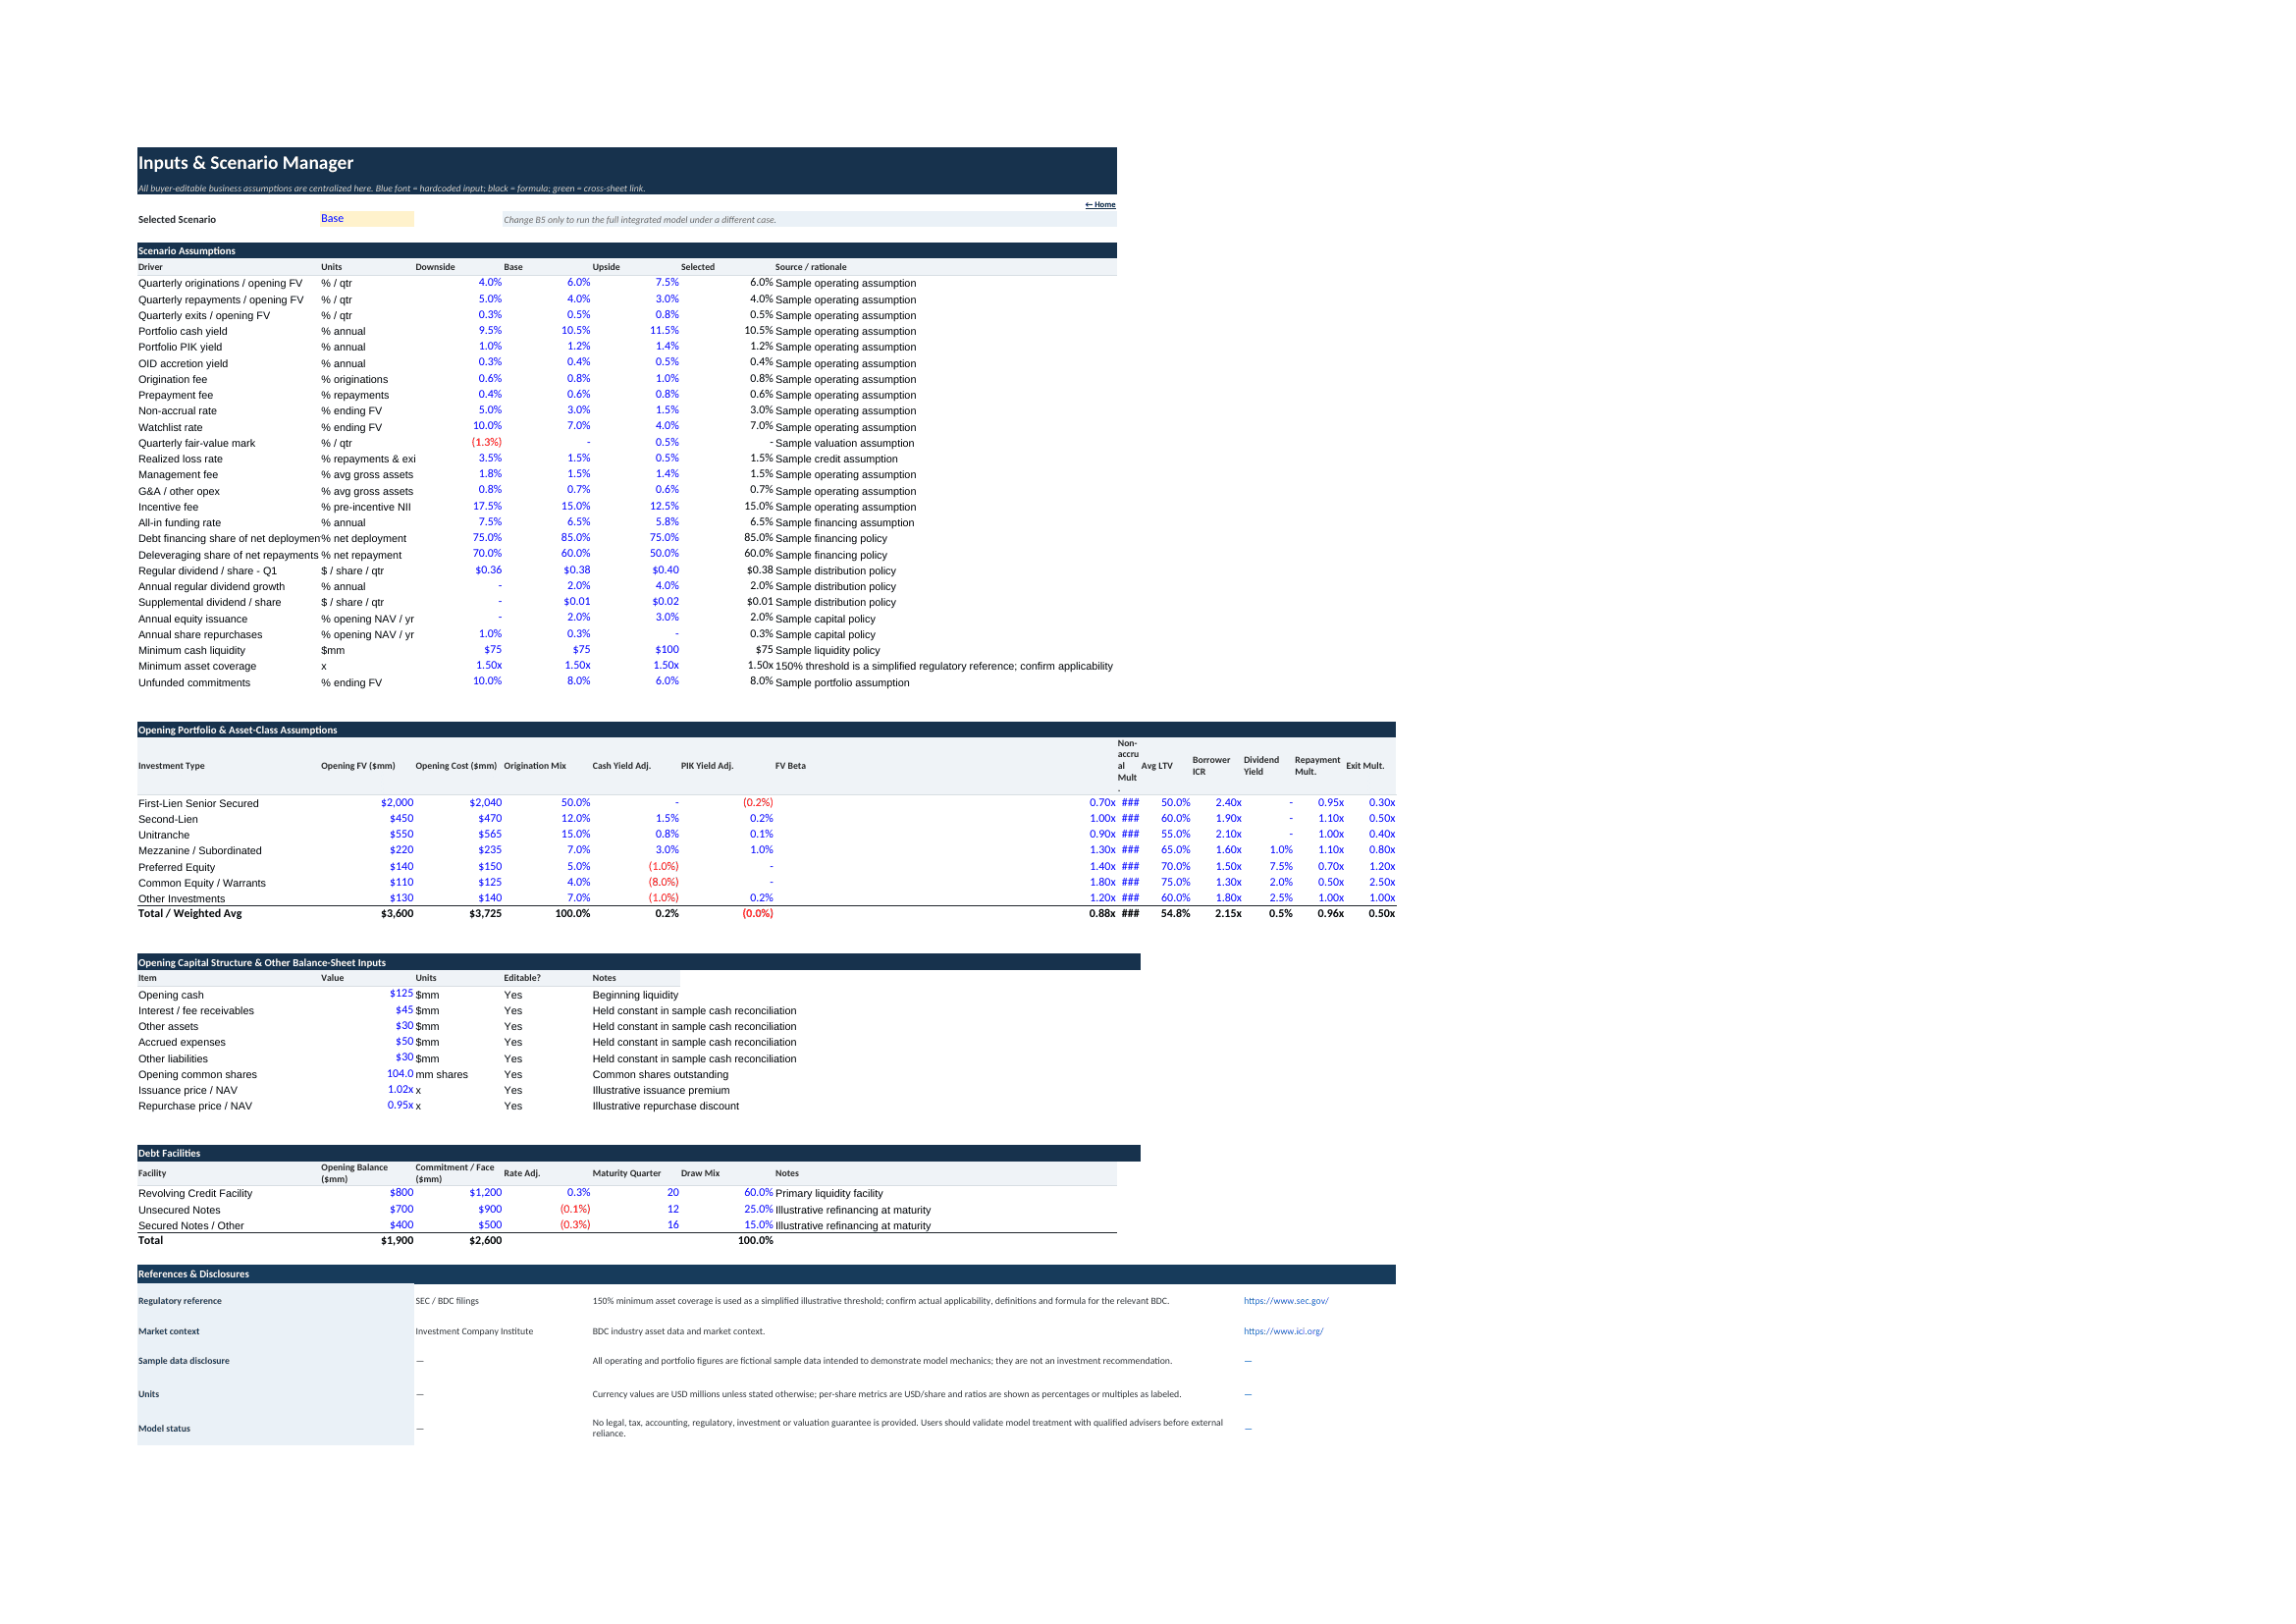
The Inputs & Scenario Manager centralizes the principal buyer-editable assumptions. The workbook includes Downside, Base and Upside cases plus a selected-scenario control. Key drivers include quarterly originations, repayments and exits; cash yield; PIK yield; OID accretion; origination and prepayment fees; non-accrual and watchlist rates; quarterly fair-value marks; realized loss rates; management fee; G&A / other operating expense; incentive fee; all-in funding cost; debt financing share; deleveraging share; regular and supplemental dividends; equity issuance; share repurchases; minimum cash; minimum asset coverage; and unfunded commitments.
Opening portfolio inputs cover seven investment categories: first-lien senior secured, second-lien, unitranche, mezzanine / subordinated, preferred equity, common equity / warrants and other investments. Opening cash, receivables, other assets, liabilities, common shares, issuance / repurchase pricing assumptions and three debt facilities are also included.
⚙️ Integrated operating and financial calculations
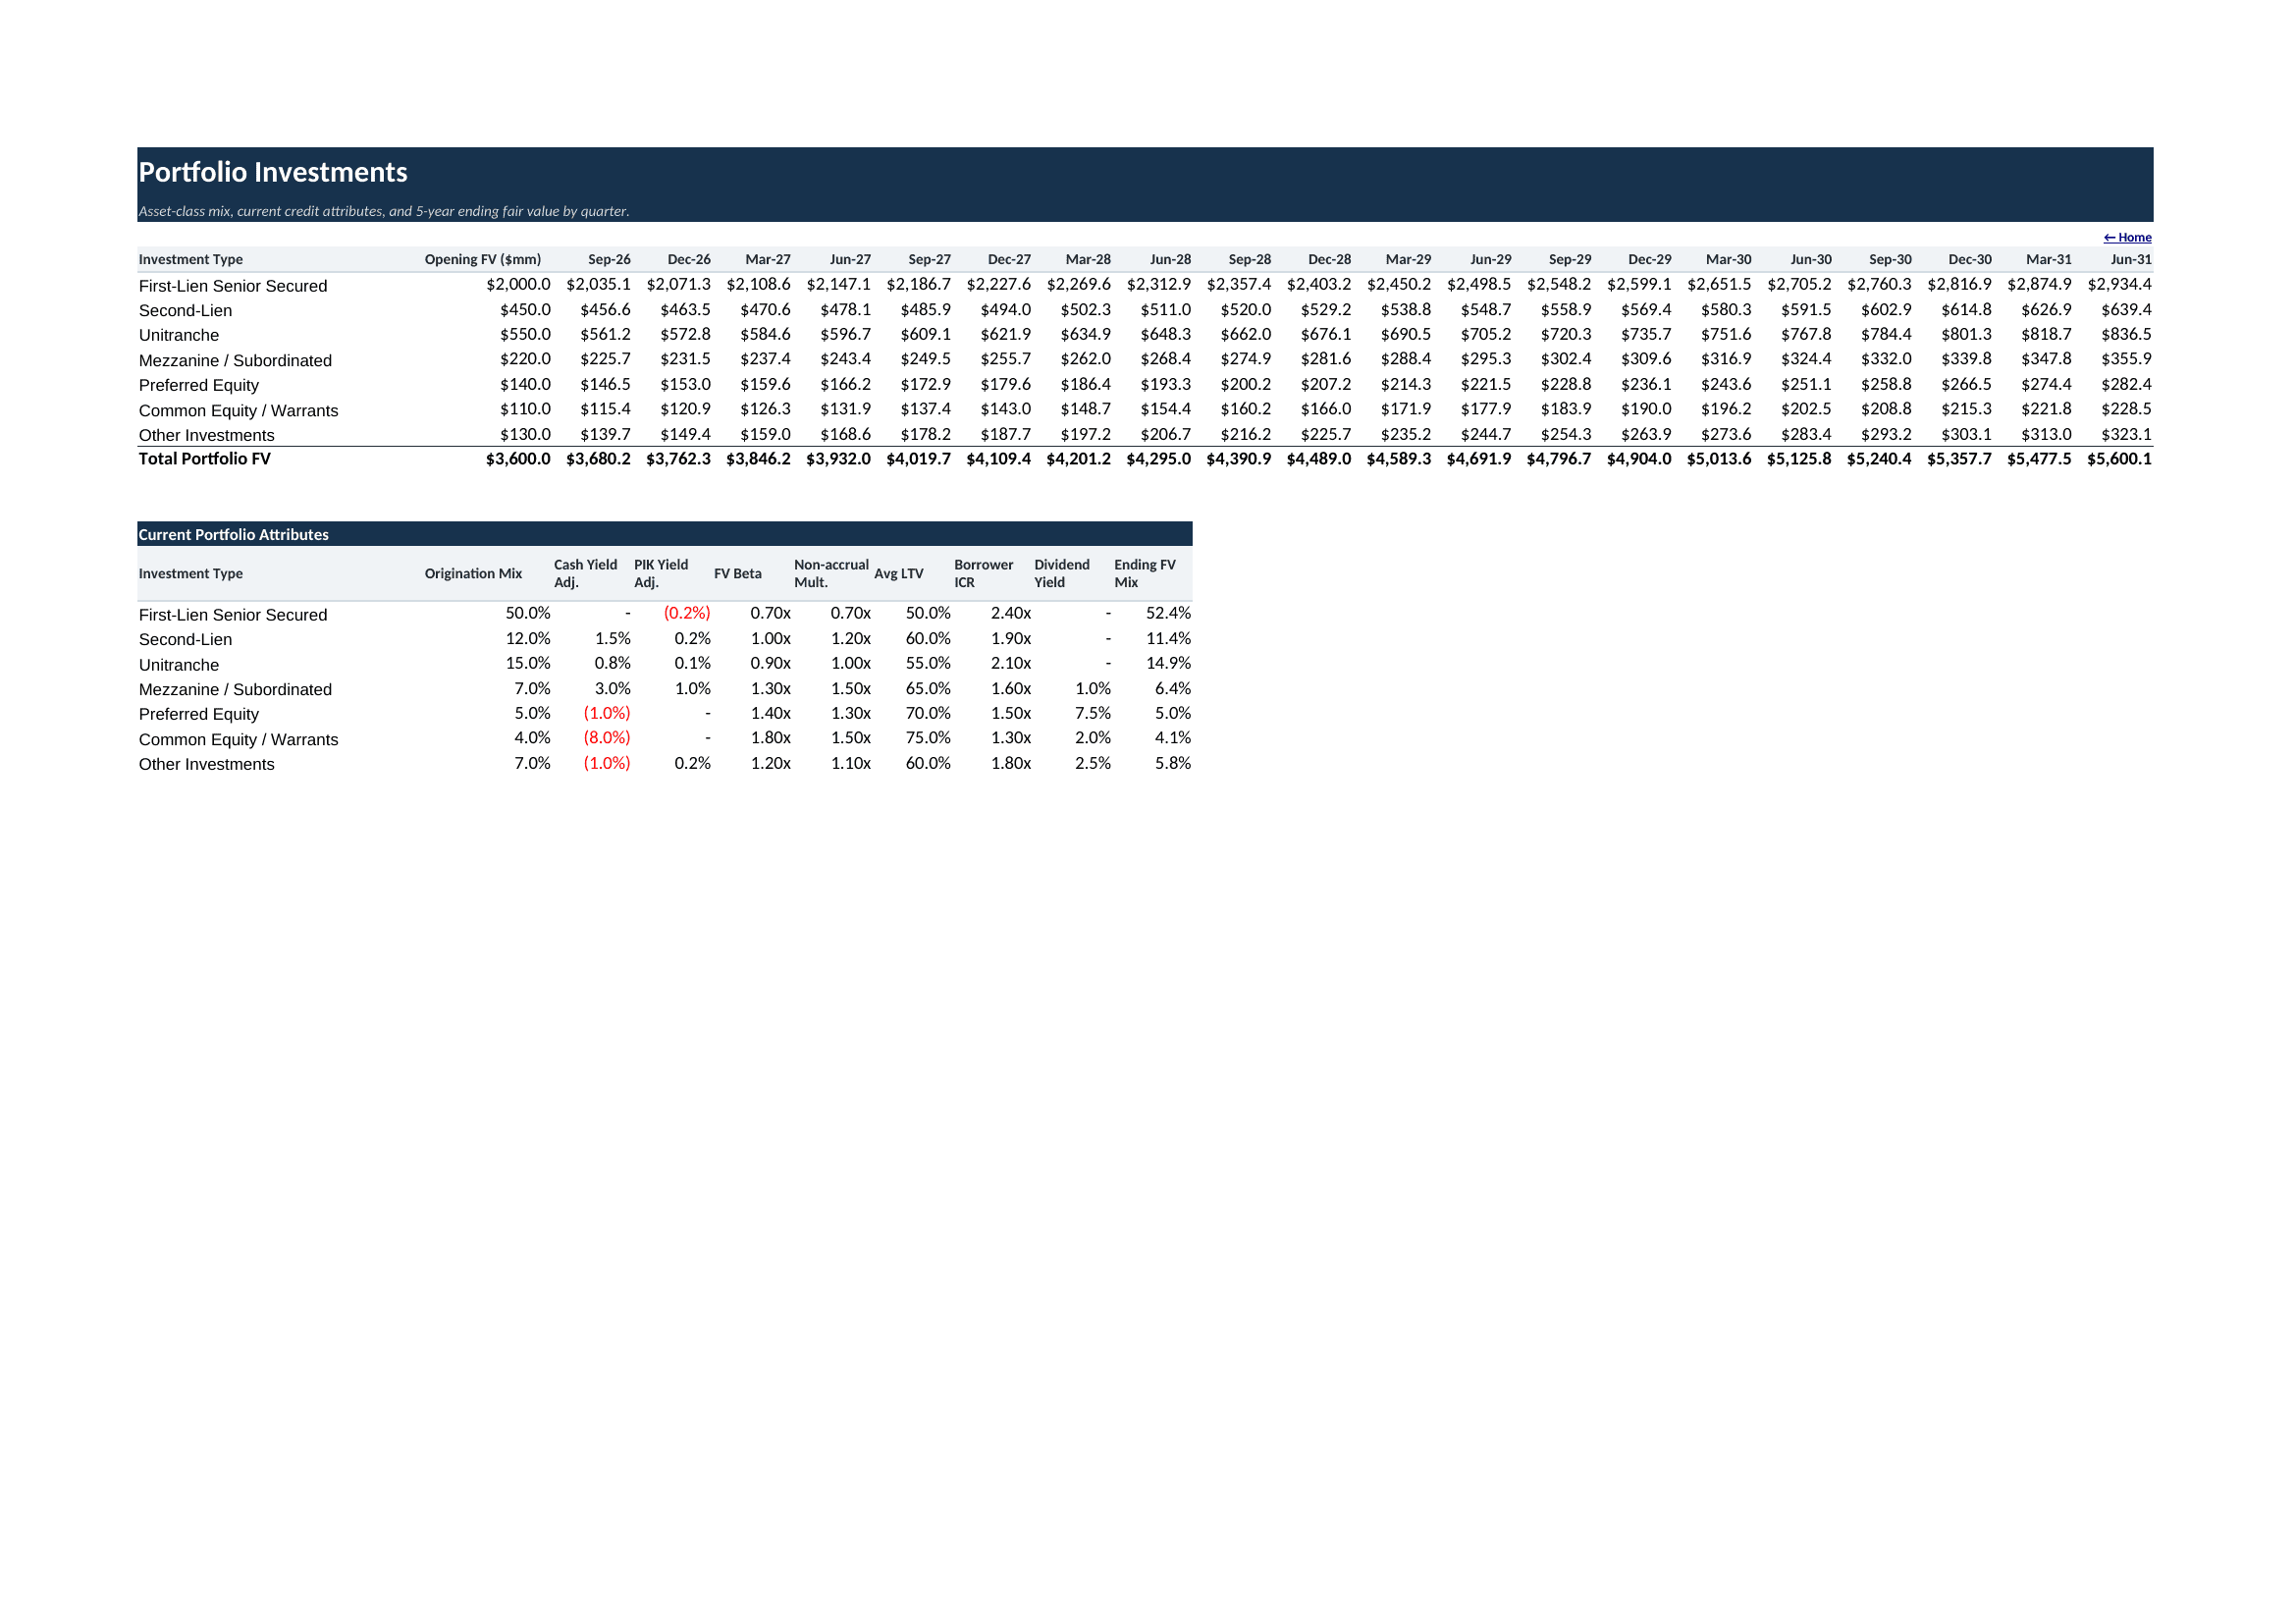
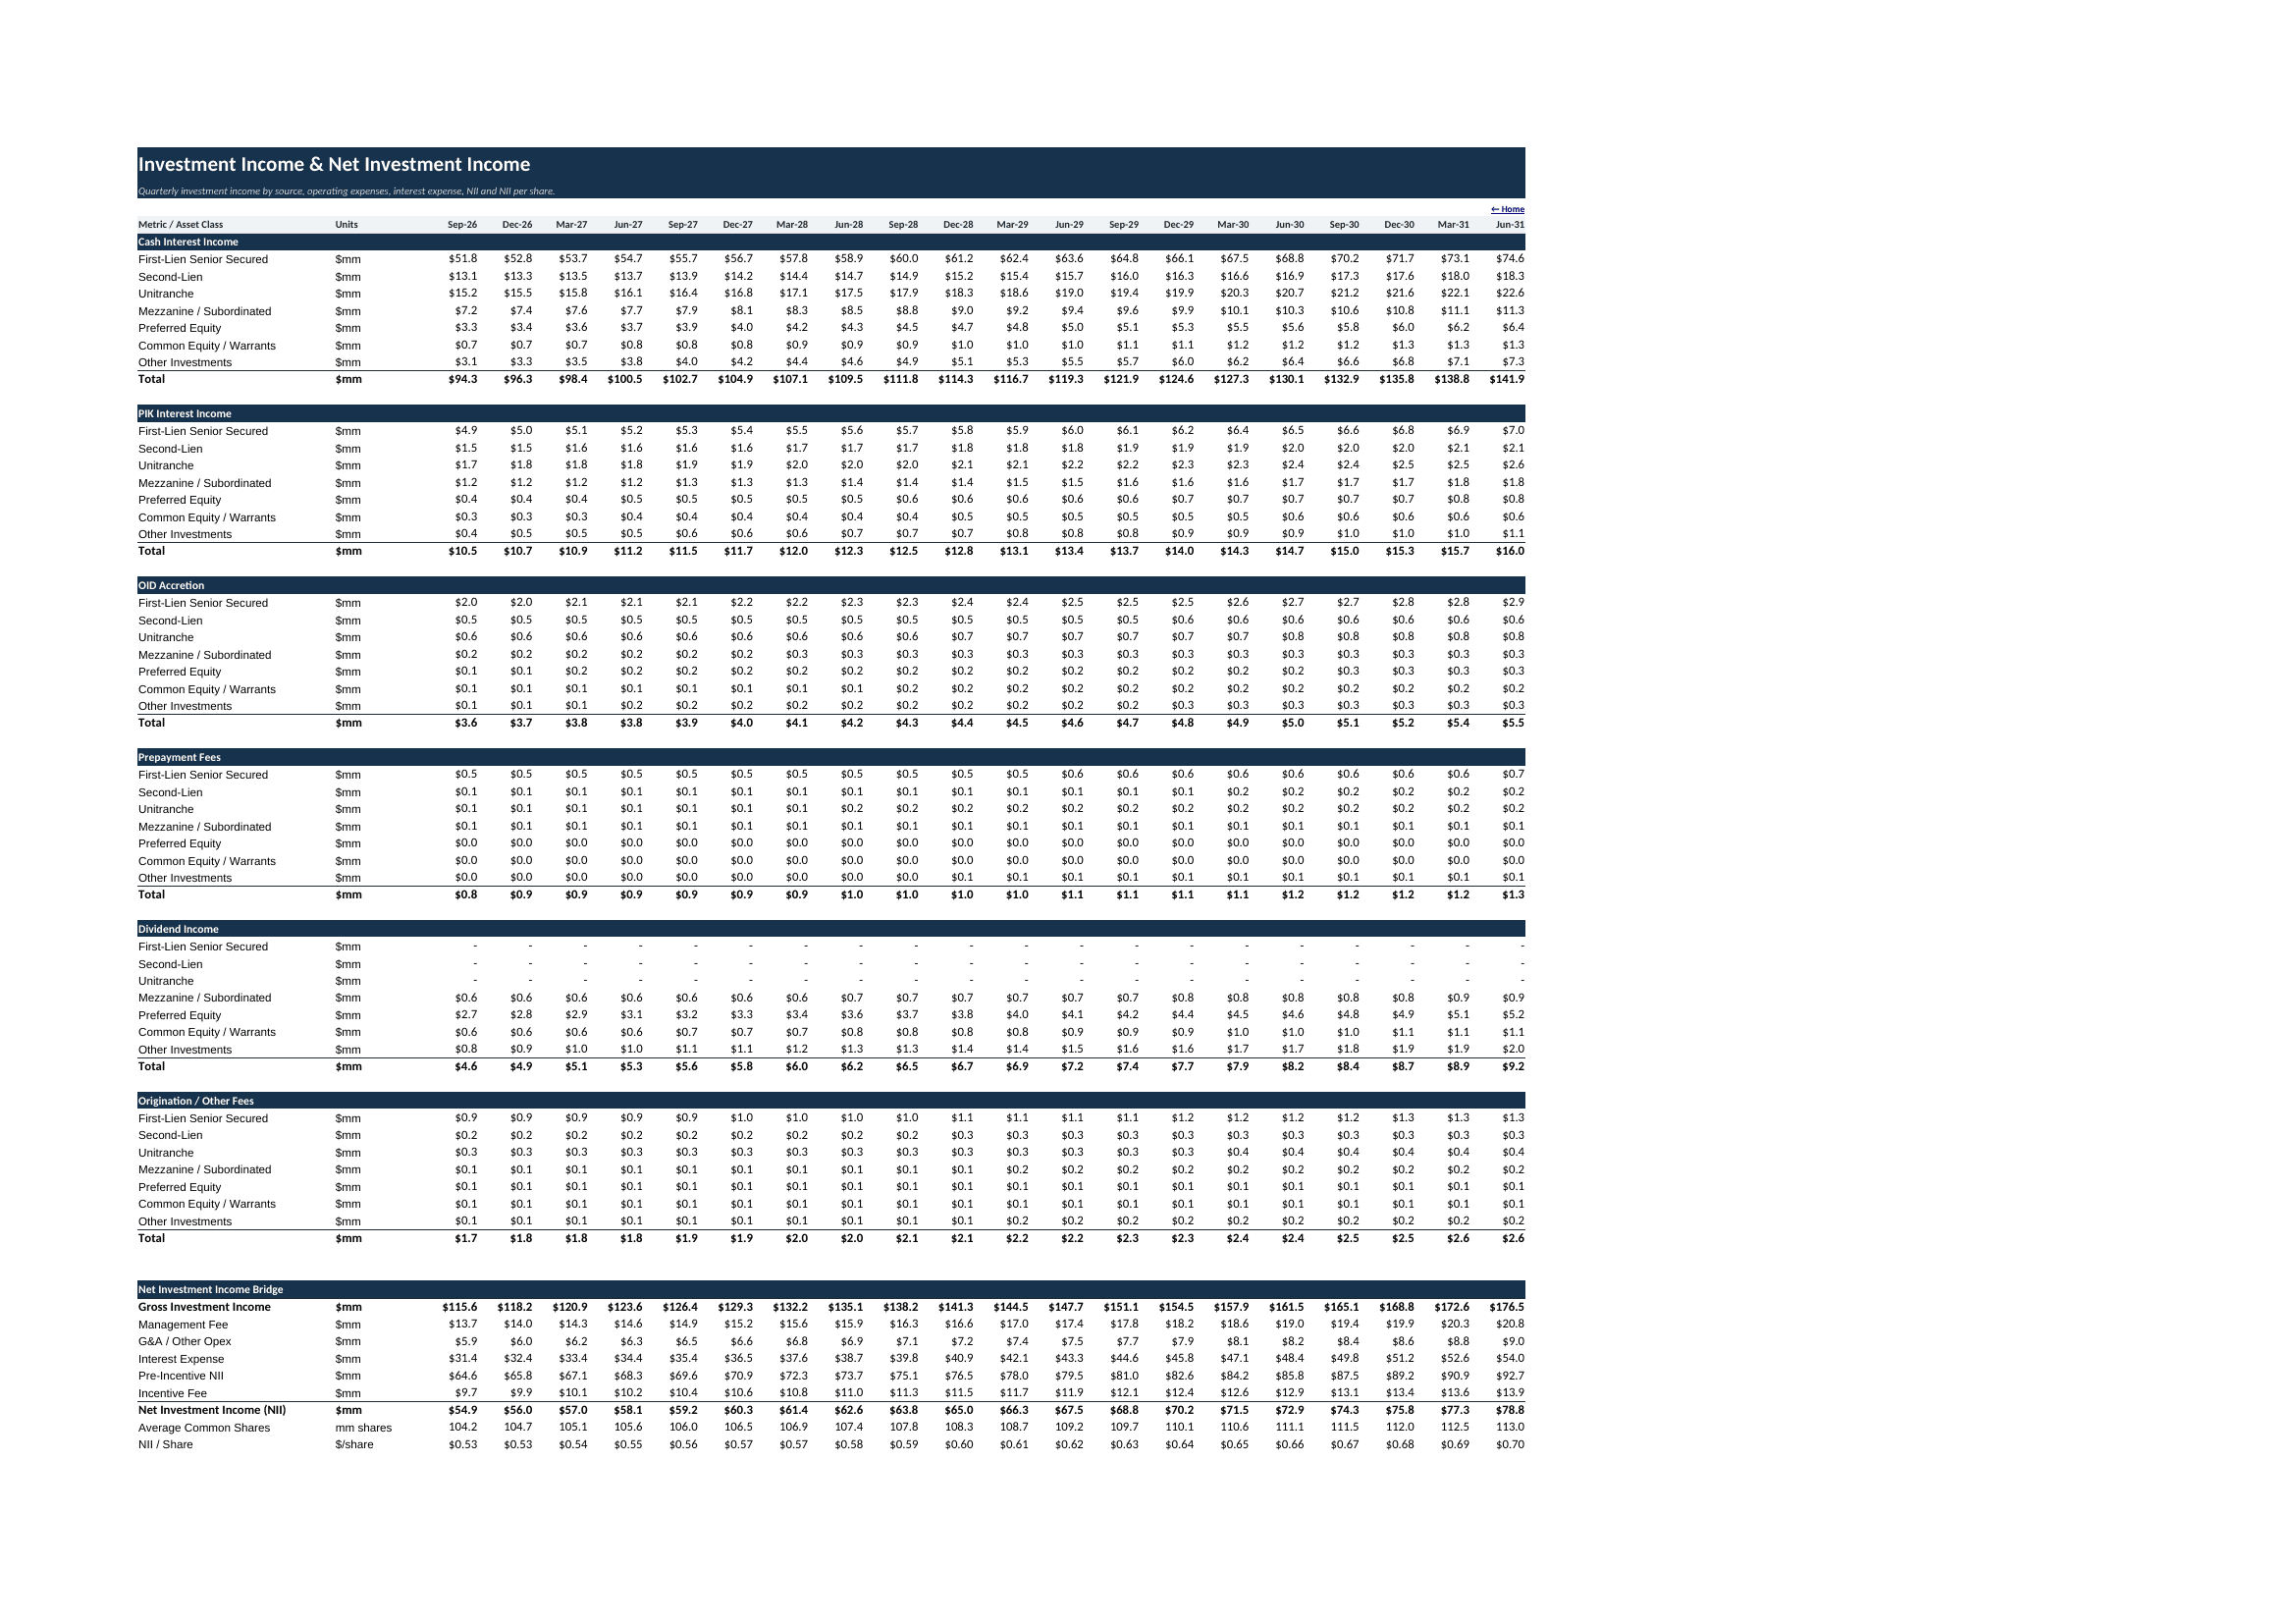
The model rolls portfolio fair value and amortized cost forward across 20 quarters, reflecting originations, repayments, exits, PIK, OID and realized losses. Investment income is built from cash interest, PIK interest, OID accretion, prepayment fees, dividend income and origination / other fees. The NII bridge then deducts management fees, G&A / other operating costs, interest expense and incentive fees to calculate quarterly NII and NII/share.
Fair-value and credit schedules track unrealized gains / losses, non-accrual fair value, watchlist exposure and performing exposure. Portfolio KPIs include non-accrual %, watchlist %, performing %, weighted average LTV, weighted average borrower ICR, weighted average cash yield and weighted average portfolio fair-value beta.
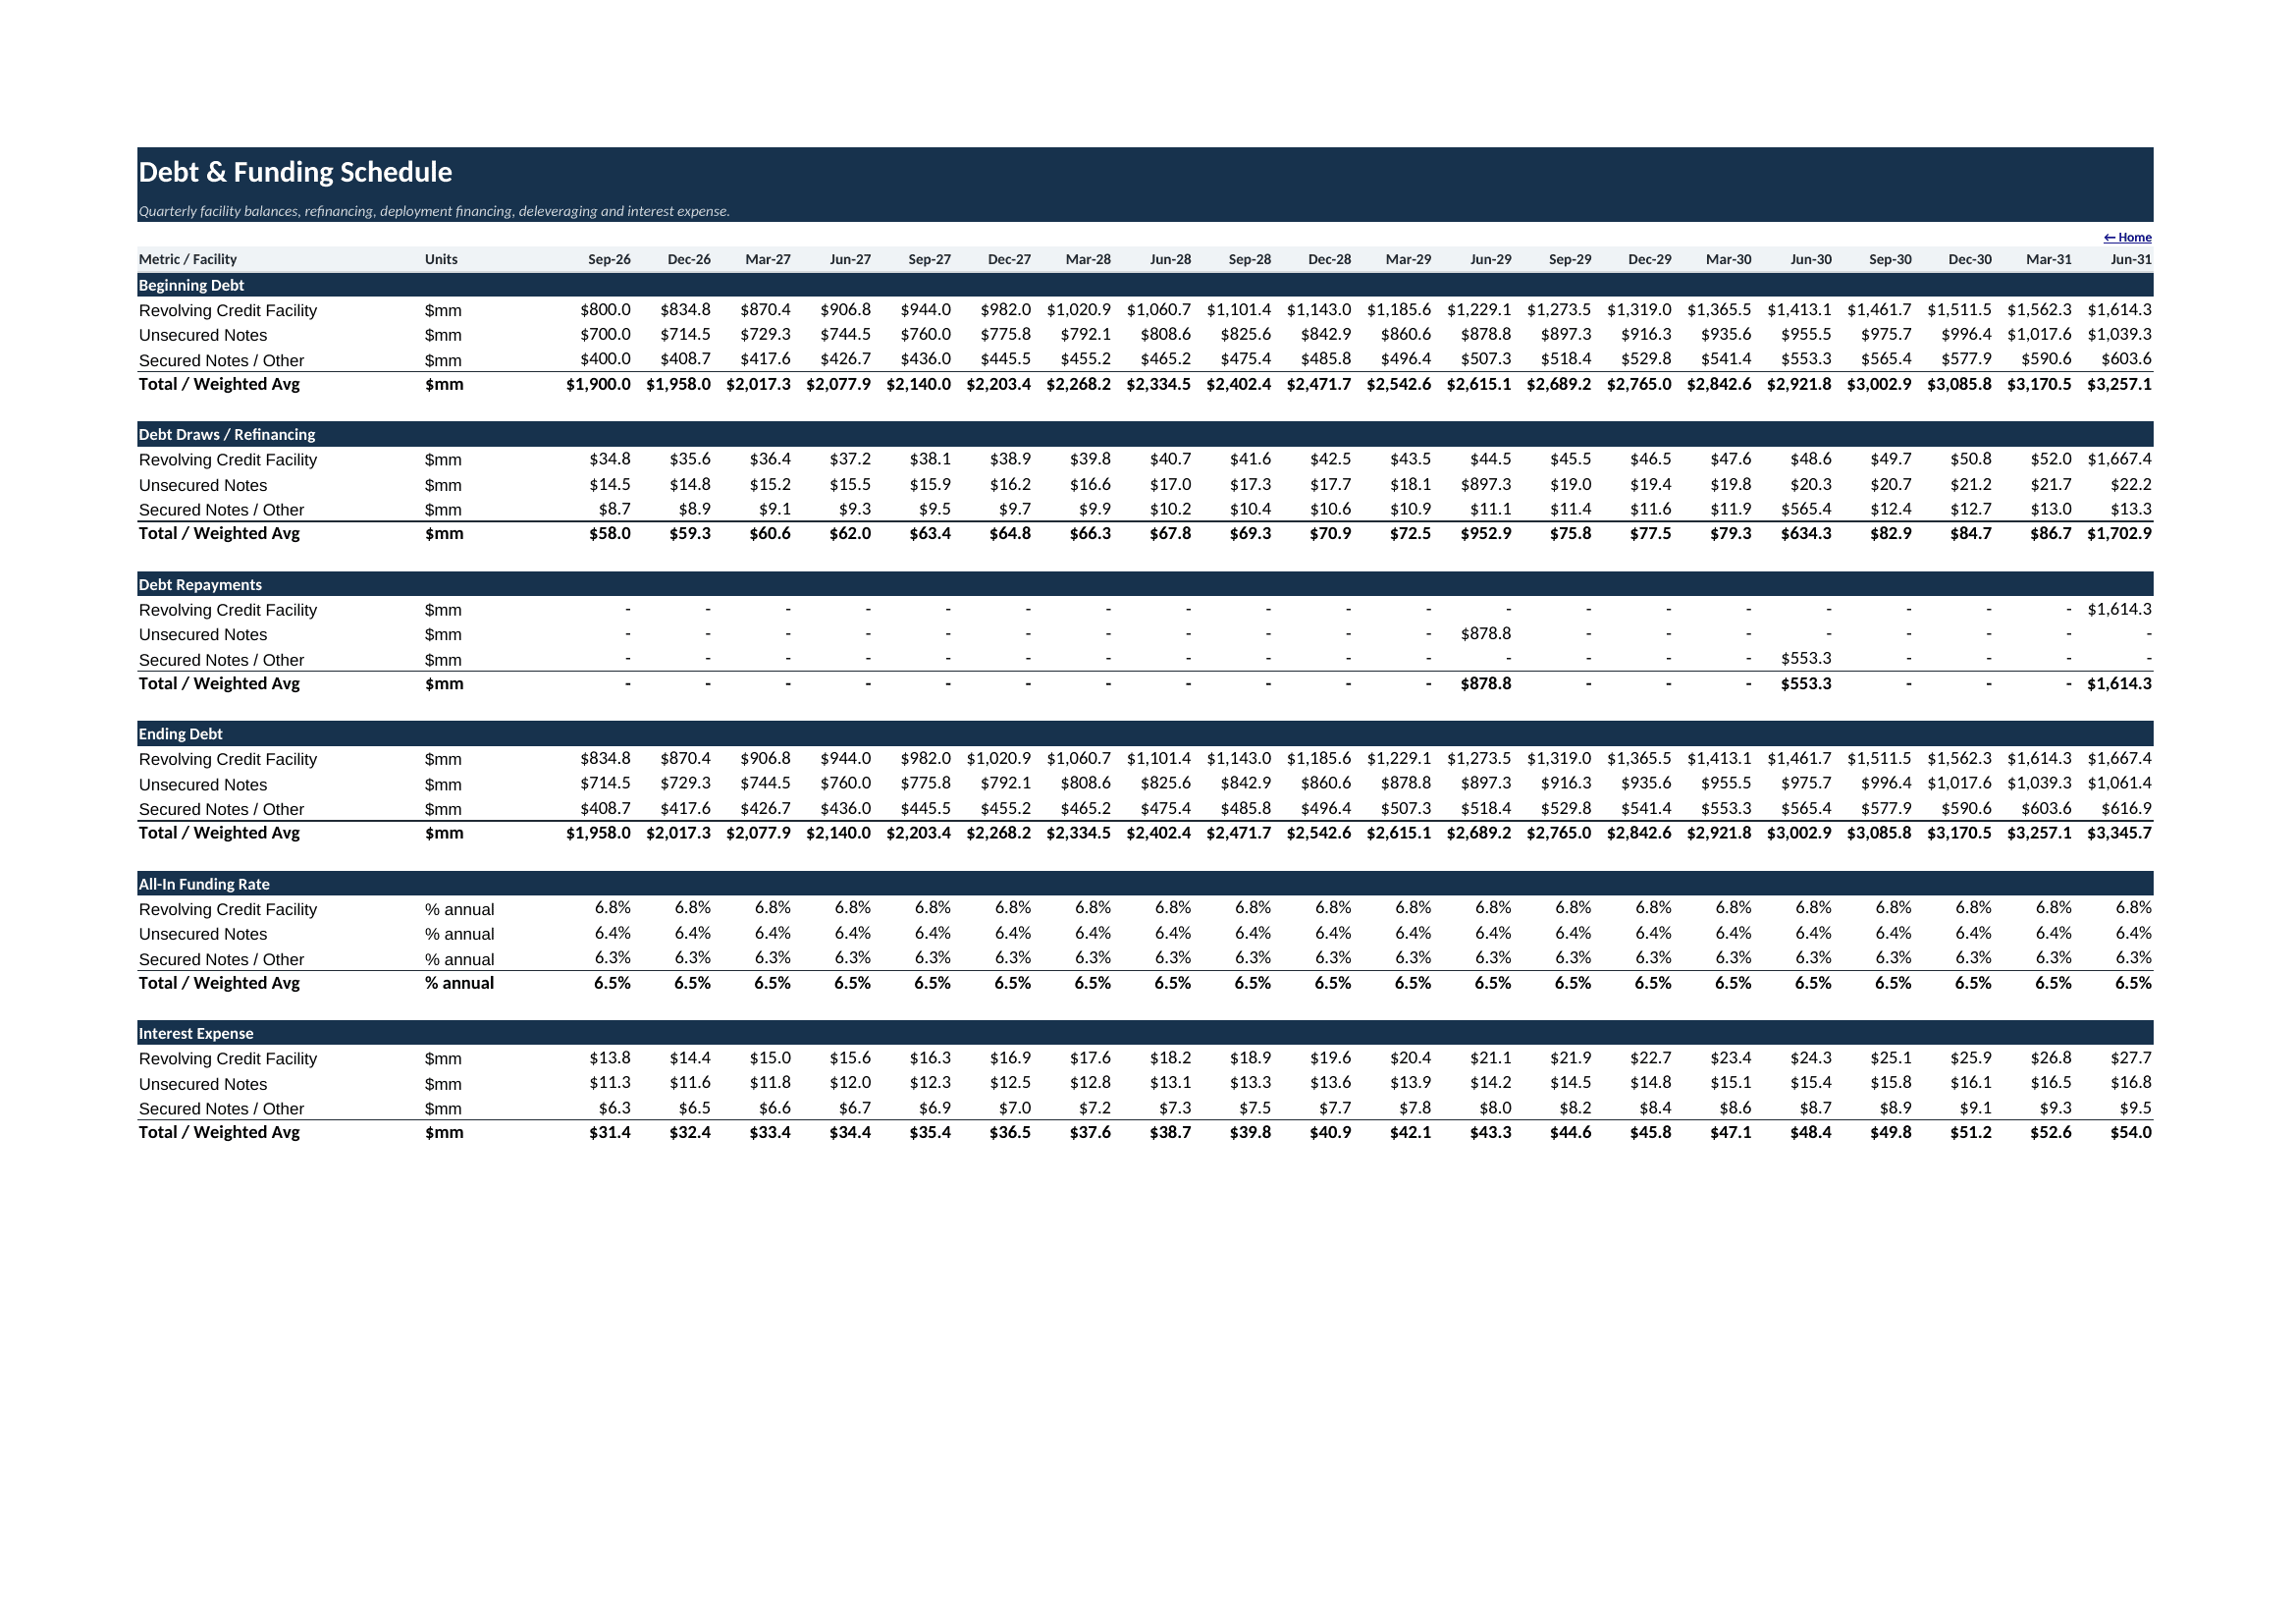
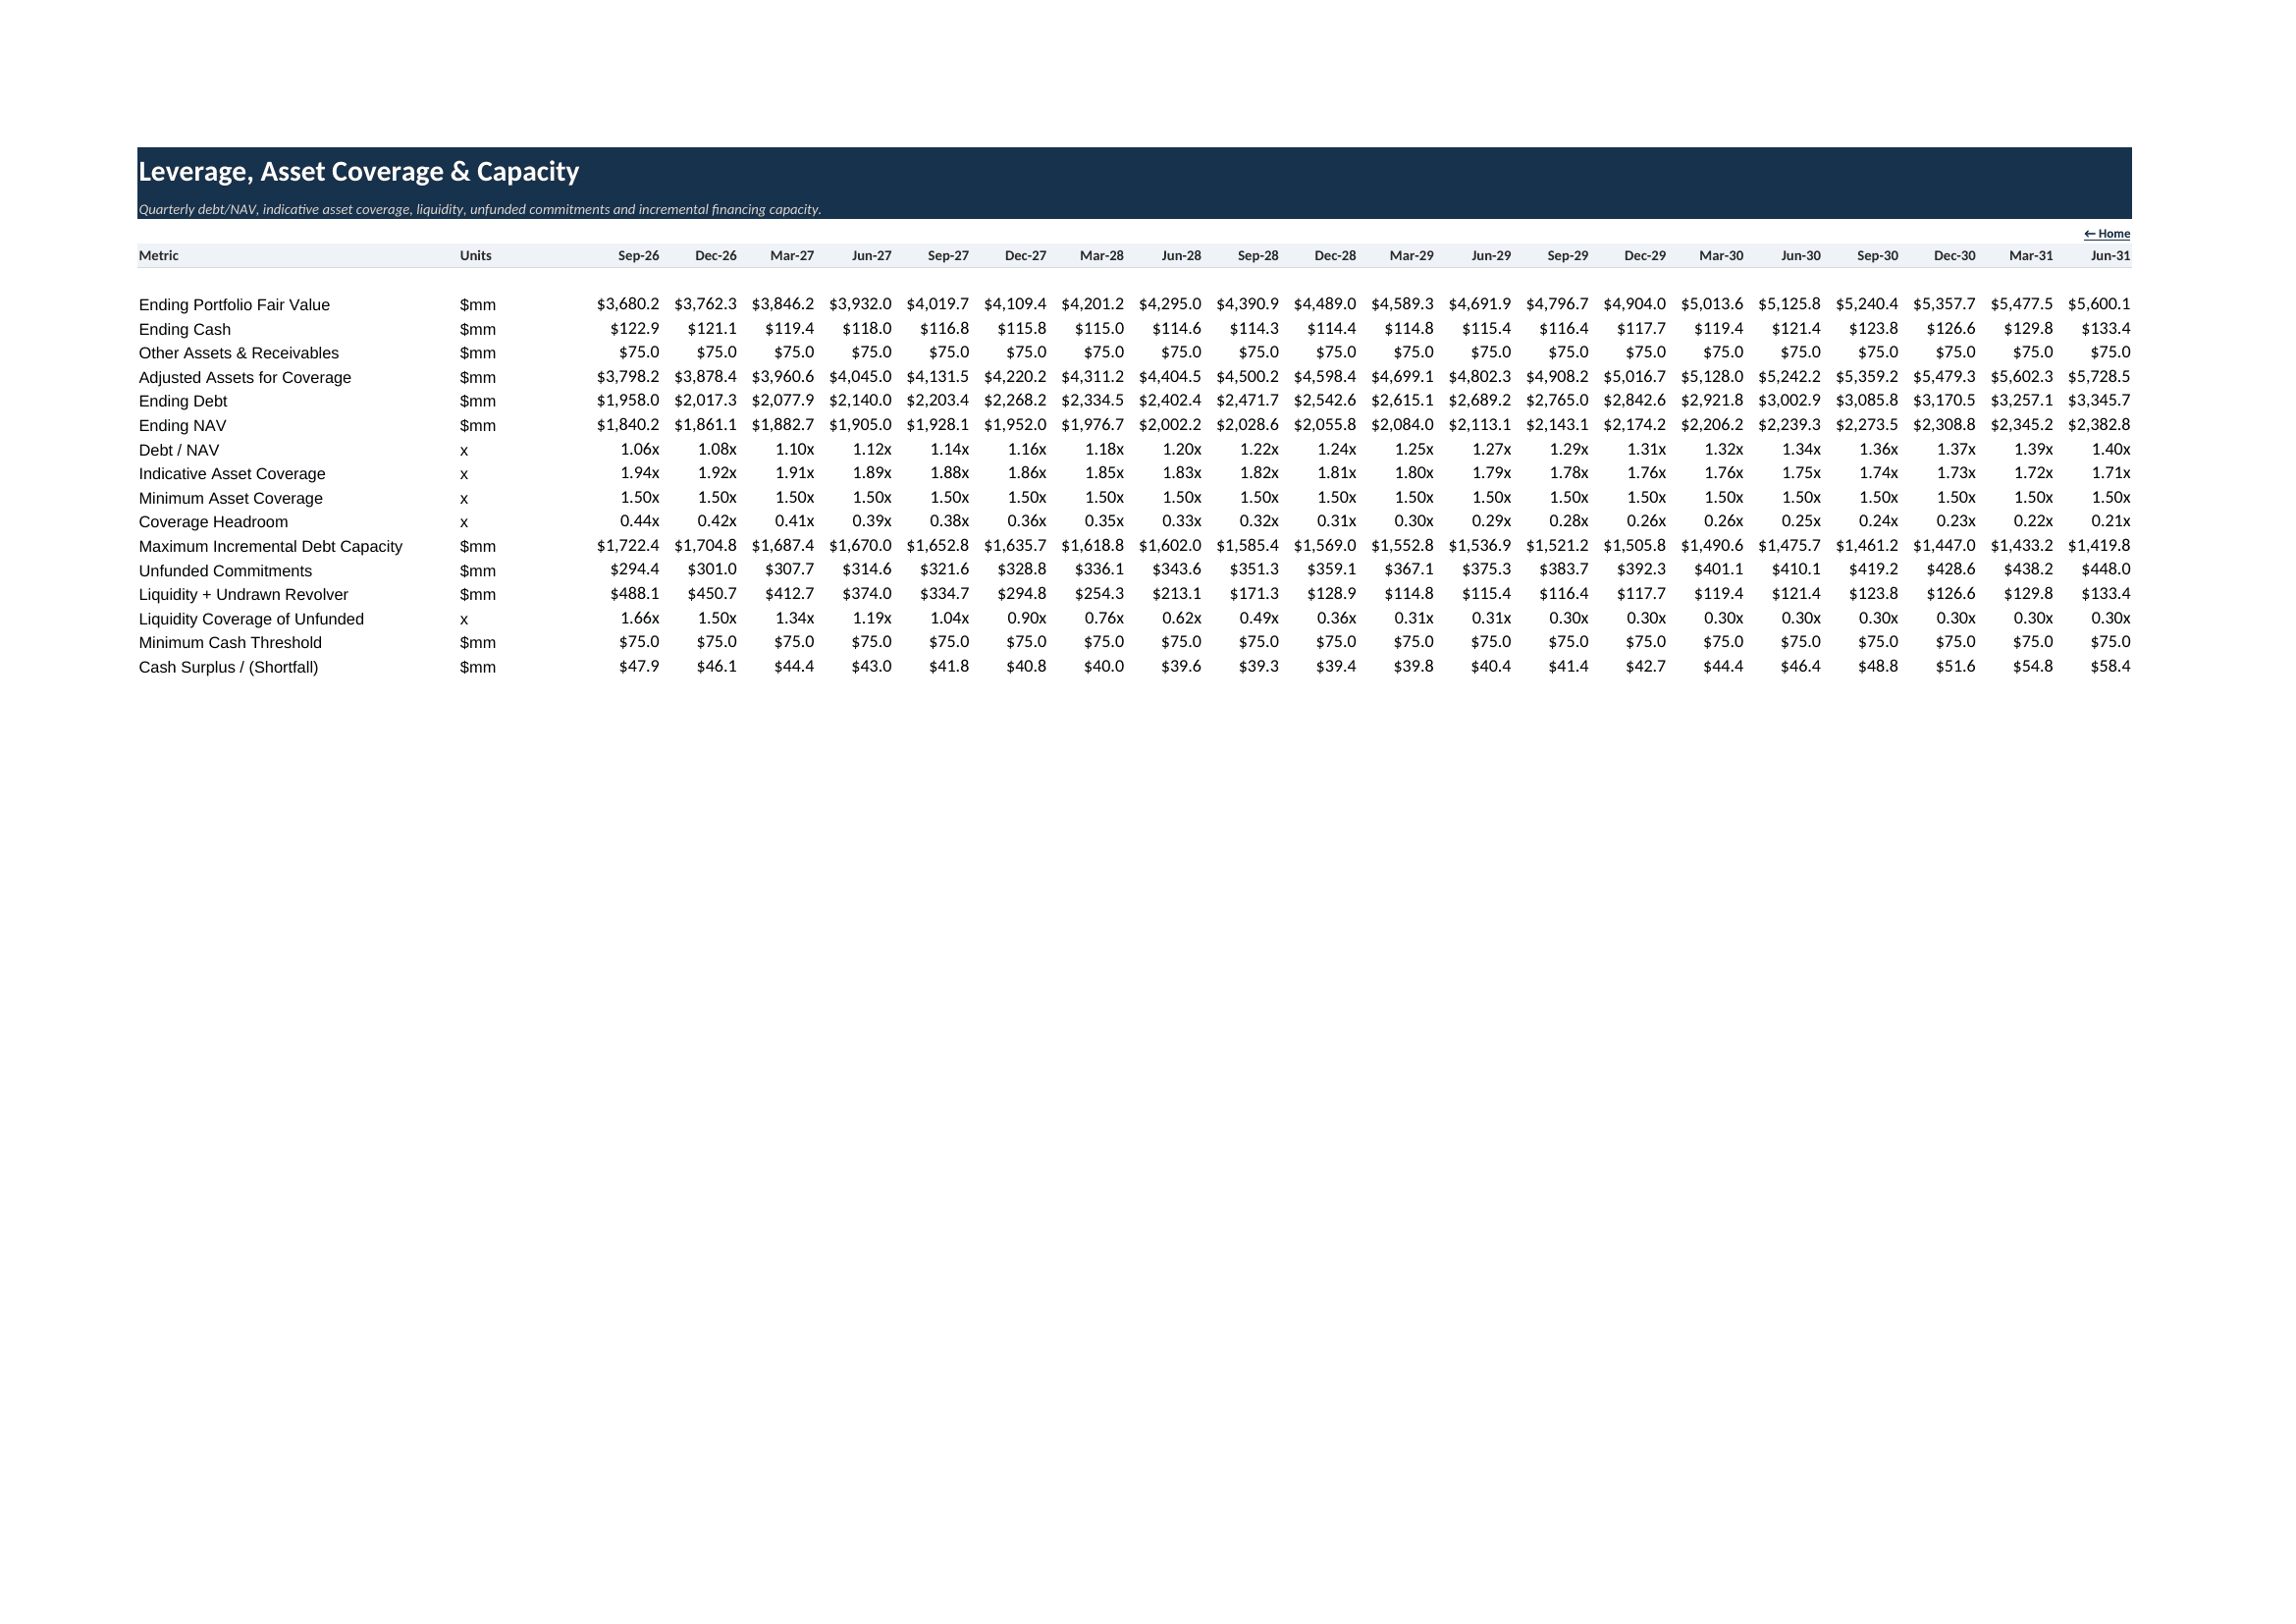
The debt engine includes a revolving credit facility, unsecured notes and secured / other debt. It tracks beginning debt, draws / refinancing, repayments, ending debt, facility funding rates and interest expense. The leverage schedule calculates Debt/NAV, indicative asset coverage, coverage headroom, maximum incremental debt capacity, unfunded commitments, liquidity plus undrawn revolver, liquidity coverage of unfunded commitments, minimum cash and cash surplus / shortfall.
💵 NAV, dividends, statements and five-year forecast
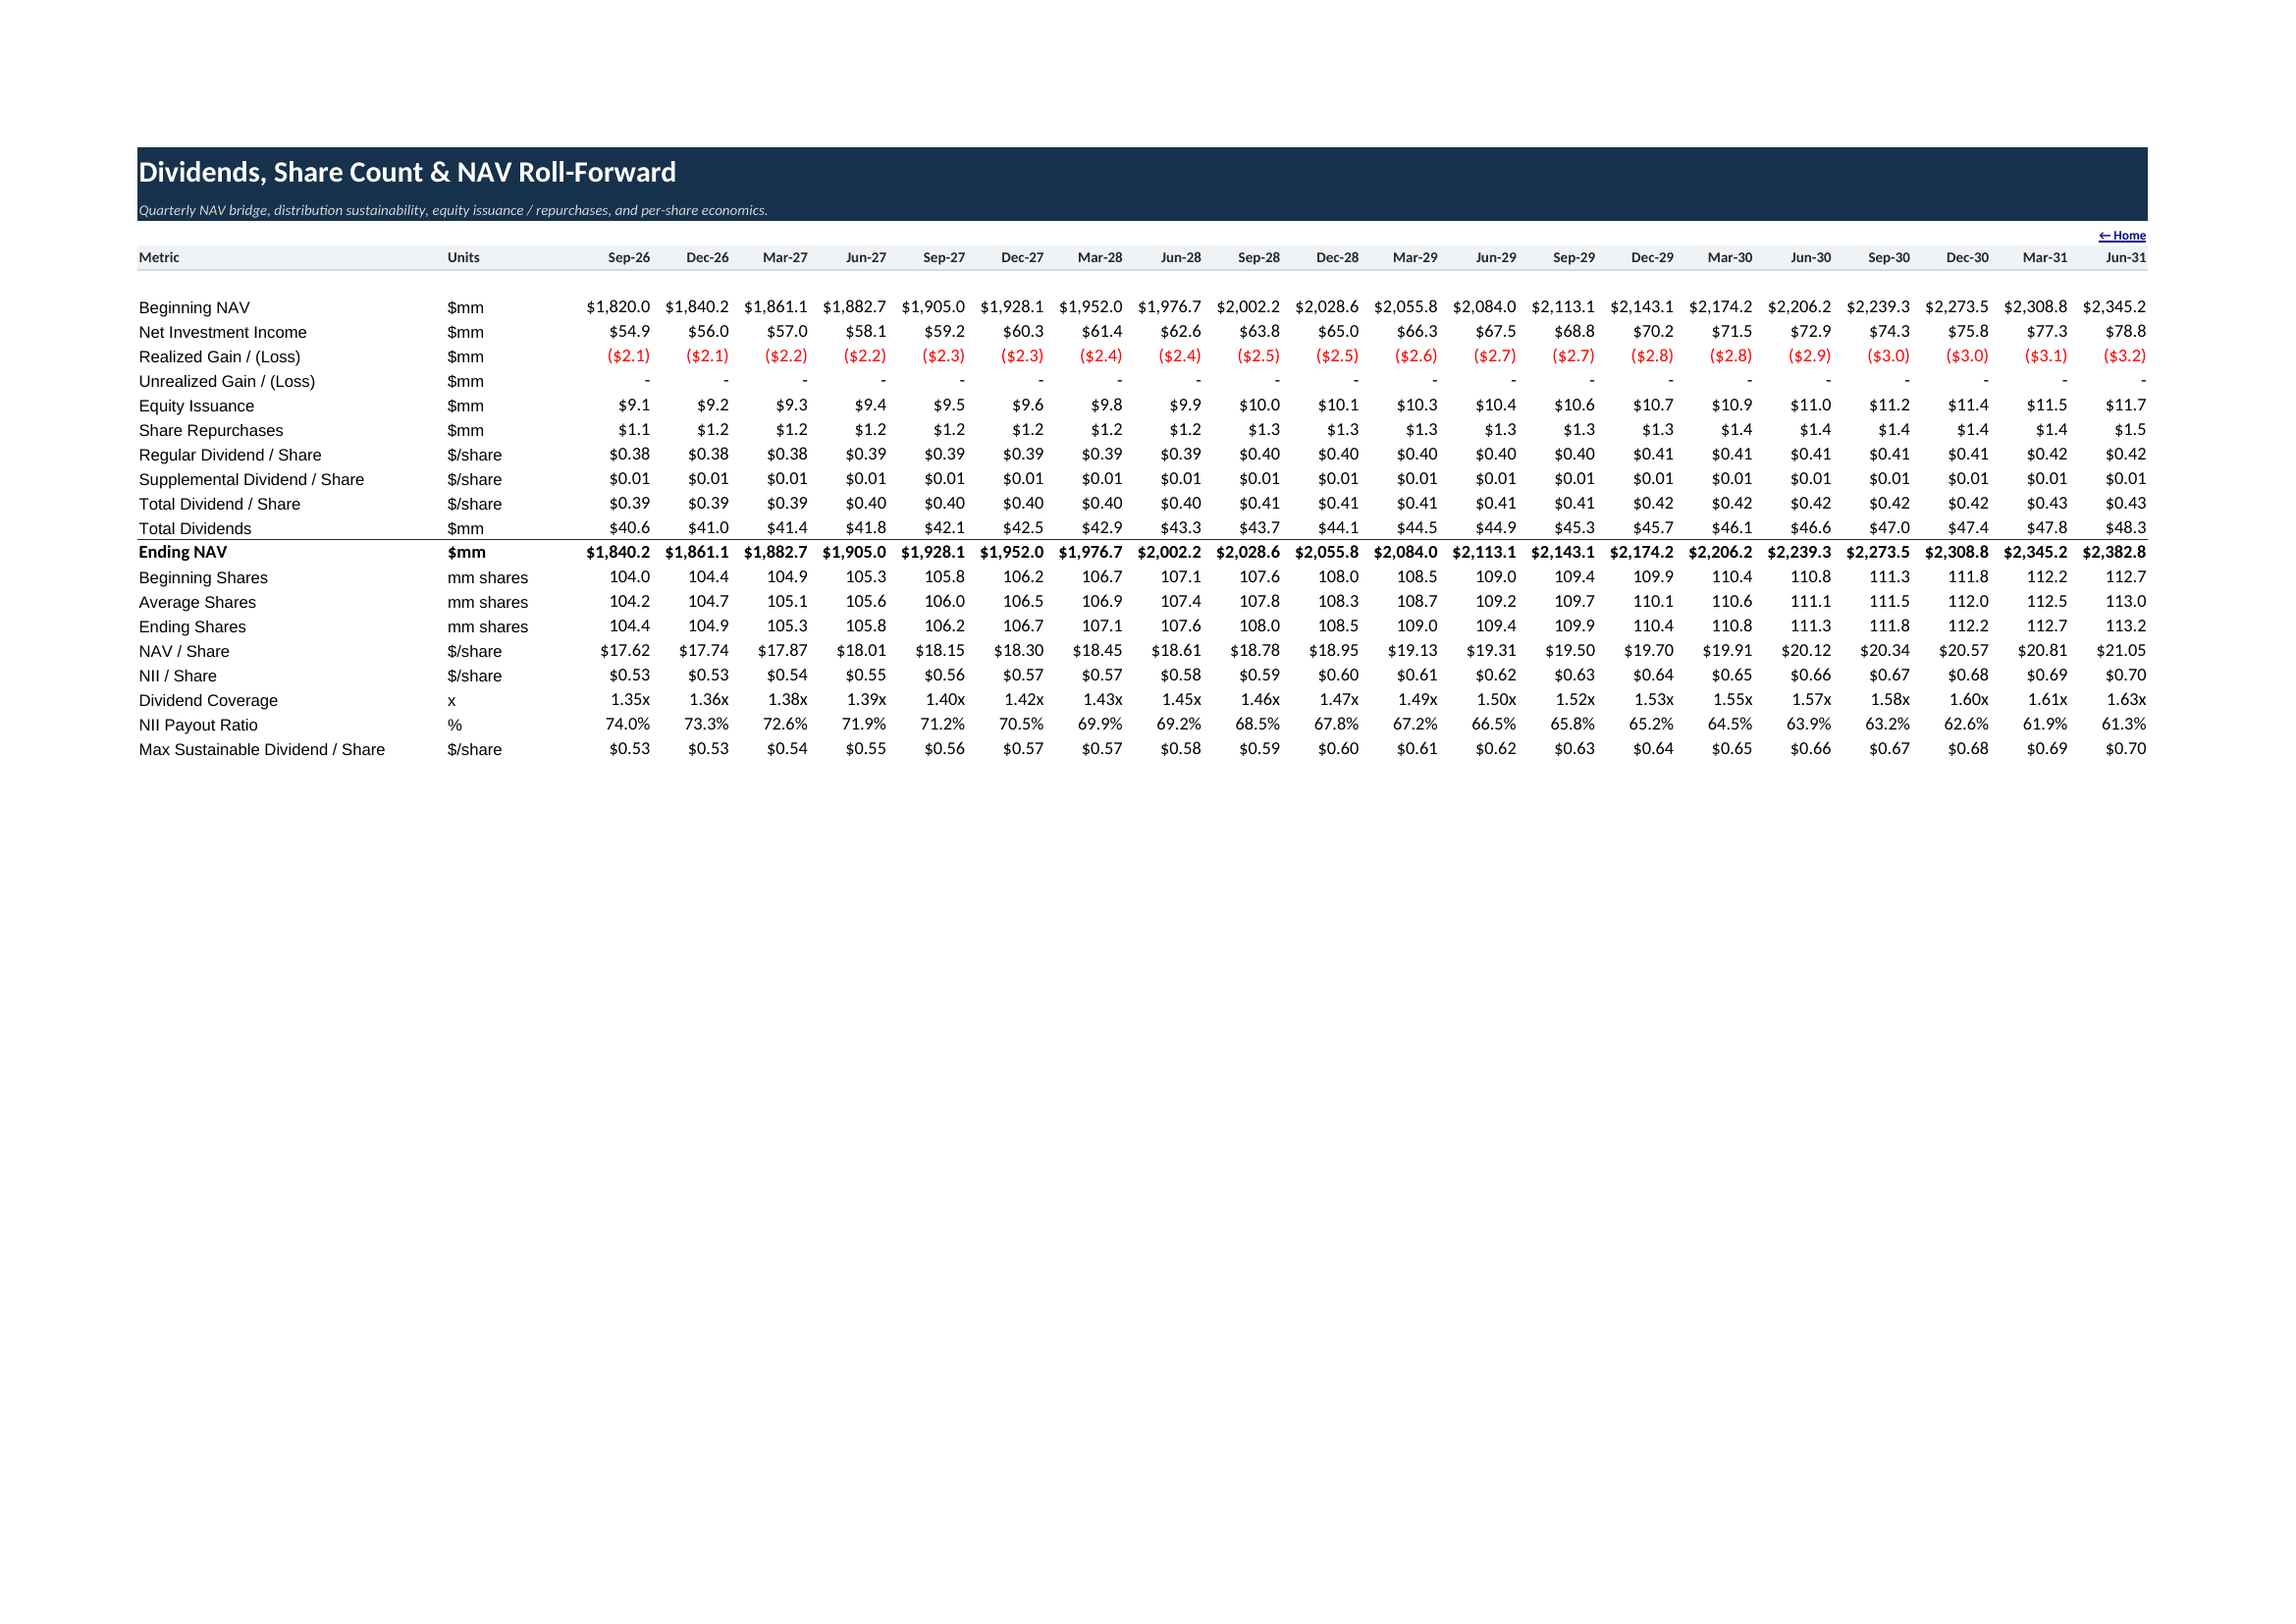
The Dividends & NAV schedule connects NII, realized and unrealized gains / losses, equity issuance, share repurchases and distributions to ending NAV and NAV/share. It also calculates regular dividend/share, supplemental dividend/share, total dividends, ending shares, NII/share, dividend coverage, NII payout ratio and maximum sustainable dividend/share.
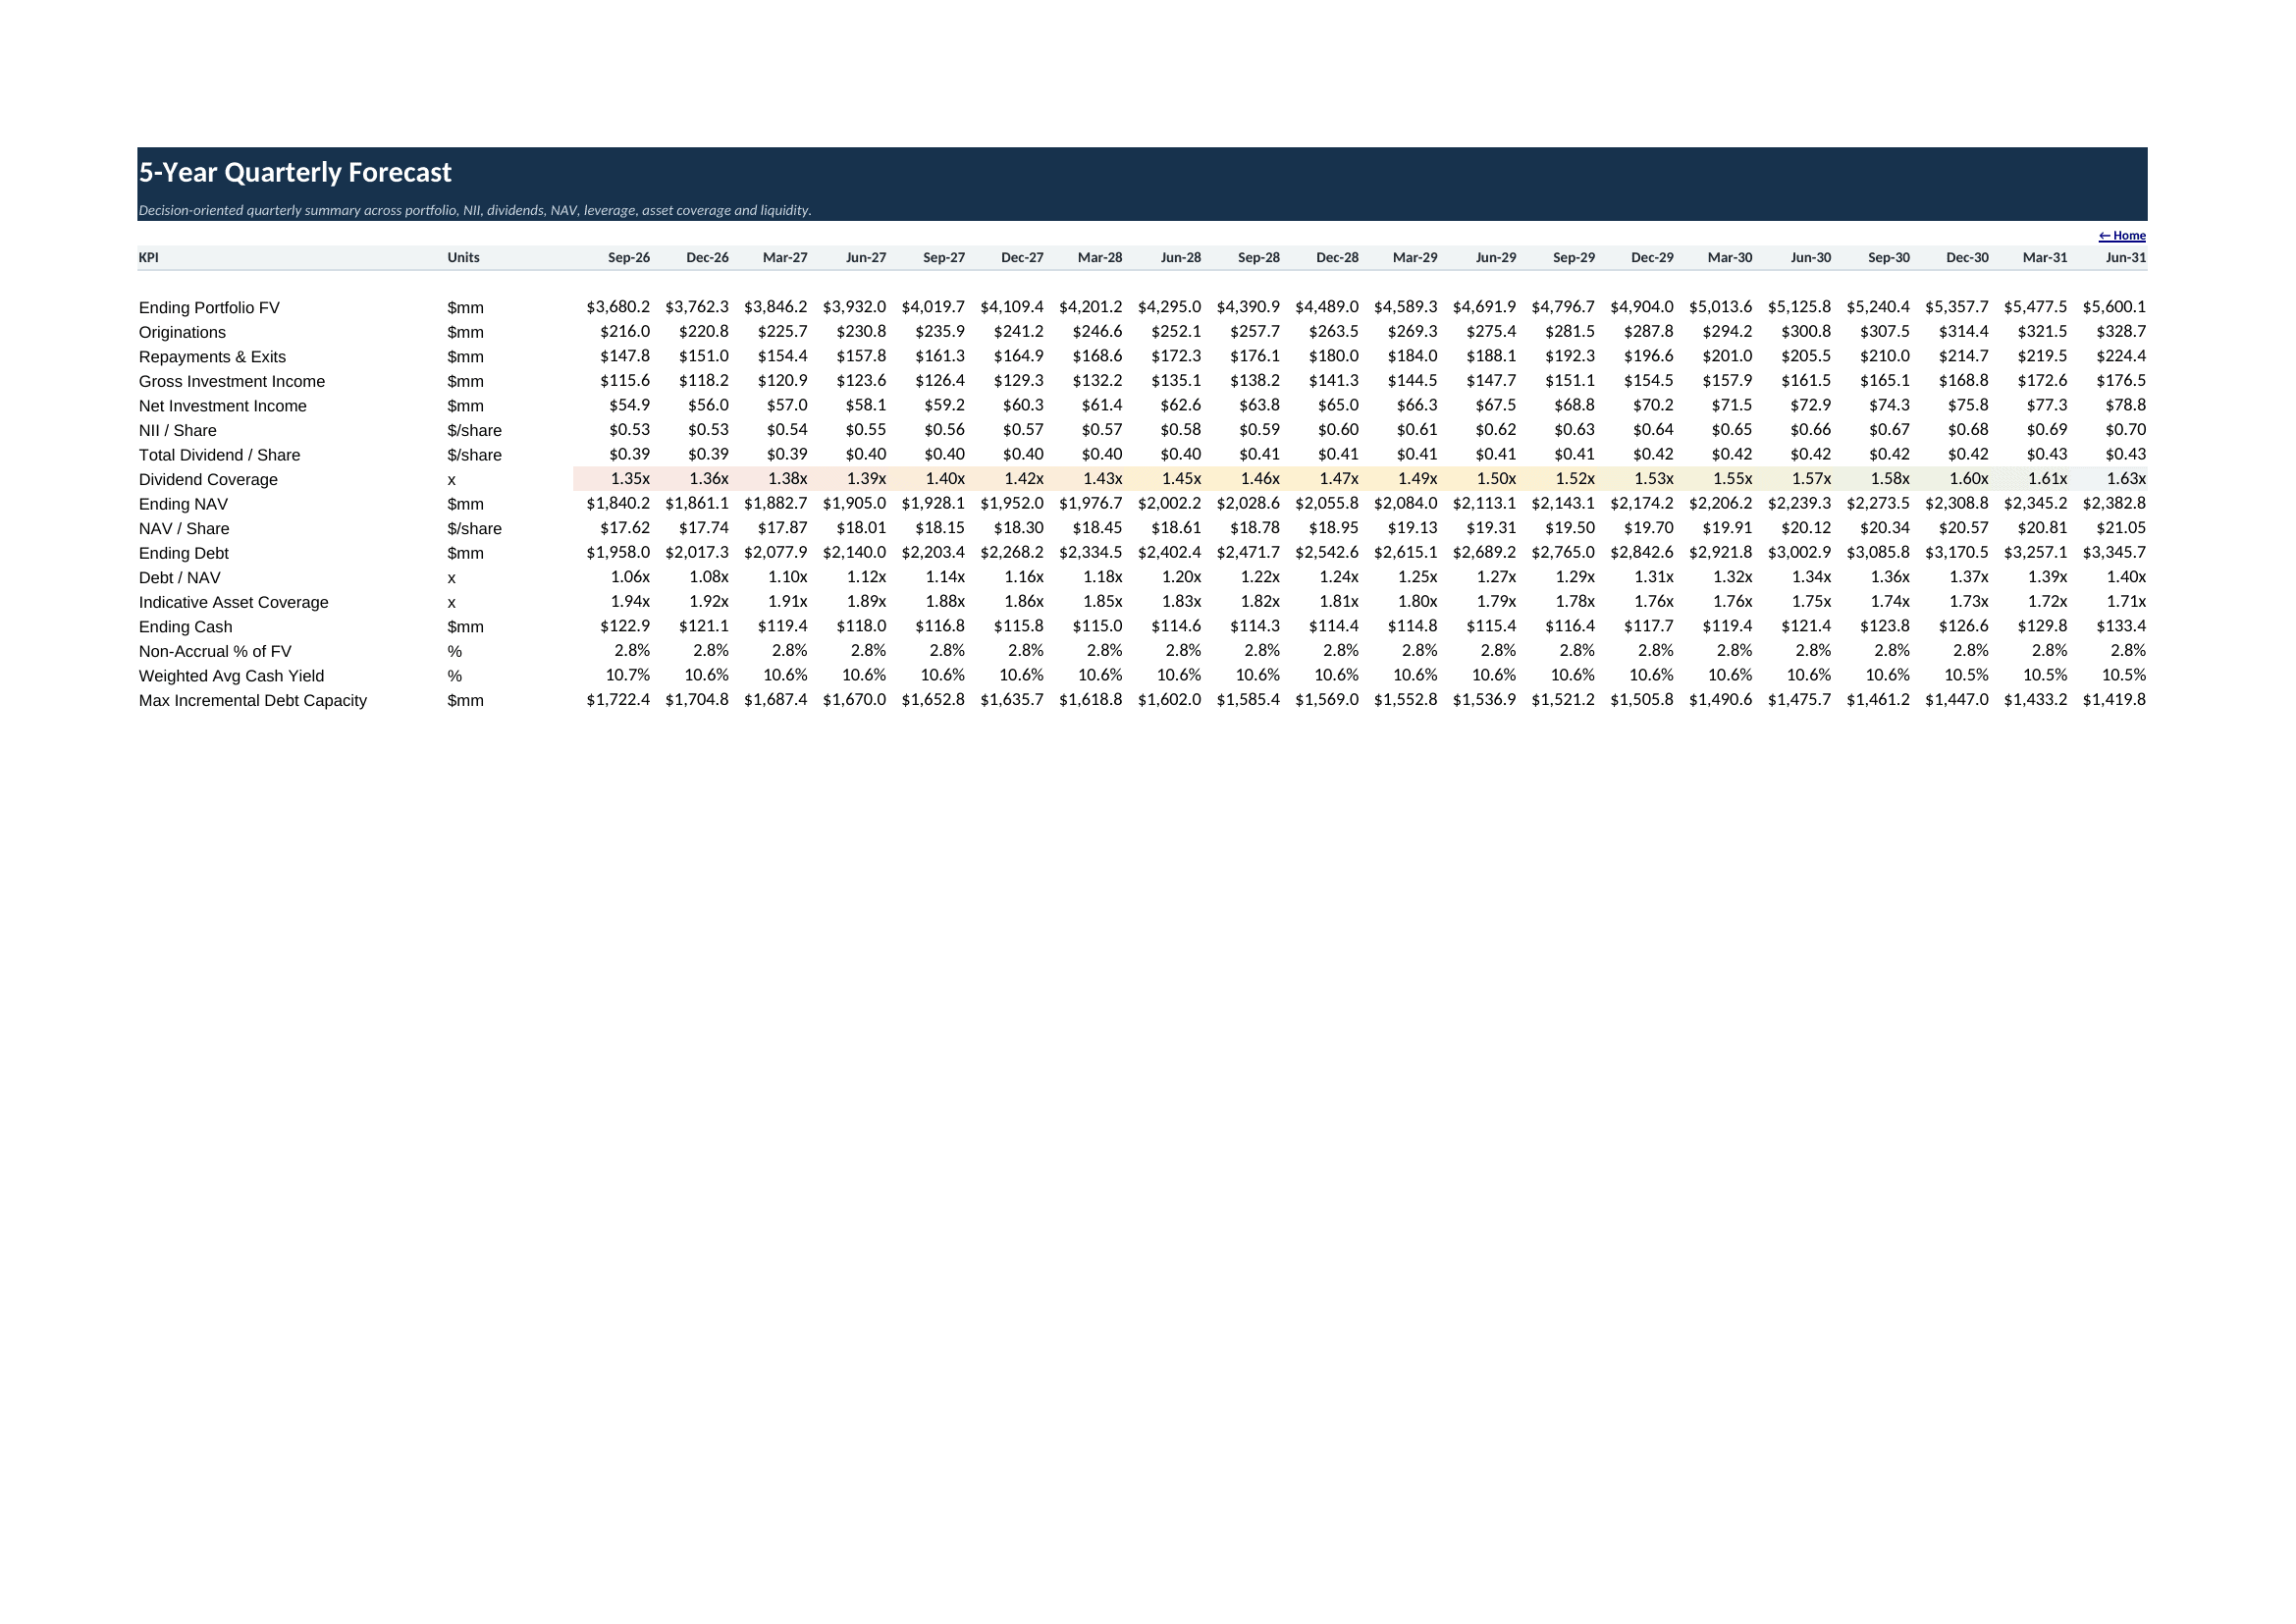
The workbook includes dedicated Profit & Loss, Balance Sheet and Cash Flow statements, together with a consolidated 5-Year Quarterly Forecast that summarizes the major operating, shareholder, leverage, liquidity and credit KPIs across all 20 quarters.
🧪 Scenario comparison and sensitivity analysis
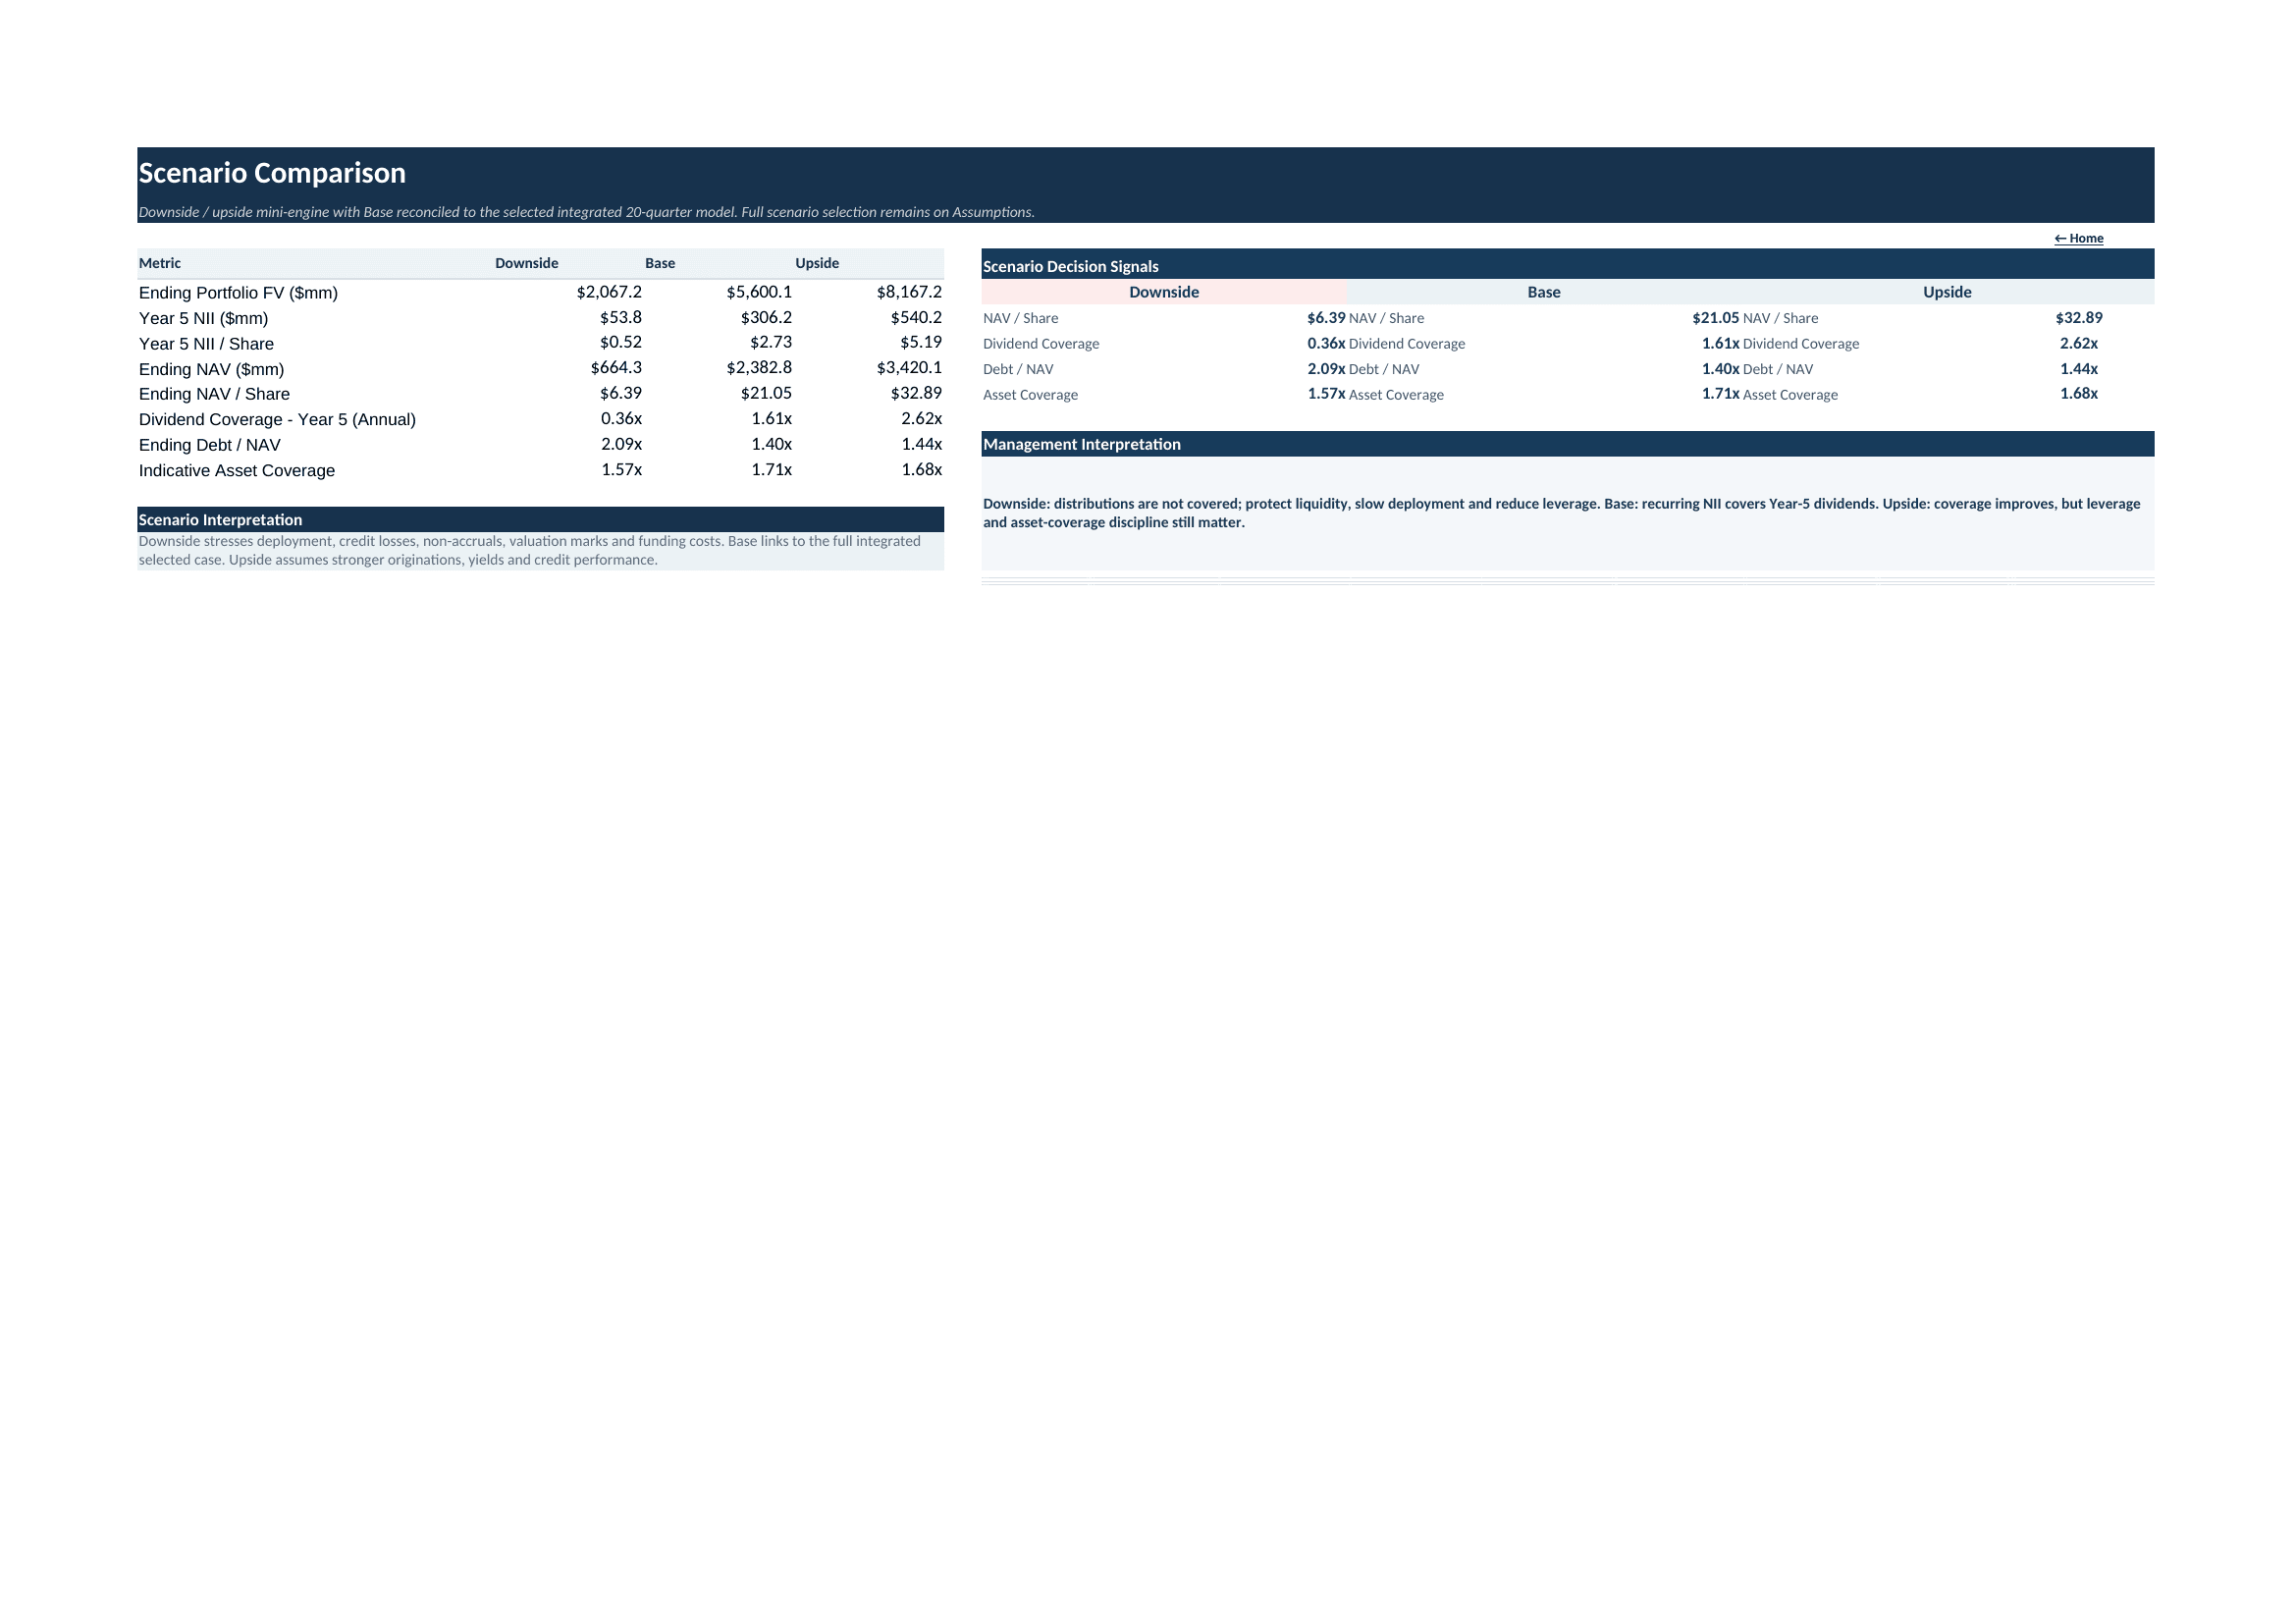
The Scenario Comparison page presents Downside, Base and Upside outcomes for ending portfolio fair value, Year-5 NII, NII/share, ending NAV, NAV/share, annual dividend coverage, Debt/NAV and indicative asset coverage. The Base column is linked to the integrated selected case, while the comparison layer provides directional stressed cases and management interpretation.
The Sensitivity Analysis page contains four decision matrices:
- Ending NAV/share versus realized loss rate and quarterly fair-value mark
- Year-5 NII/share versus portfolio yield and funding cost
- Dividend coverage versus funding cost and dividend growth
- Indicative asset coverage versus portfolio fair-value mark and Debt/NAV
These matrices make it easier to identify where value, earnings or coverage becomes most exposed to changes in credit, yield, funding or leverage assumptions.
📈 Dashboards and decision KPIs
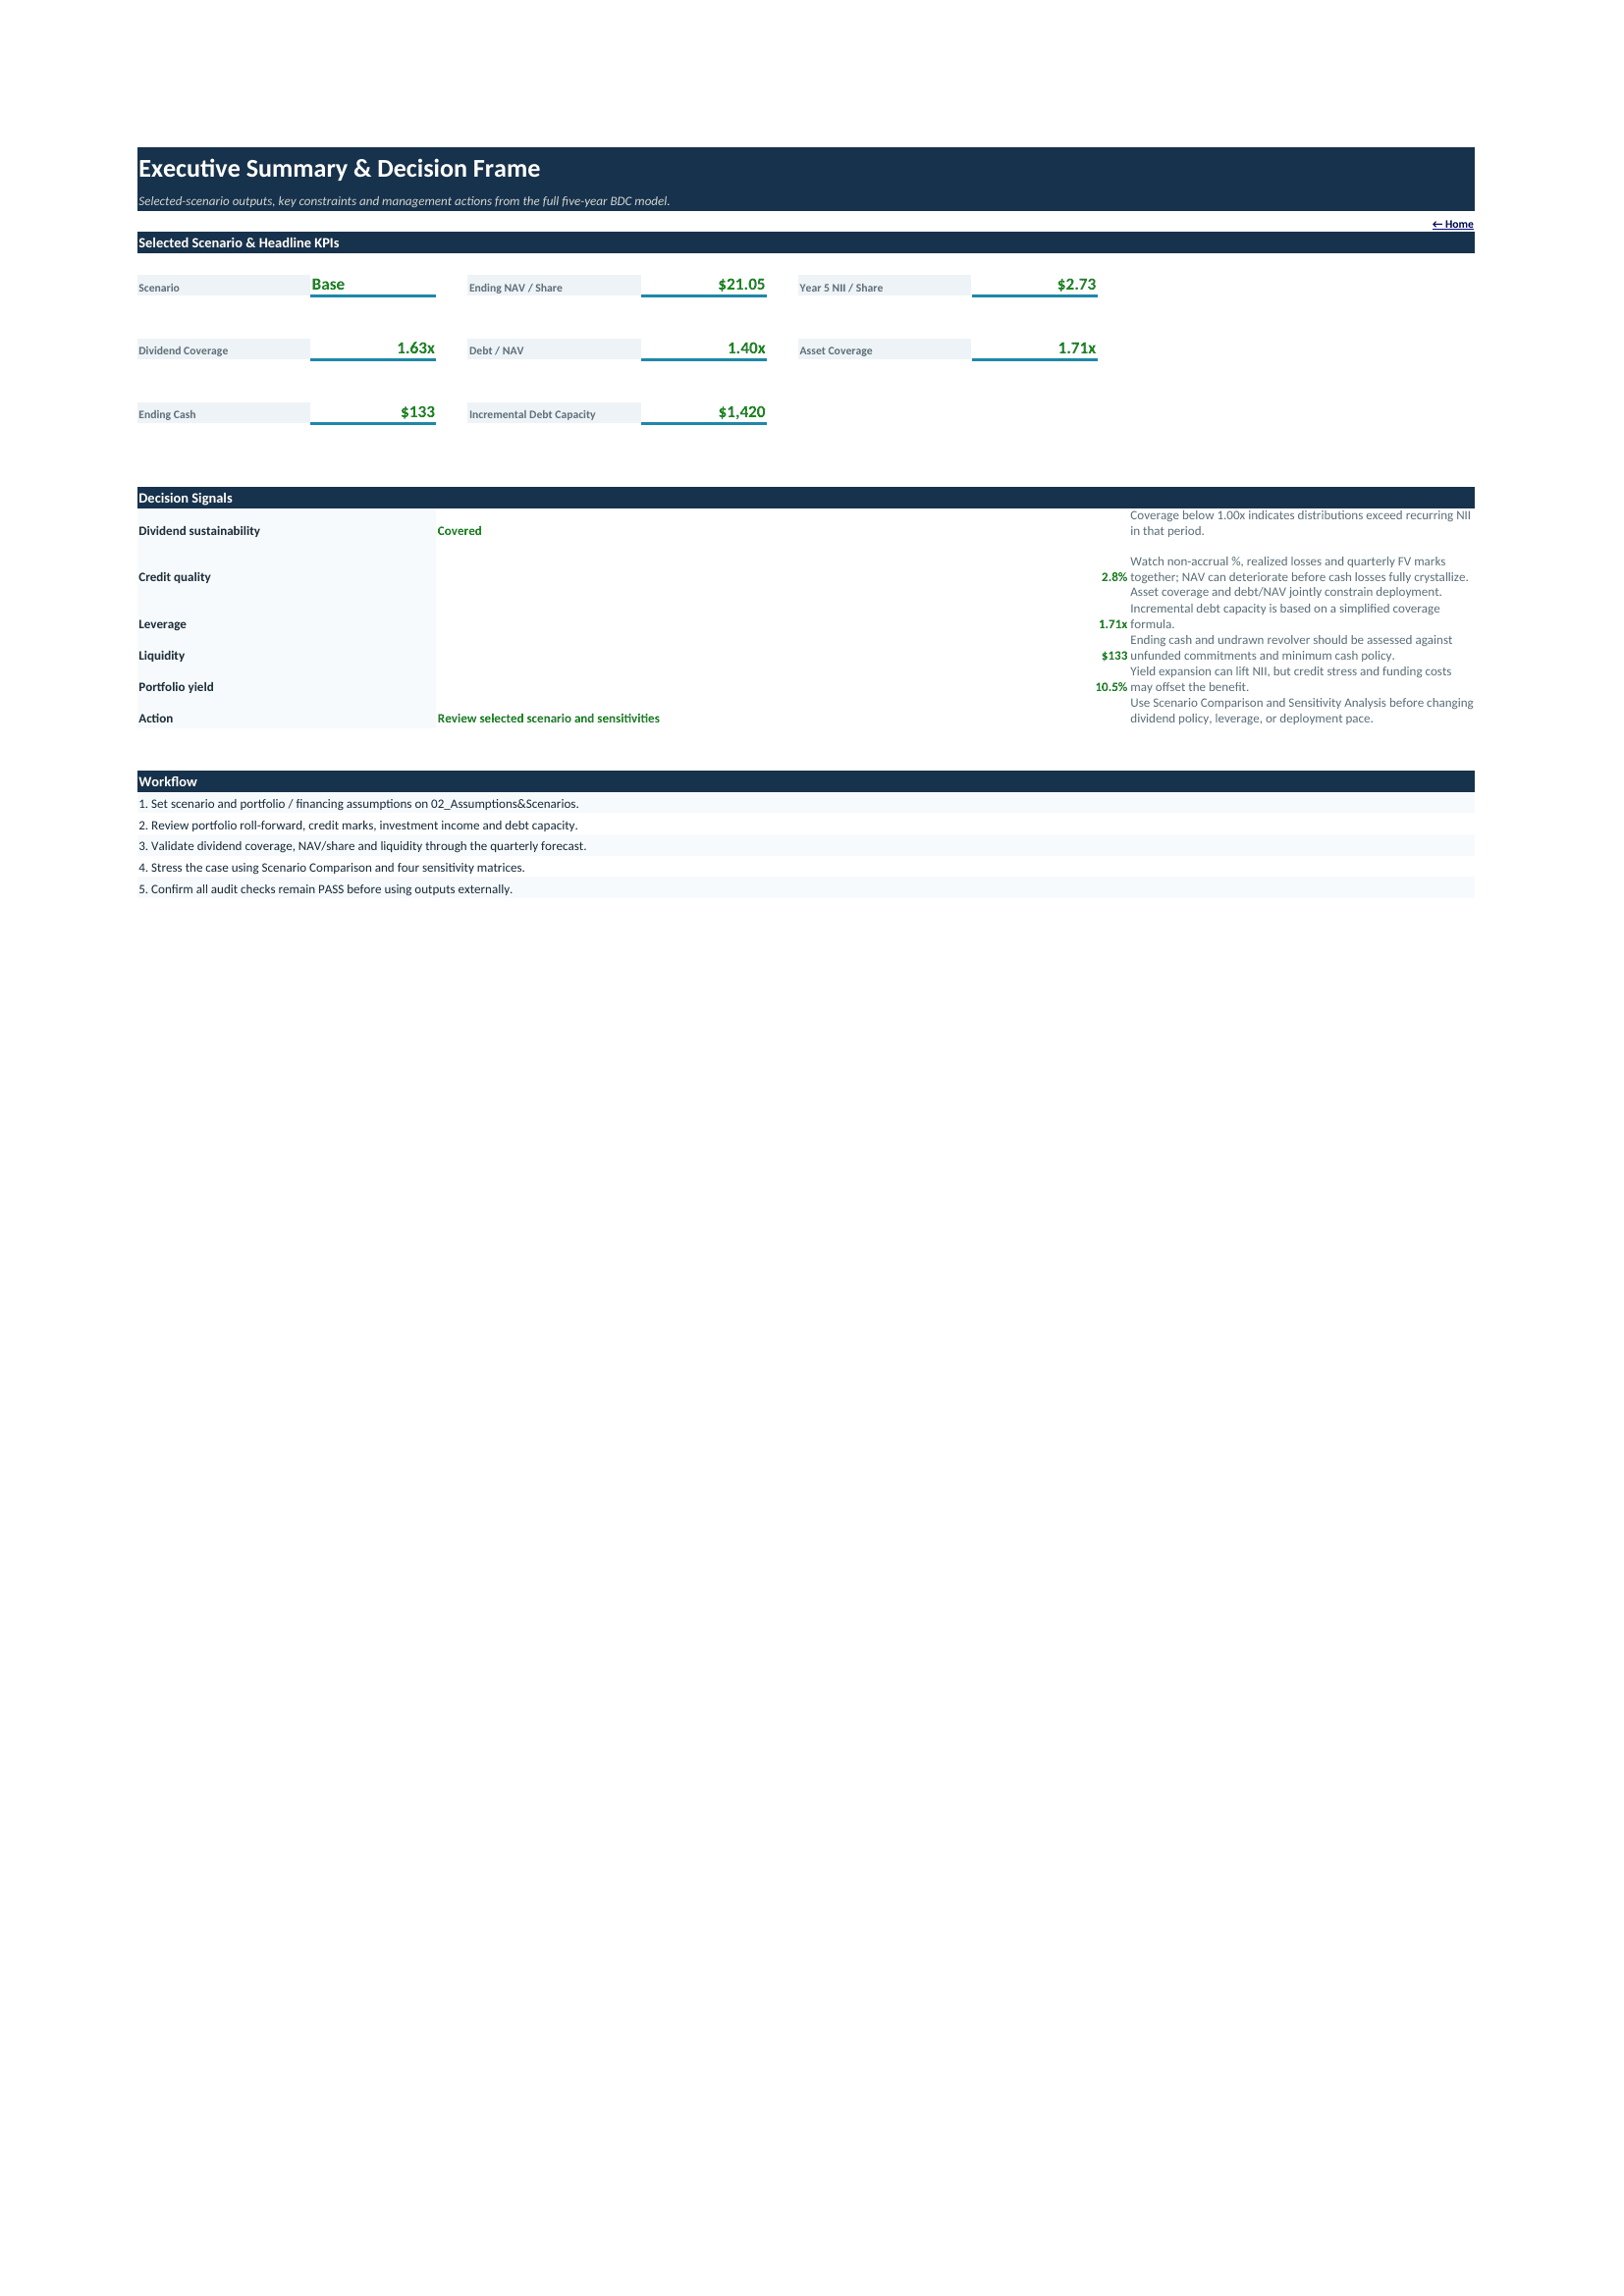
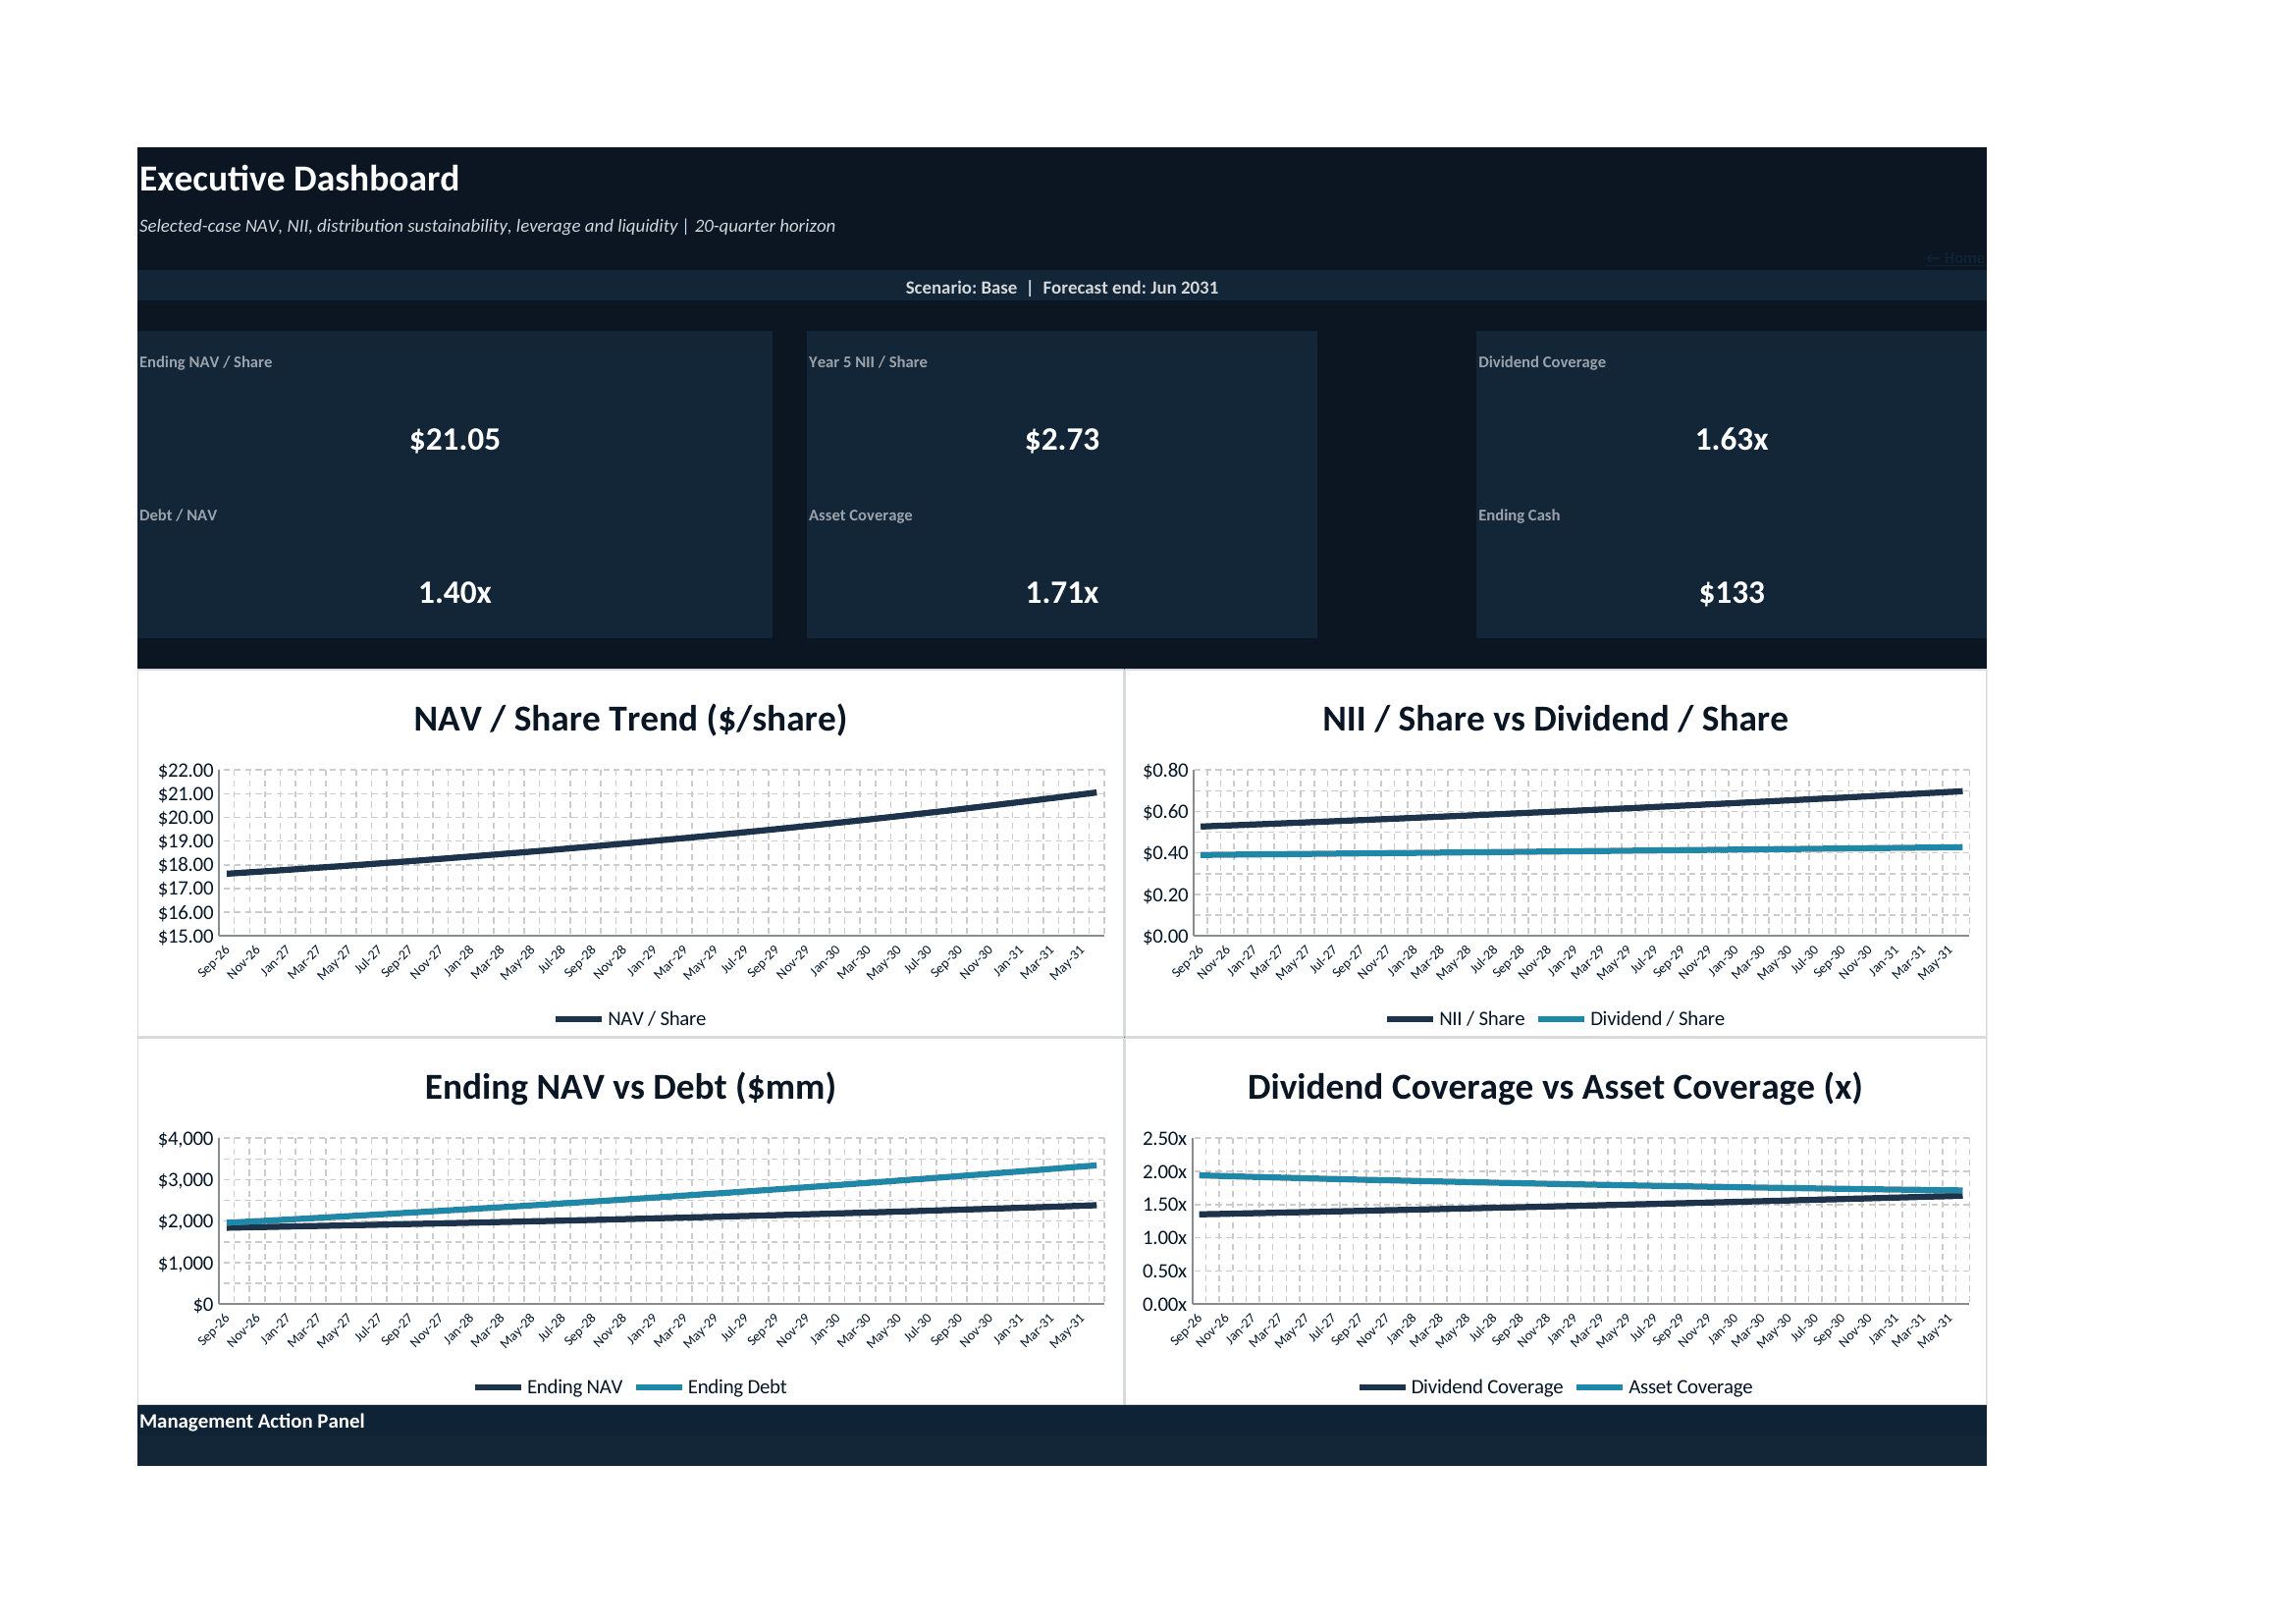
The Executive Dashboard summarizes the selected case with KPI cards for ending NAV/share, Year-5 NII/share, dividend coverage, Debt/NAV, asset coverage and ending cash. Four native charts show NAV/share trend, NII/share versus dividend/share, ending NAV versus debt, and dividend coverage versus asset coverage. A management-action panel translates the selected-case metrics into an operating signal.
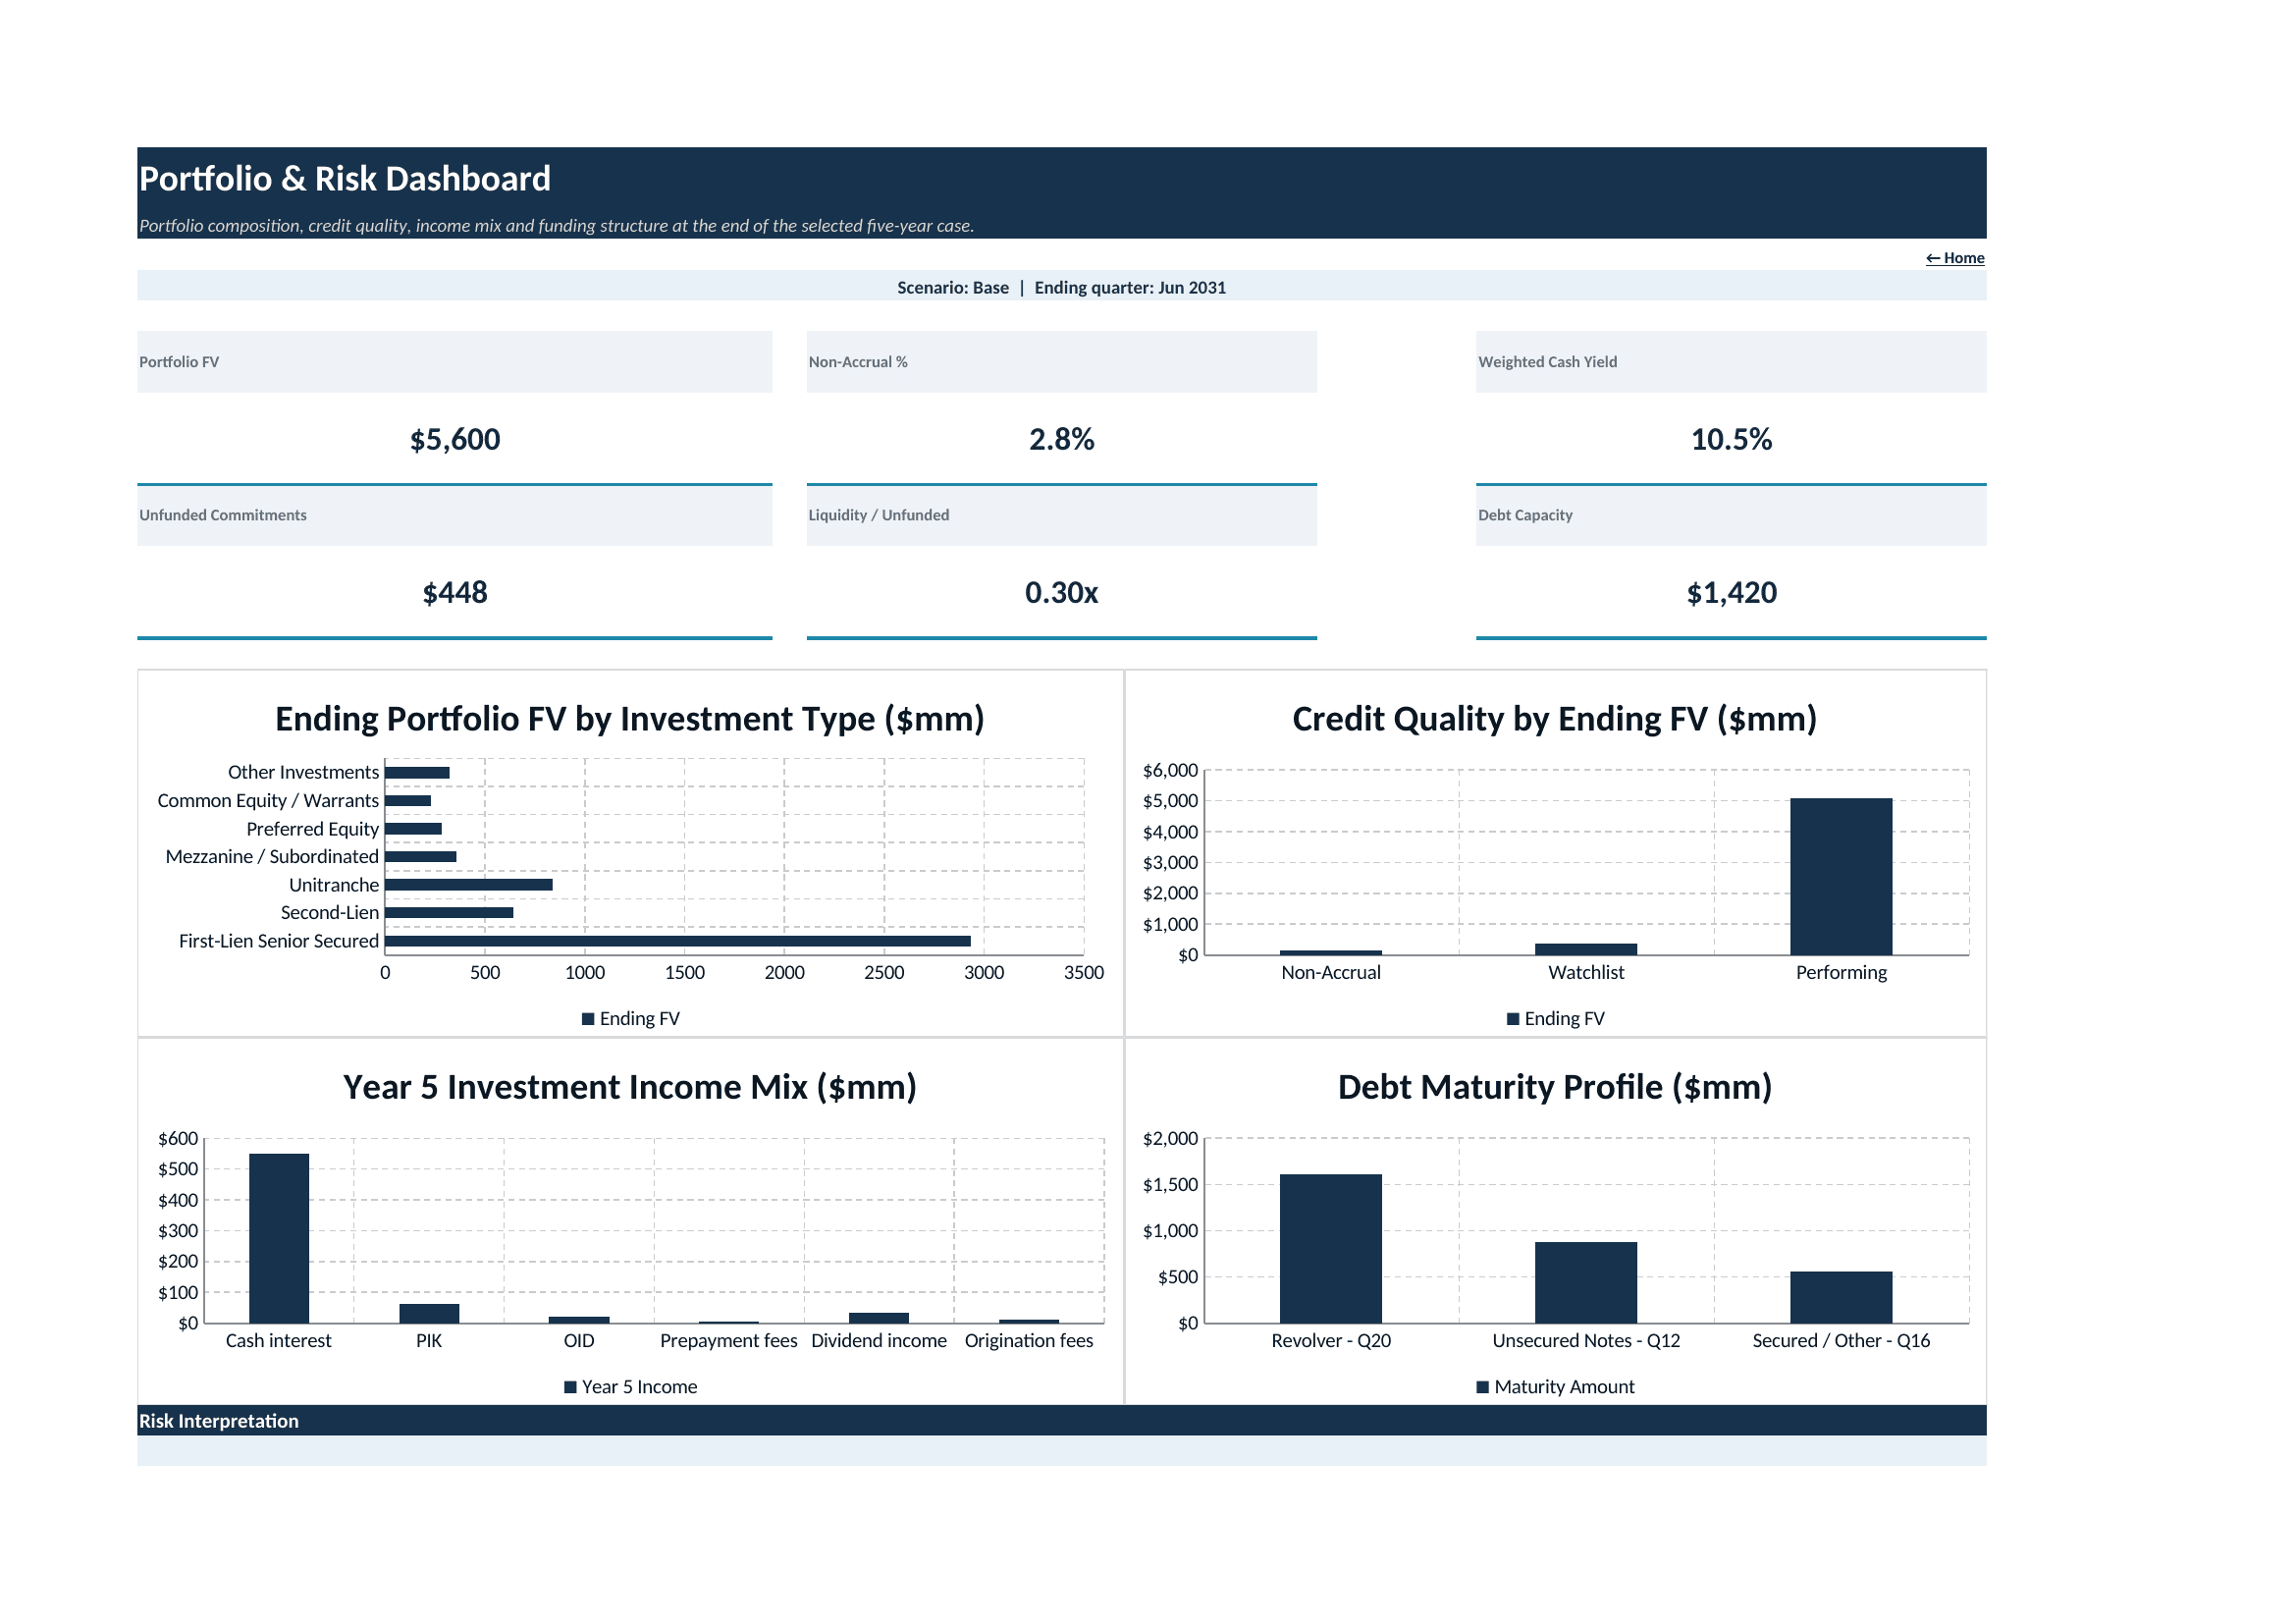
The Portfolio & Risk Dashboard focuses on ending portfolio fair value, non-accrual %, weighted cash yield, unfunded commitments, liquidity/unfunded and debt capacity. Four native charts show ending portfolio FV by investment type, credit quality by ending FV, Year-5 investment income mix and the debt maturity profile, supported by a risk-interpretation panel.
🗂️ Workbook structure
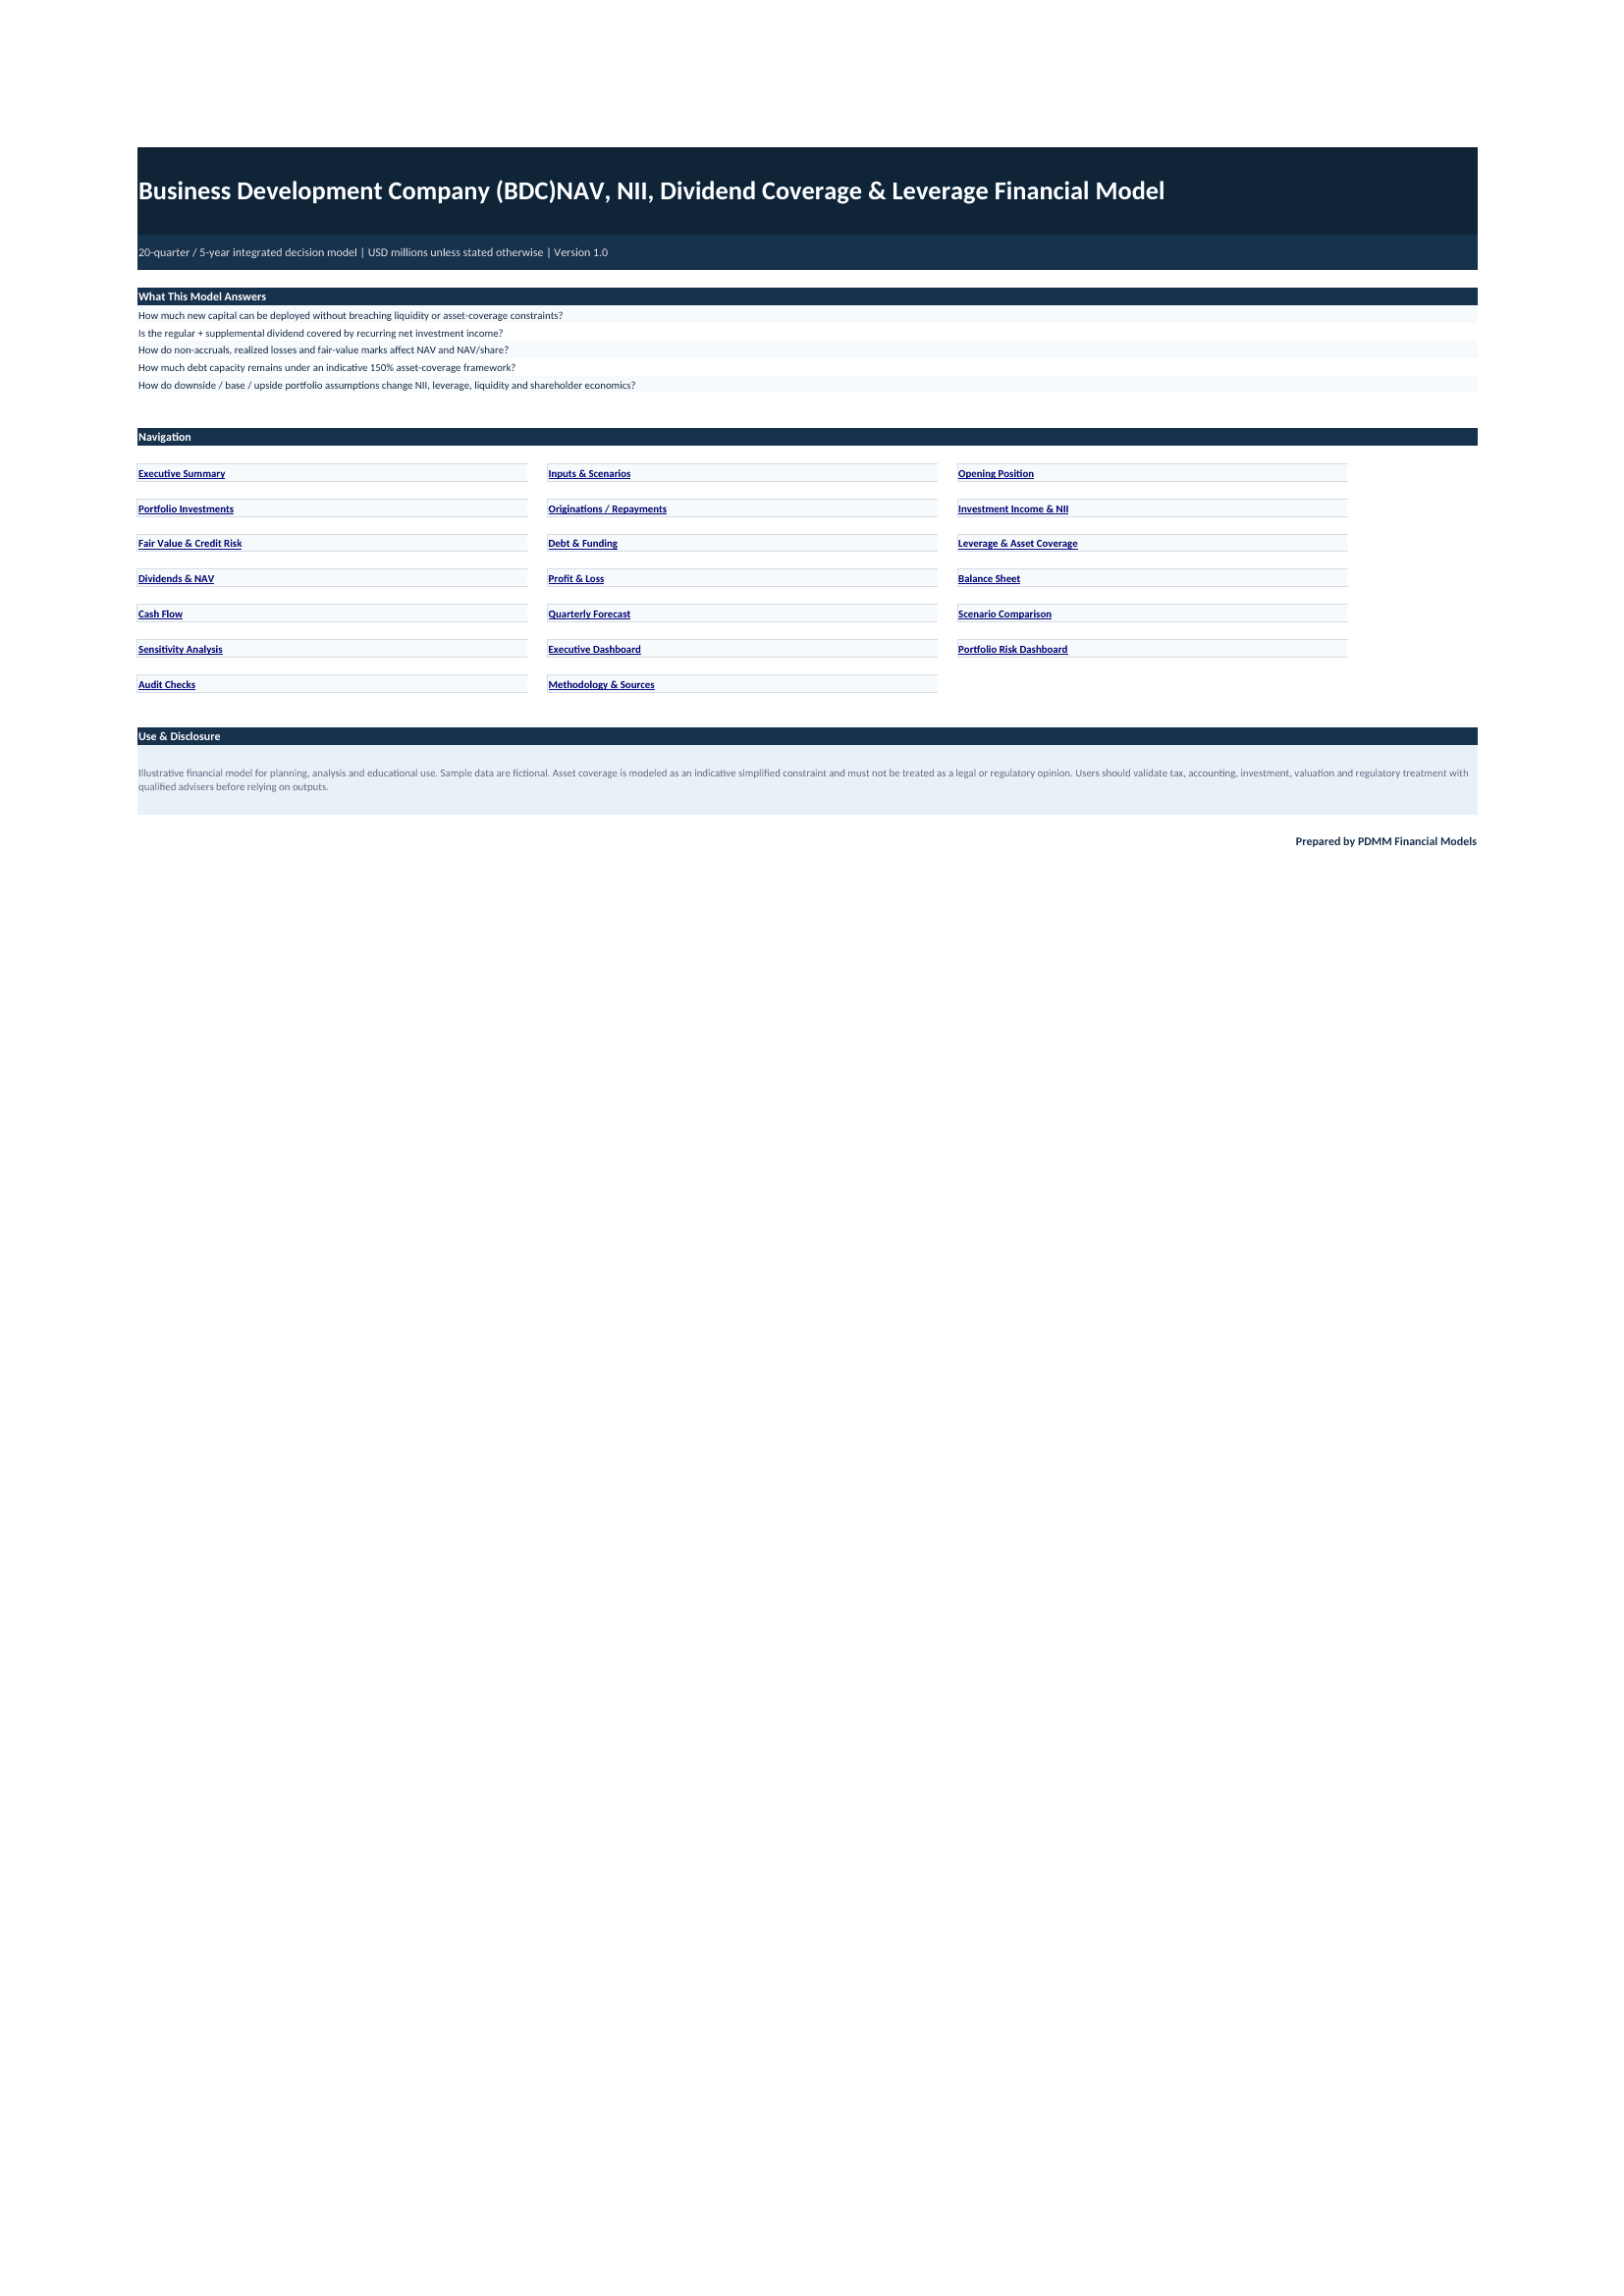
The 21 worksheets are organized as a connected workflow: Cover & Navigation; Executive Summary; Assumptions & Scenarios; Opening Balance & Historical; Portfolio Investments; Originations / Repayments / Exits; Investment Income & NII; Fair Value & Credit Risk; Debt & Funding; Leverage & Asset Coverage; Dividends & NAV; Profit & Loss; Balance Sheet; Cash Flow; 5-Year Quarterly Forecast; Scenario Comparison; Sensitivity Analysis; Executive Dashboard; Portfolio Risk Dashboard; Audit & Integrity Checks; and Methodology & Sources.
The workbook also includes 40 native internal navigation links so users can move between the cover and the operating, financial and analytical schedules without manually searching tabs.
✅ Practical use cases
- Planning: build a five-year BDC operating and capital-deployment plan.
- Forecasting: forecast quarterly portfolio FV, NII, NAV, debt, cash and credit metrics.
- Profitability: evaluate how portfolio yield, fees, operating costs, incentive fees and funding costs affect NII and NII/share.
- Cash flow: assess liquidity, minimum cash, debt activity, distributions and unfunded commitments.
- Pricing / spread analysis: test the earnings impact of portfolio cash yield versus all-in funding cost.
- Scenario analysis: compare Downside, Base and Upside portfolio, earnings, leverage and NAV outcomes.
- Sensitivity analysis: stress NAV/share, NII/share, dividend coverage and asset coverage across key drivers.
- Operational planning: evaluate origination pace, repayments, exits, deleveraging and financing mix.
- Credit-risk analysis: monitor non-accruals, watchlist exposure, realized losses and fair-value marks.
- Capital structure: review Debt/NAV, asset-coverage headroom, debt capacity and facility maturity exposure.
- Distribution policy: assess dividend coverage, payout ratio and sustainable dividend/share.
- Shareholder-value analysis: track NAV/share and portfolio fair value under alternative cases.
👥 Intended users
This model is suitable for BDC founders and management teams, listed or private BDC finance functions, private-credit and direct-lending platforms, CFOs and FP&A teams, portfolio managers, credit analysts, accountants, consultants, lenders and investors evaluating BDC-style economics.
🔍 Built-in integrity and methodology support
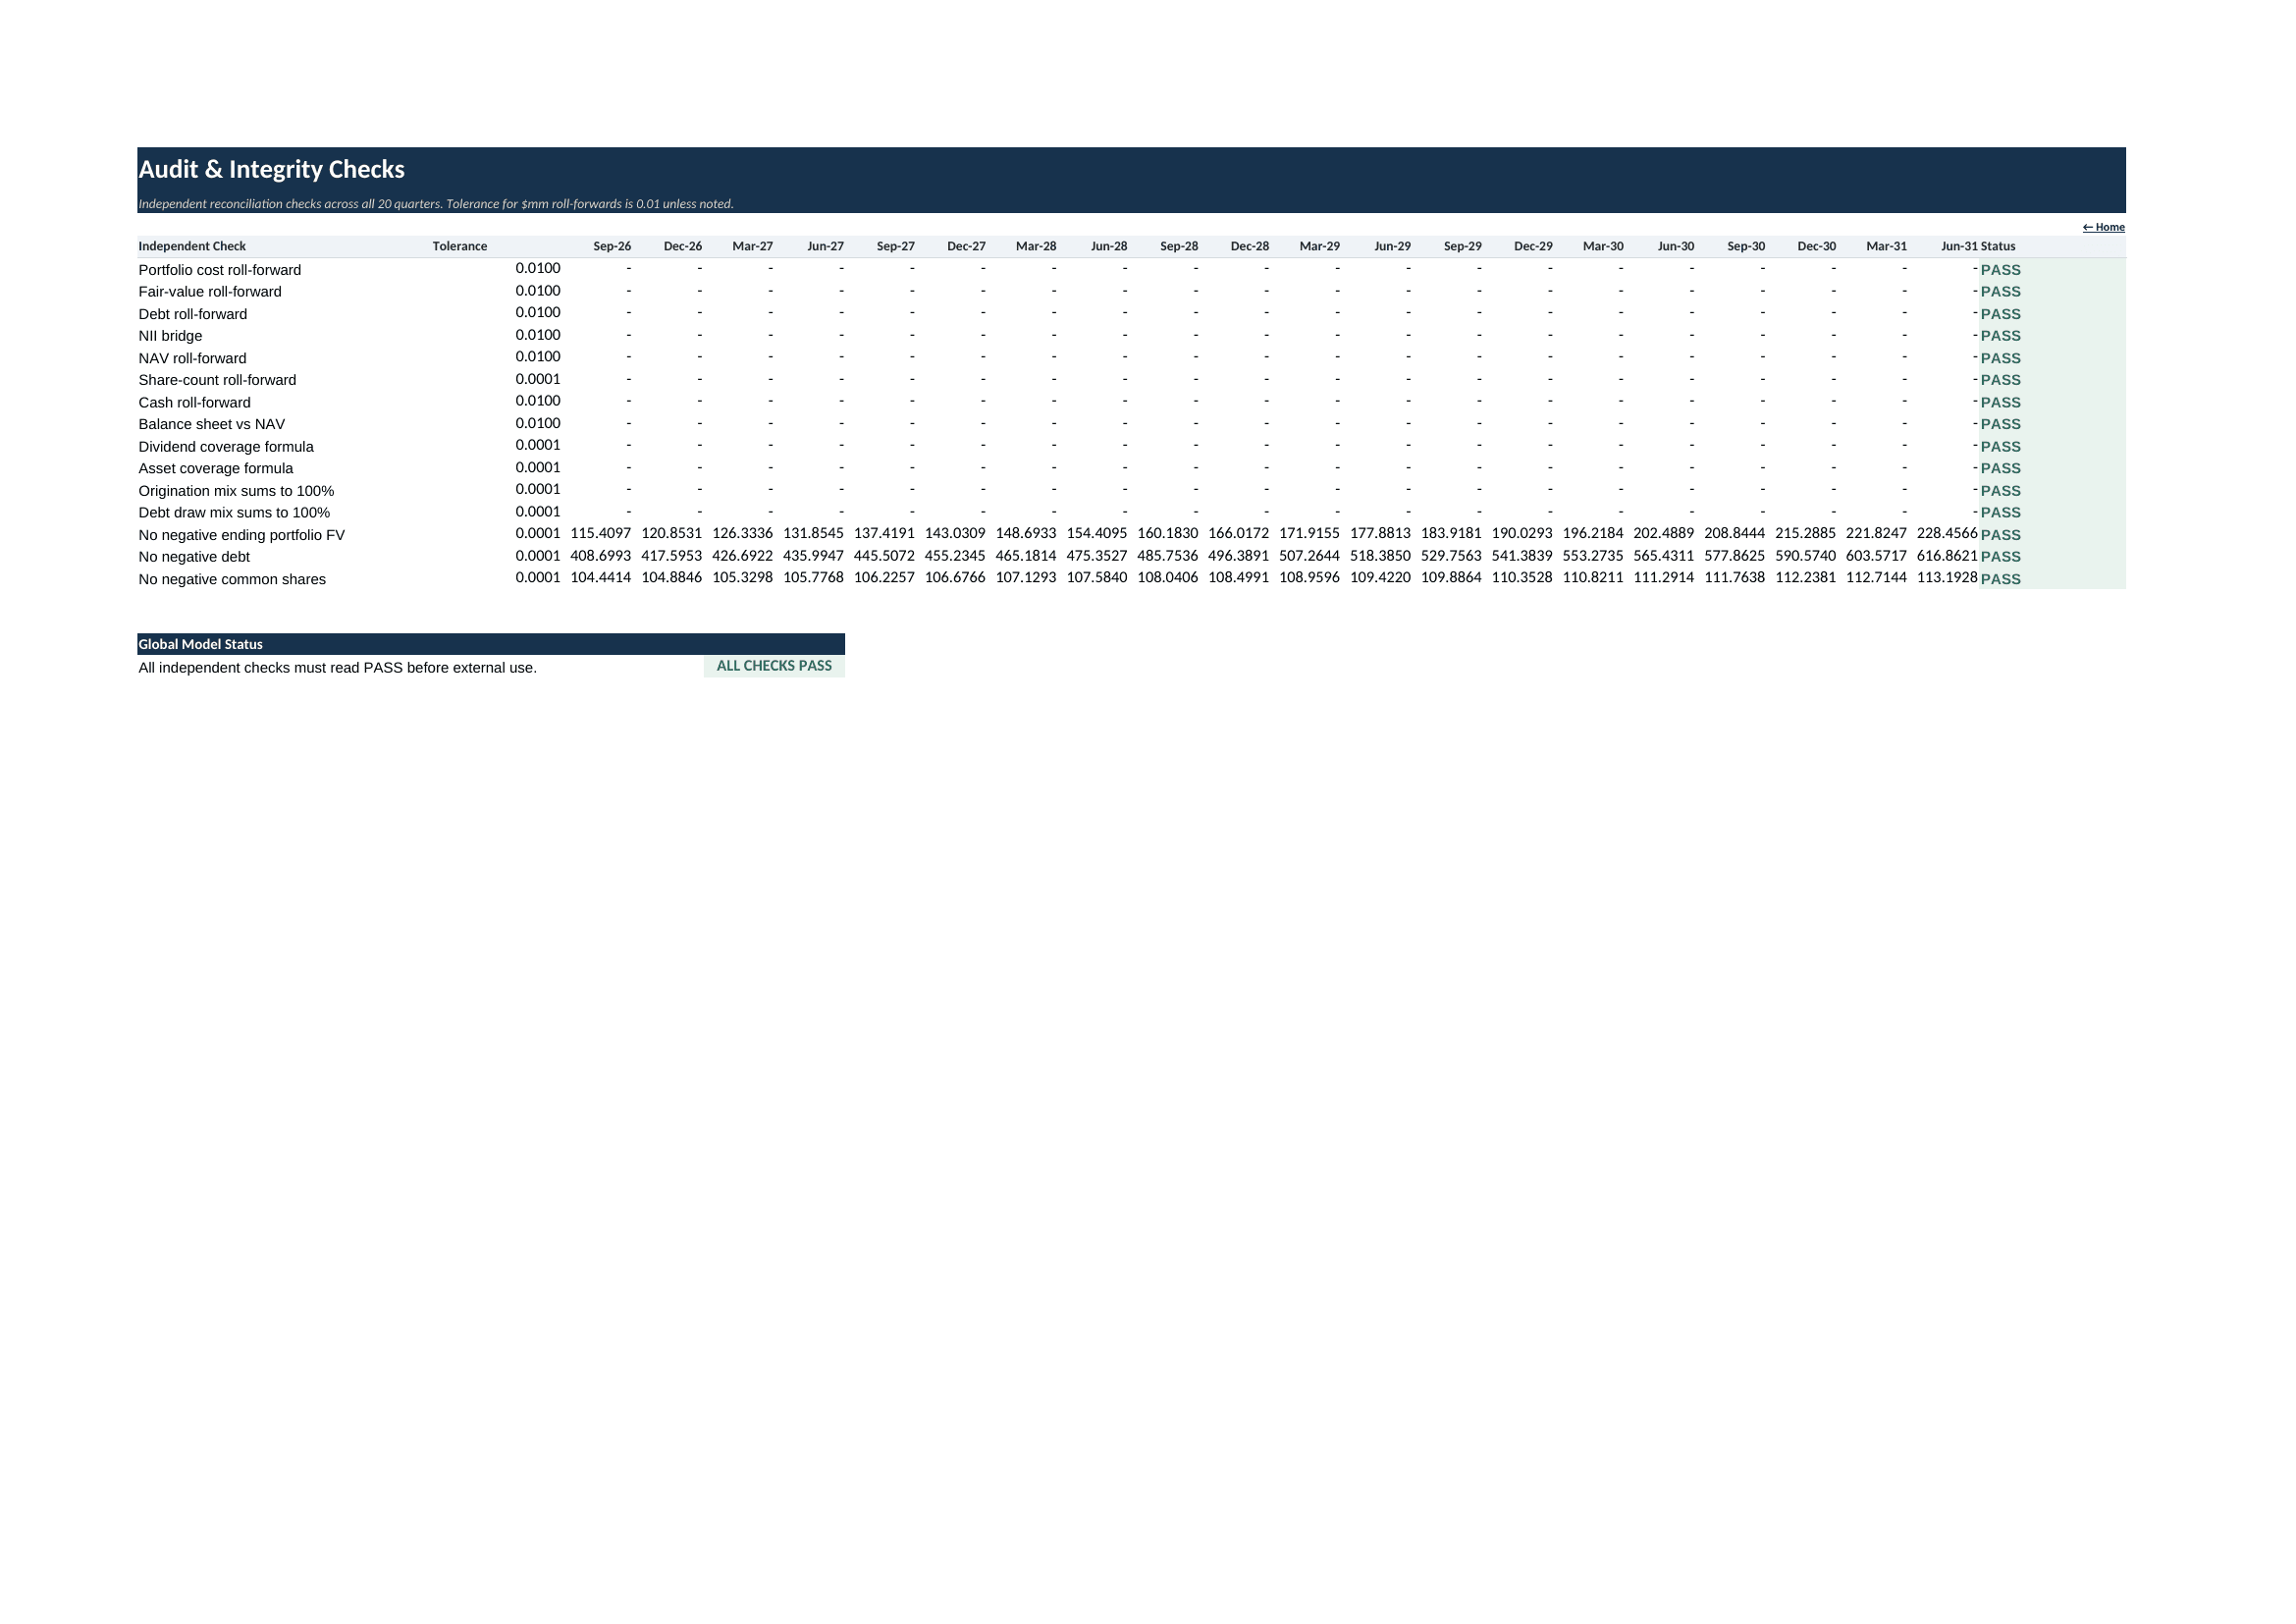
The Audit & Integrity Checks worksheet tests key roll-forwards and reconciliations across portfolio value, debt, NII, NAV and related schedules. The Methodology & Sources worksheet documents the core calculation approach, sign and unit conventions, public reference categories and model-use disclosures already contained inside the workbook.
📦 Delivered files
The package includes the editable Excel model, a 21-page full-sheet PDF preview with one page per worksheet, and a curated 14-image screenshot set for marketplace previews. The model is provided with illustrative sample data so buyers can understand the workflow immediately and replace assumptions with their own case.
Similar ProductsOther customers were also interested in...



 eFinancialModels
Electric Vehicle (EV) Charging Station Financial M...
With this comprehensive 5- or 10-year monthly tool, investors can assess the viability of setting up... Read more

Financial Model for Mobile App | Mobile App Busine...
The Mobile App Financial Plan Template in Excel allows you to develop financial projections when lau... Read more

 HenrySheykin
Food Truck Financial Model Excel Template
The Food Truck Financial Model helps entrepreneurs, founders, business owners, consultants, and anal... Read more

Green Hydrogen Production from Wind Energy Financi...
The Green Hydrogen from Wind Financial Model aims to comprehensively forecast a horizon of 40 years ... Read more

Simple Mutual Non-Disclosure Agreement Template
Protect your business secrets with ease using our Simple Mutual Non-Disclosure Agreement Template. S... Read more

Solar Energy Financial Model
The Solar Energy Financial Model Spreadsheet Template in Excel assists you in preparing a sophistica... Read more

 Peter Graf
The Customer-Centric Financial Model for Restauran...
Starting a restaurant without a financial plan is like driving a car blindfolded. You wouldn´t do i... Read more
You must log in to submit a review.