
0 ITEMS

Behavioral Health IOP/PHP Financial Model | Census, Payer Mix, Staffing, Revenue Cycle & Break-Even
Connect census, payer economics, staffing, revenue cycle, and cash flow in one operating model Behavioral health Intensive Outpatient Program (IOP) and Partial Hospitalization Program (PHP) operators have to manage several linked decisions at the same time. Census drives patient days; program mix and length of stay affect capacity; payer mix and authorization limits influence billable utilization; reimbursement, contractual adjustments, denials, and collection timing determine realized revenue; clinician ratios determine staffing needs and labor cost; and all of those drivers ultimately determine EBITDA, cash flow, break-even census, and expansion capacity.

🧠 Behavioral Health IOP/PHP Financial Model
Connect census, payer economics, staffing, revenue cycle, and cash flow in one operating model
Behavioral health Intensive Outpatient Program (IOP) and Partial Hospitalization Program (PHP) operators have to manage several linked decisions at the same time. Census drives patient days; program mix and length of stay affect capacity; payer mix and authorization limits influence billable utilization; reimbursement, contractual adjustments, denials, and collection timing determine realized revenue; clinician ratios determine staffing needs and labor cost; and all of those drivers ultimately determine EBITDA, cash flow, break-even census, and expansion capacity.
This Excel model brings those decisions together in a 12-month FY2026 operating and financial framework with monthly detail, annual summaries, a scenario selector, operational dashboards, revenue-cycle analysis, staffing logic, break-even analysis, and sensitivity outputs. It is designed to help a buyer move beyond a simple revenue-and-expense budget and understand the operating mechanics behind the forecast.
Seller-supplied and already tested; no Studio workbook audit was performed.
🎯 What decisions can this model support?
- Build a monthly operating plan for an IOP/PHP business using admissions, discharges, census, patient days, occupancy, and length of stay.
- Forecast revenue from payer mix, program mix, service-day mix, reimbursement rates, contractual adjustments, denials, bad debt, and collections assumptions.
- Test reimbursement and pricing assumptions across Medicare, Medicaid, Commercial, EAP, and Self-Pay categories using editable IOP and PHP rate inputs.
- Estimate clinician capacity and staffing needs using therapist ratios, group capacity, psychiatrist hours, admin ratios, utilization targets, overtime triggers, compensation, and payroll burden.
- Evaluate profitability through operating costs, EBITDA, EBITDA margin, depreciation, taxes, and net income.
- Plan liquidity through A/R timing, cash collections, capital expenditures, operating cash flow, and ending cash.
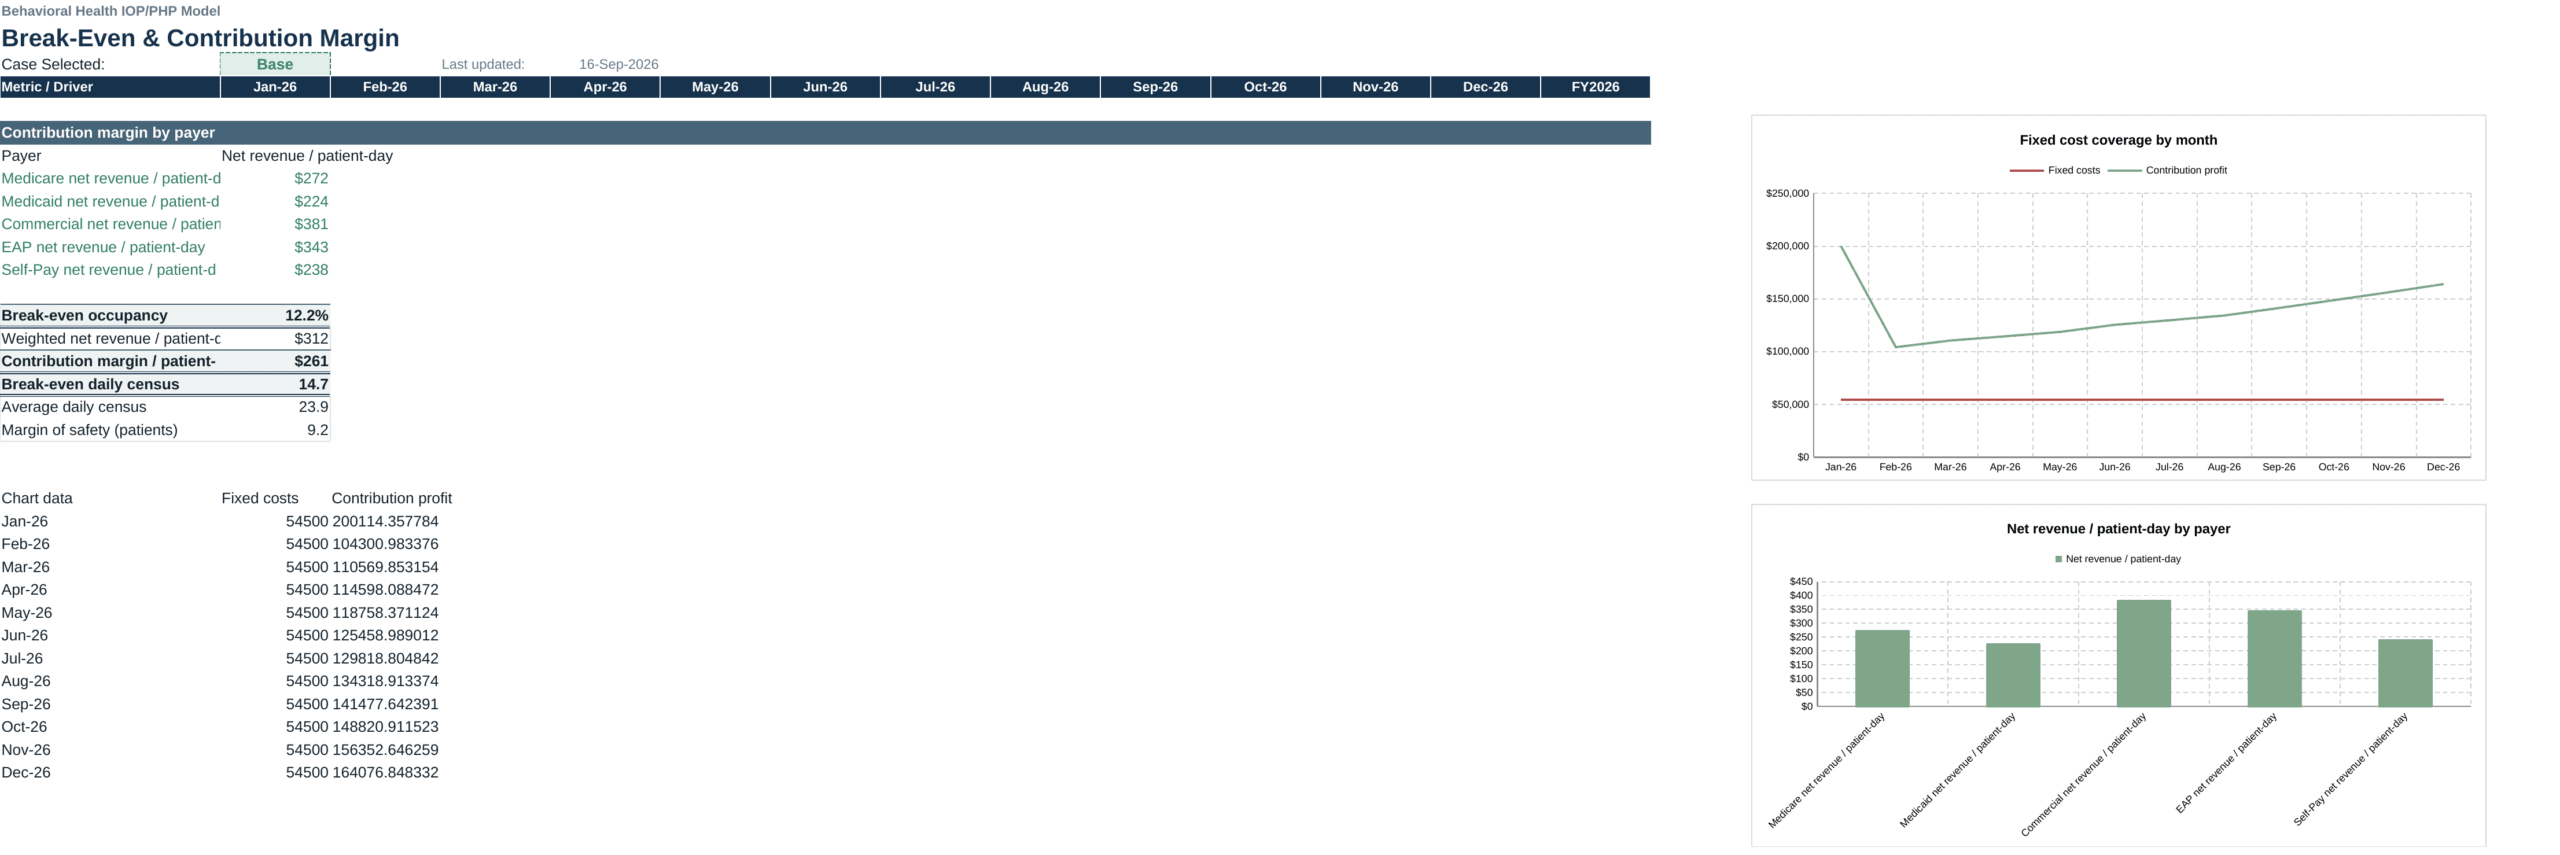
- Calculate contribution margin, break-even occupancy, break-even daily census, and margin of safety.
- Compare referral channels, funnel conversion, admissions, and blended customer acquisition cost across hospitals, private practices, self-referral, and digital marketing.
- Assess program mix and site-expansion logic using IOP/PHP census, licensed capacity, occupancy triggers, sustain periods, site capex, ramp assumptions, and incremental rent.
- Run scenario and sensitivity reviews around census, commercial payer mix, denial rate, clinical payroll, and IOP reimbursement rates.
🧭 Model workflow
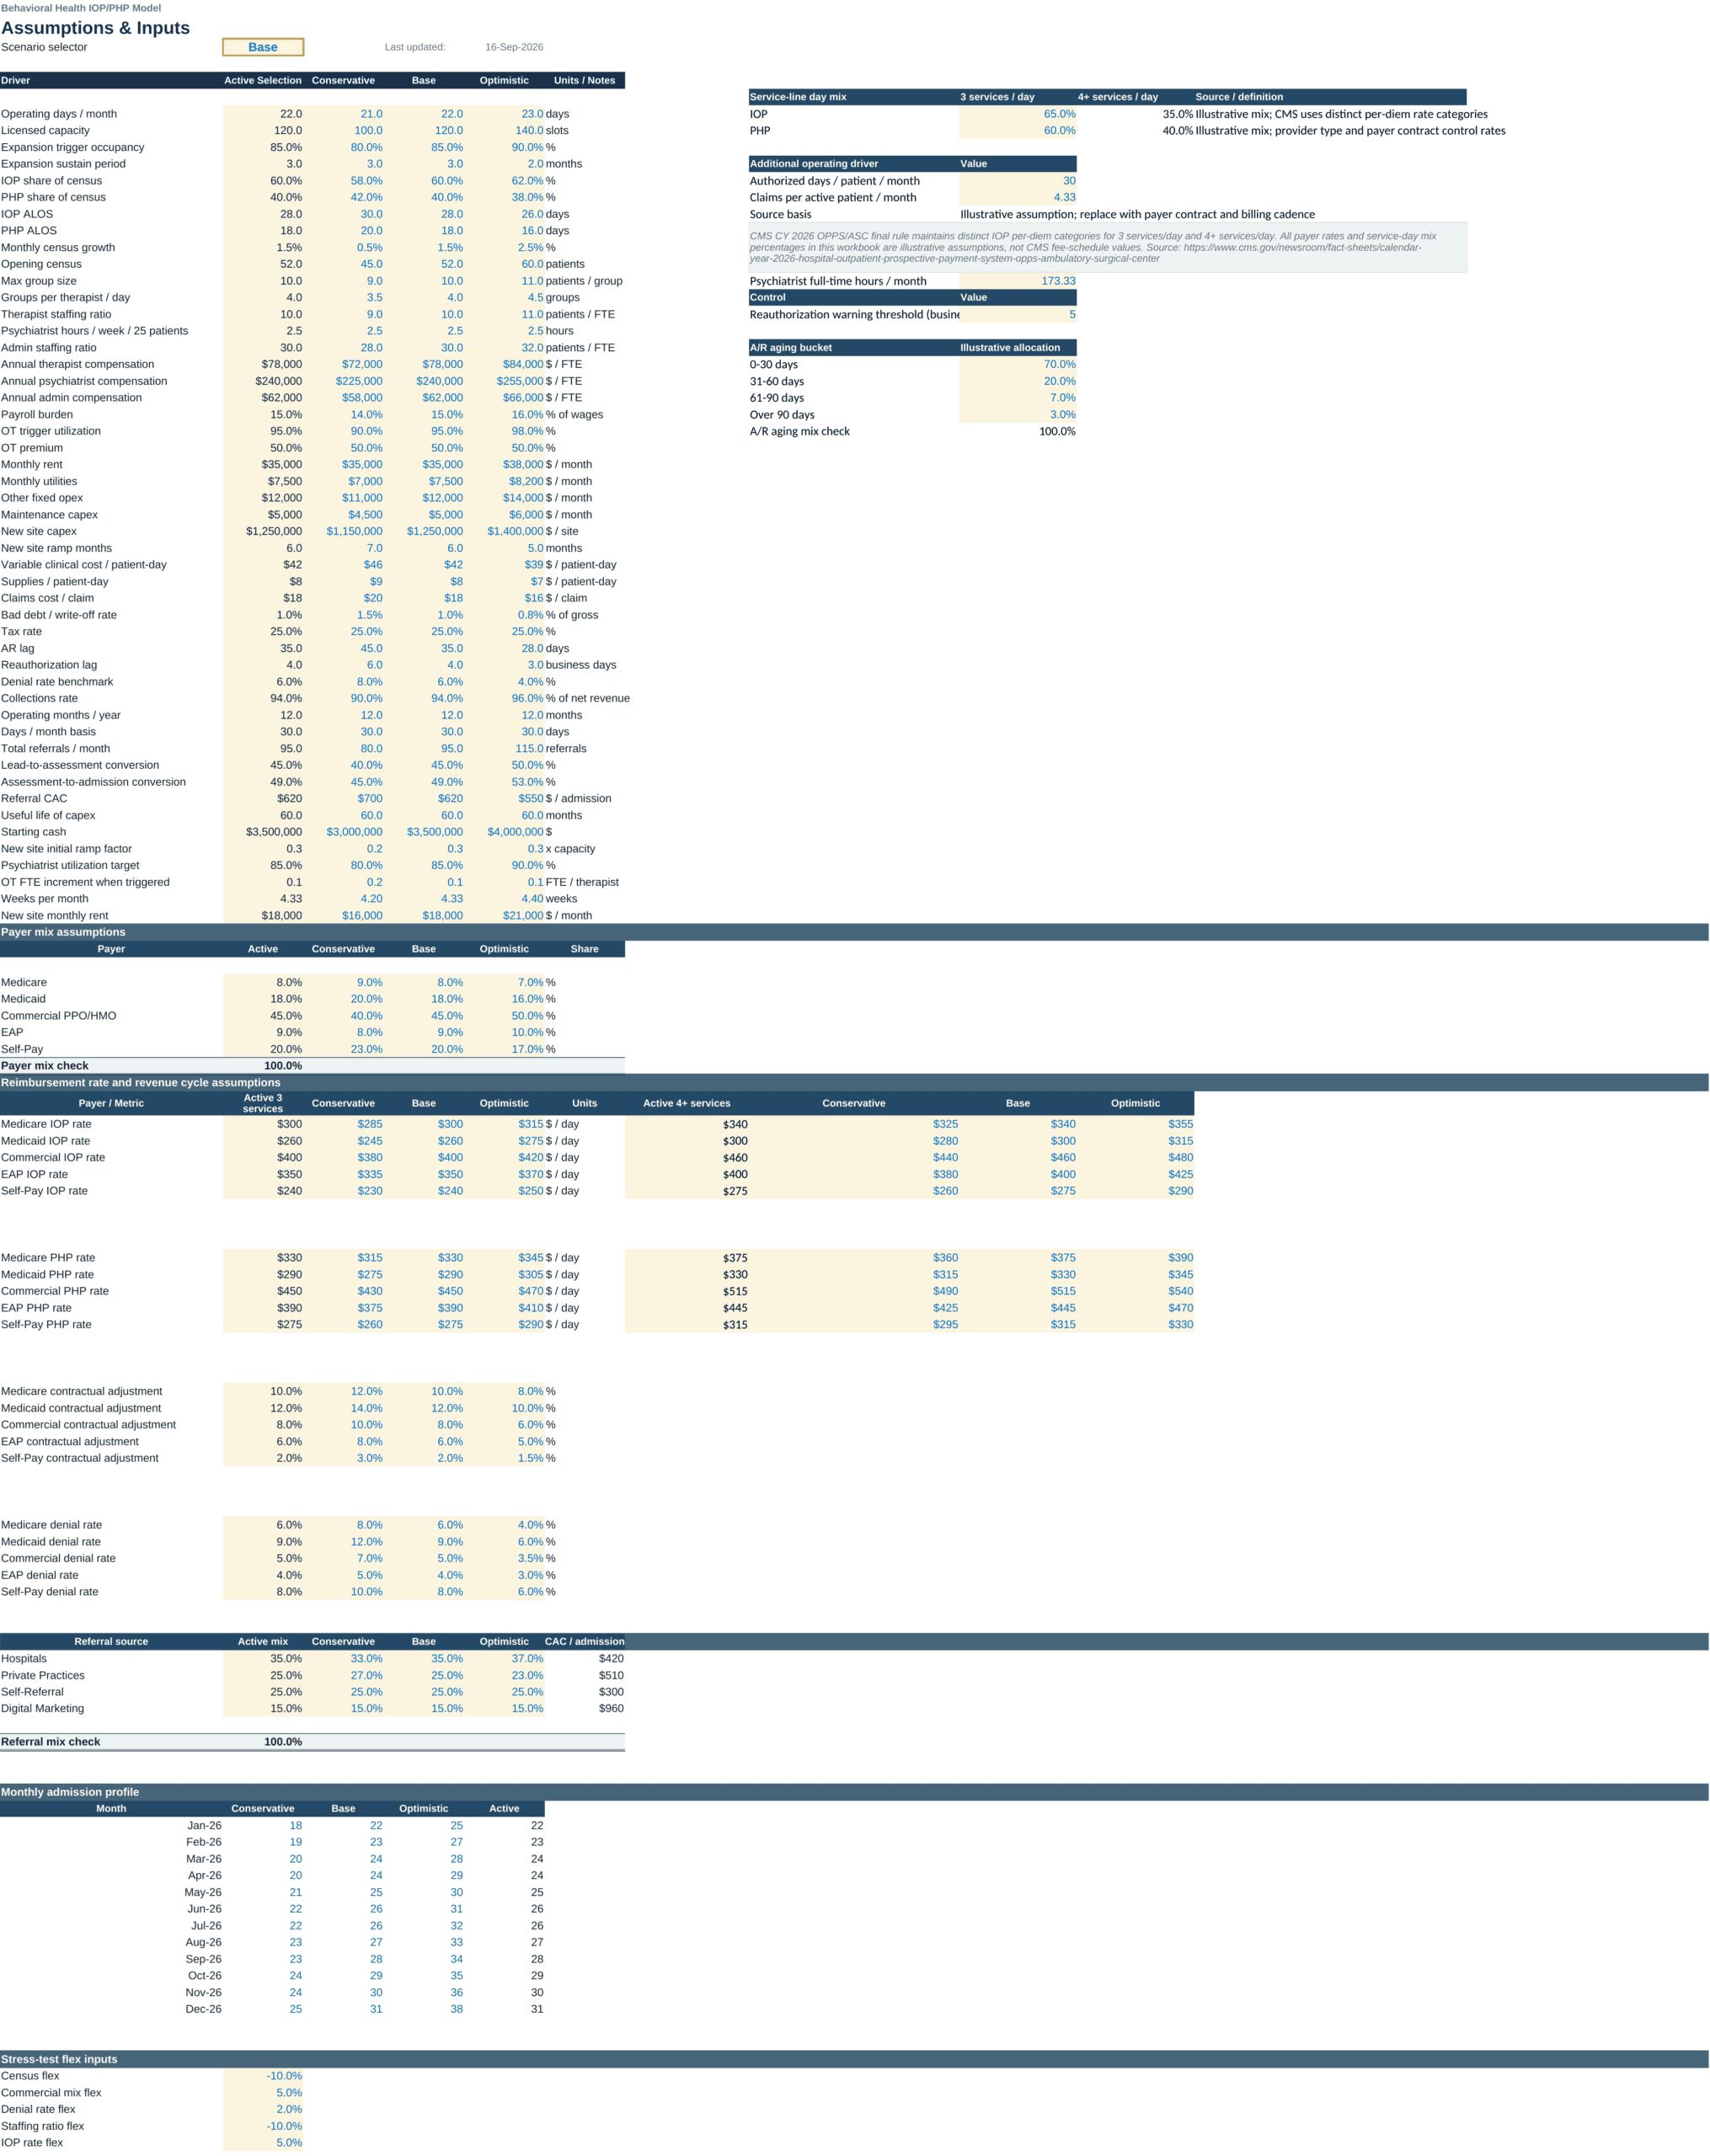
Start on Assumptions & Inputs and select Conservative, Base, or Optimistic. The active case feeds the operating modules across the workbook. Update the operating assumptions that matter to your organization, including operating days, licensed capacity, opening census, IOP/PHP mix, average length of stay, growth, staffing ratios, compensation, fixed and variable costs, A/R lag, authorization timing, referral funnel, starting cash, and expansion assumptions.
Next, update payer economics. The workbook provides editable payer mix, IOP and PHP reimbursement assumptions, 3-services and 4+-services day categories, contractual adjustments, denial rates, and collection assumptions. Referral-source mix and CAC assumptions can also be changed. Monthly admission profiles and stress-test flex inputs are located in the same assumptions sheet, keeping the main business drivers in one place.
Then review the operating and financial outputs. Census and patient days flow into authorization utilization, reimbursement, staffing, cost structure, the P&L, cash flow, break-even calculations, dashboards, and sensitivity analysis. Editable cells are visually differentiated from formula-driven cells according to the workbook’s built-in design system.
📊 Dashboard and KPI coverage
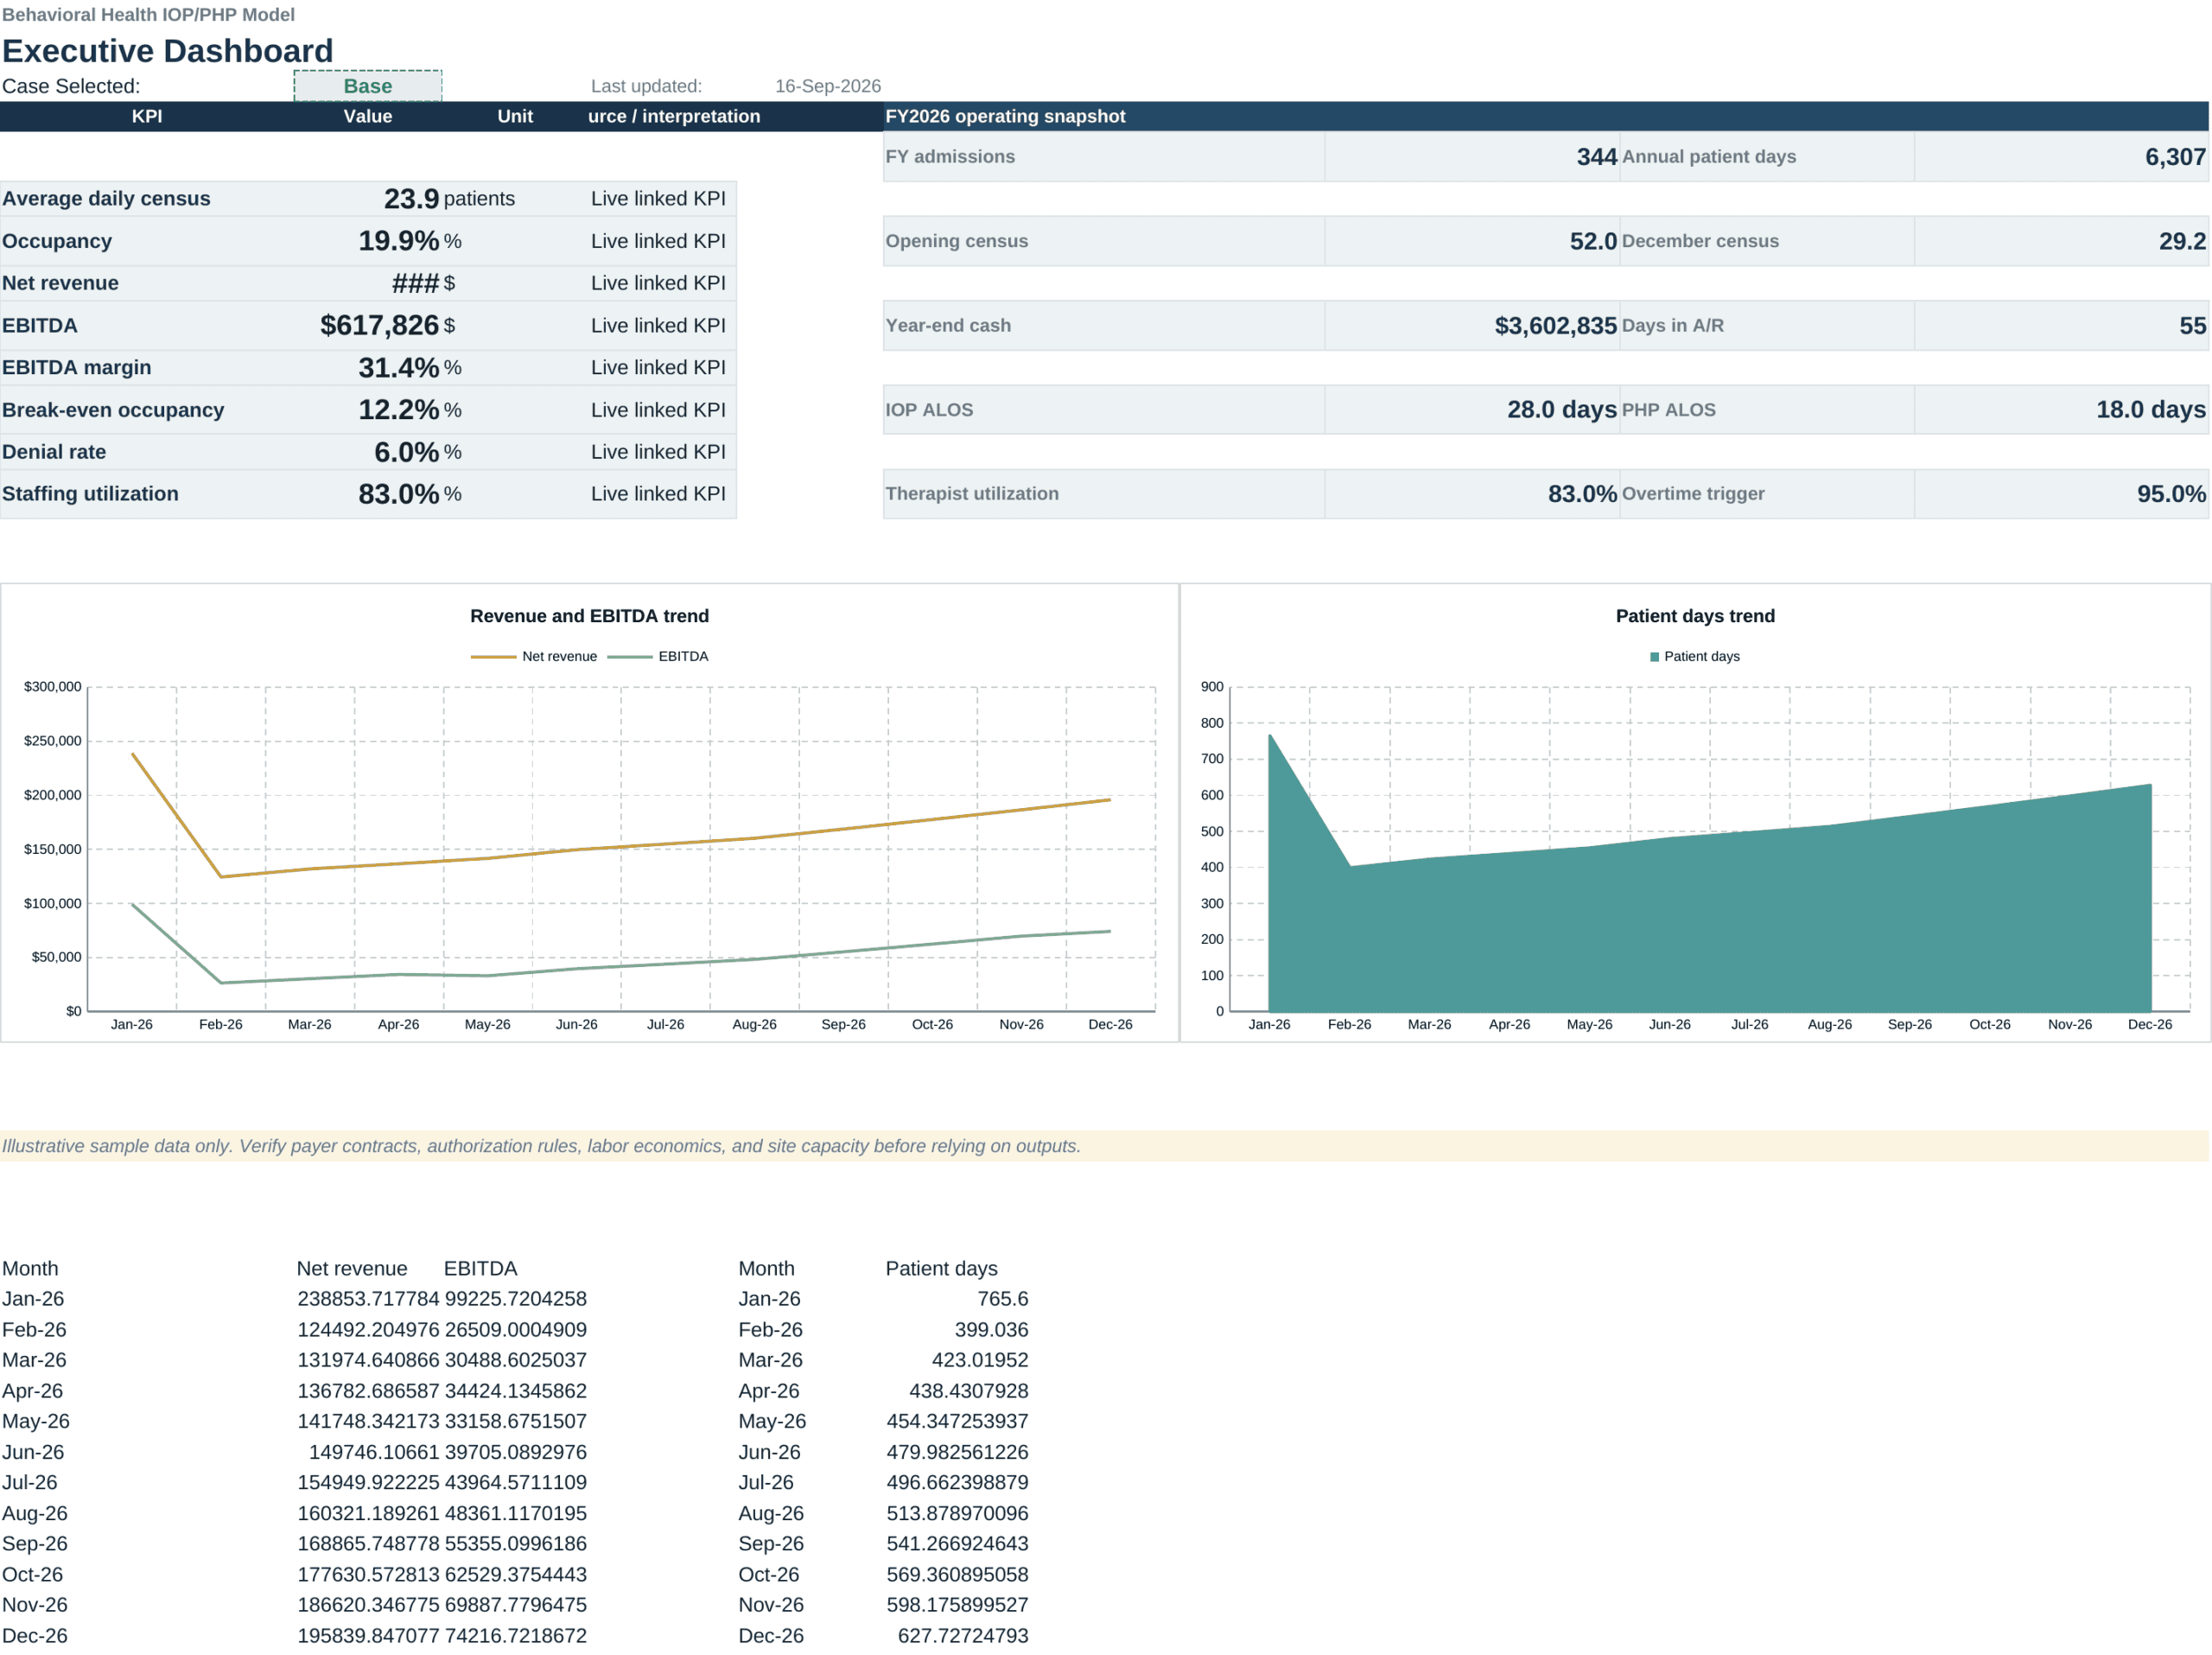
The Executive Dashboard provides a CFO-style summary of average daily census, occupancy, net revenue, EBITDA, EBITDA margin, break-even occupancy, denial rate, staffing utilization, annual admissions, annual patient days, opening and December census, year-end cash, days in A/R, IOP/PHP length of stay, therapist utilization, and the overtime trigger. It also includes revenue/EBITDA and patient-day trend visuals.
The Charts Appendix adds revenue-cycle and staffing/capacity views, including monthly net revenue, denial dollars, required versus actual therapists, and therapist utilization.
🗂️ Worksheet coverage
Cover introduces the model, navigation, version, selected case, and data status. Table of Contents maps every worksheet by purpose and primary user. Disclaimer & Disclosures contains the seller’s in-workbook use notes and data context.
Executive Dashboard summarizes the most decision-relevant operating, revenue, profitability, liquidity, break-even, and staffing KPIs. Assumptions & Inputs is the master control sheet for scenarios, census and capacity assumptions, LOS, staffing, compensation, costs, payer mix, reimbursement, contractual adjustments, denials, referral economics, monthly admissions, and flex inputs.
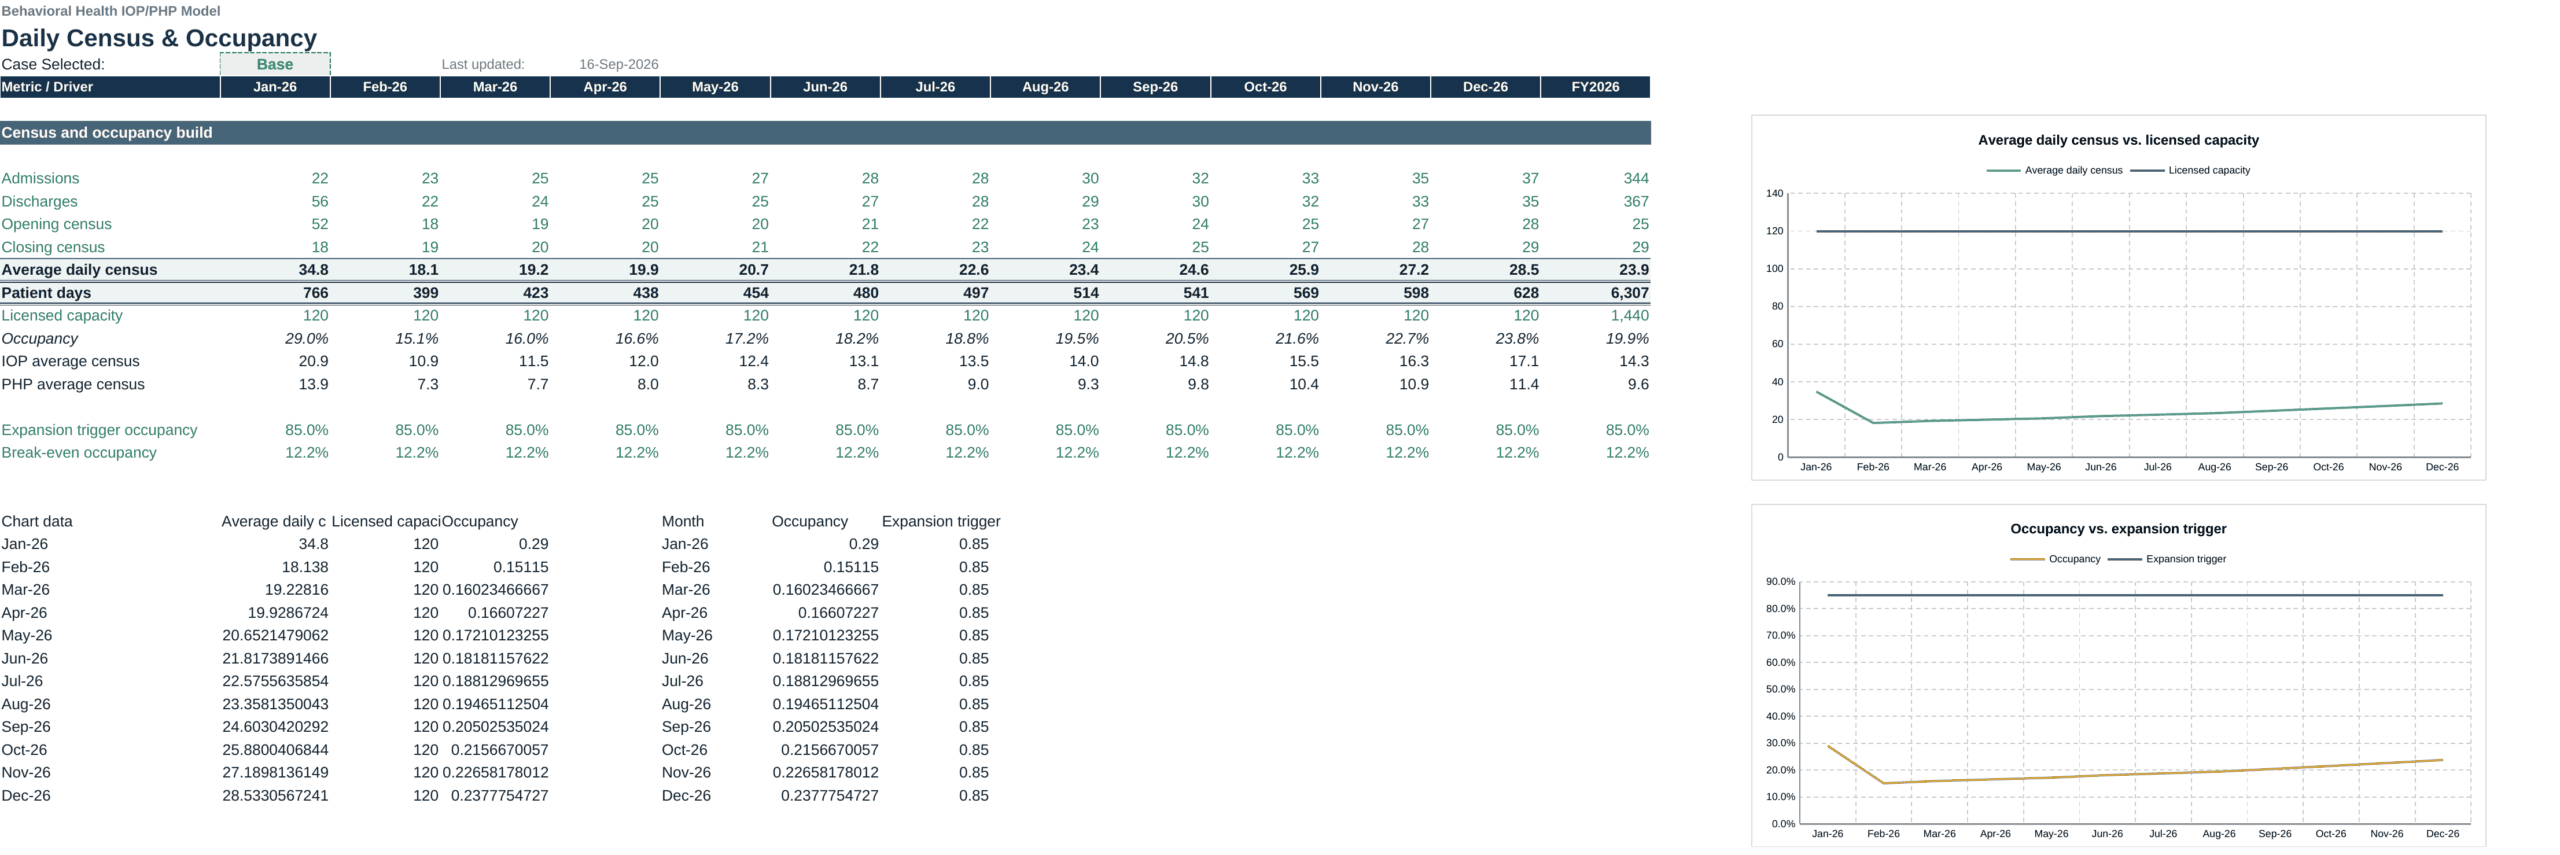
Daily Census & Occupancy models average daily census, patient days, licensed capacity, occupancy, IOP/PHP census, expansion trigger occupancy, and break-even occupancy. Admissions, Discharges & LOS builds the monthly census roll-forward, IOP/PHP admissions and discharges, opening/closing census, ALOS, and patient days.
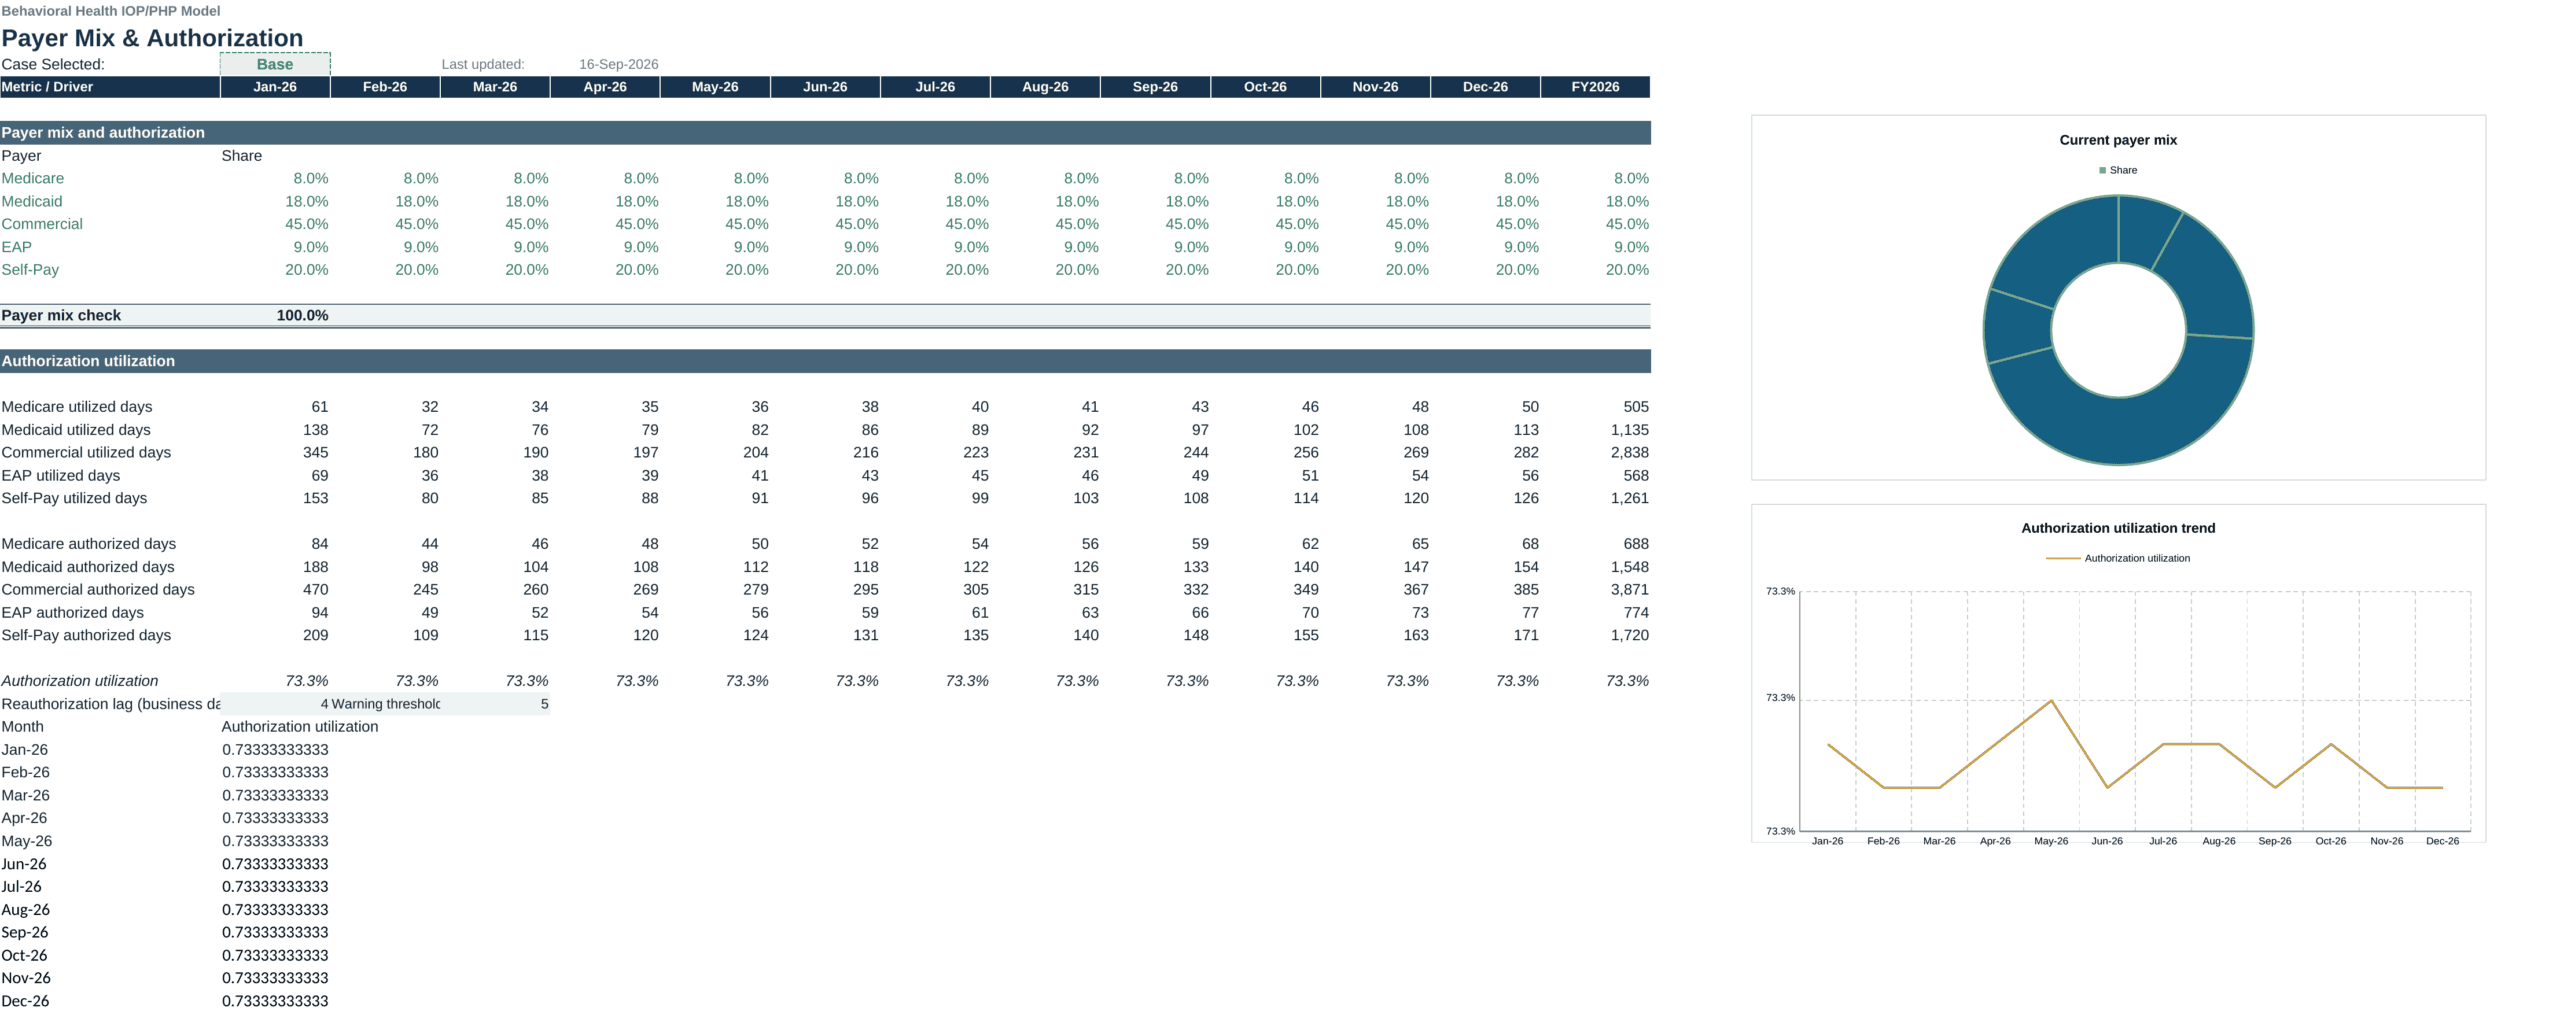
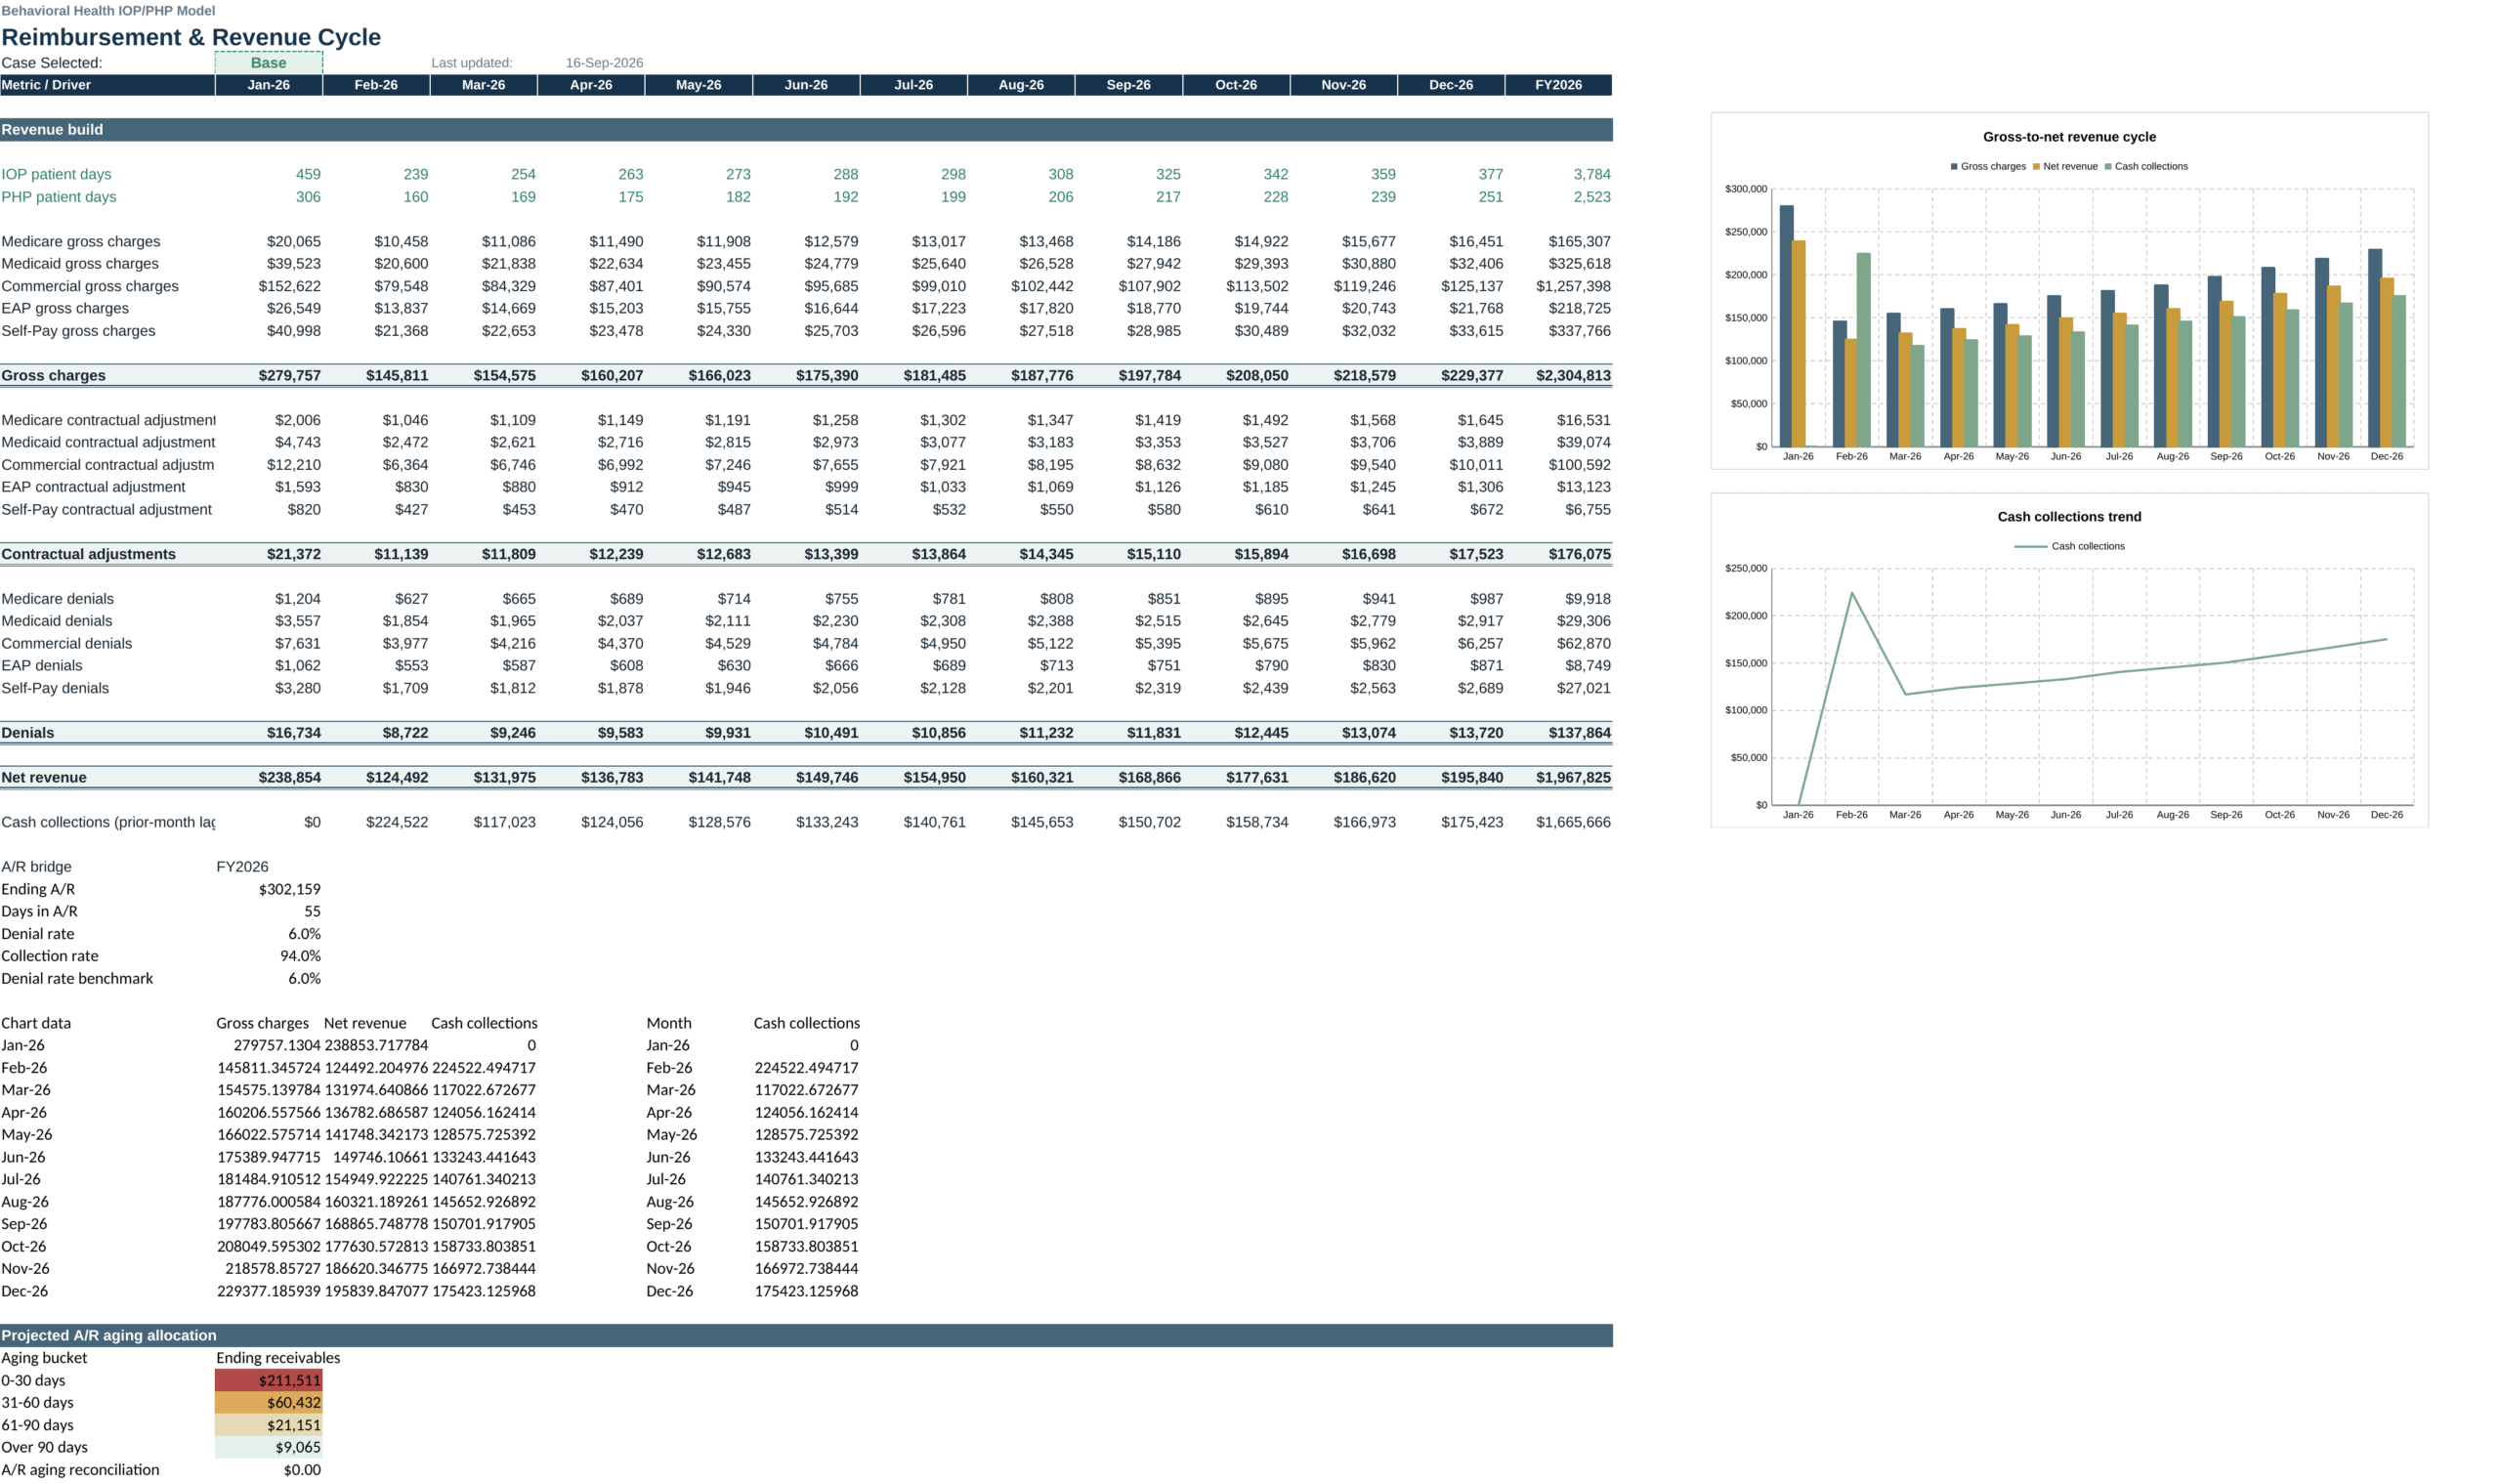
Payer Mix & Authorization allocates patient days by payer, compares utilized and authorized days, calculates authorization utilization, and tracks reauthorization timing. Reimbursement & Revenue Cycle converts IOP/PHP patient days into payer-level gross charges, contractual adjustments, denials, net revenue, lagged cash collections, ending A/R, days in A/R, collection rate, and projected receivables aging.
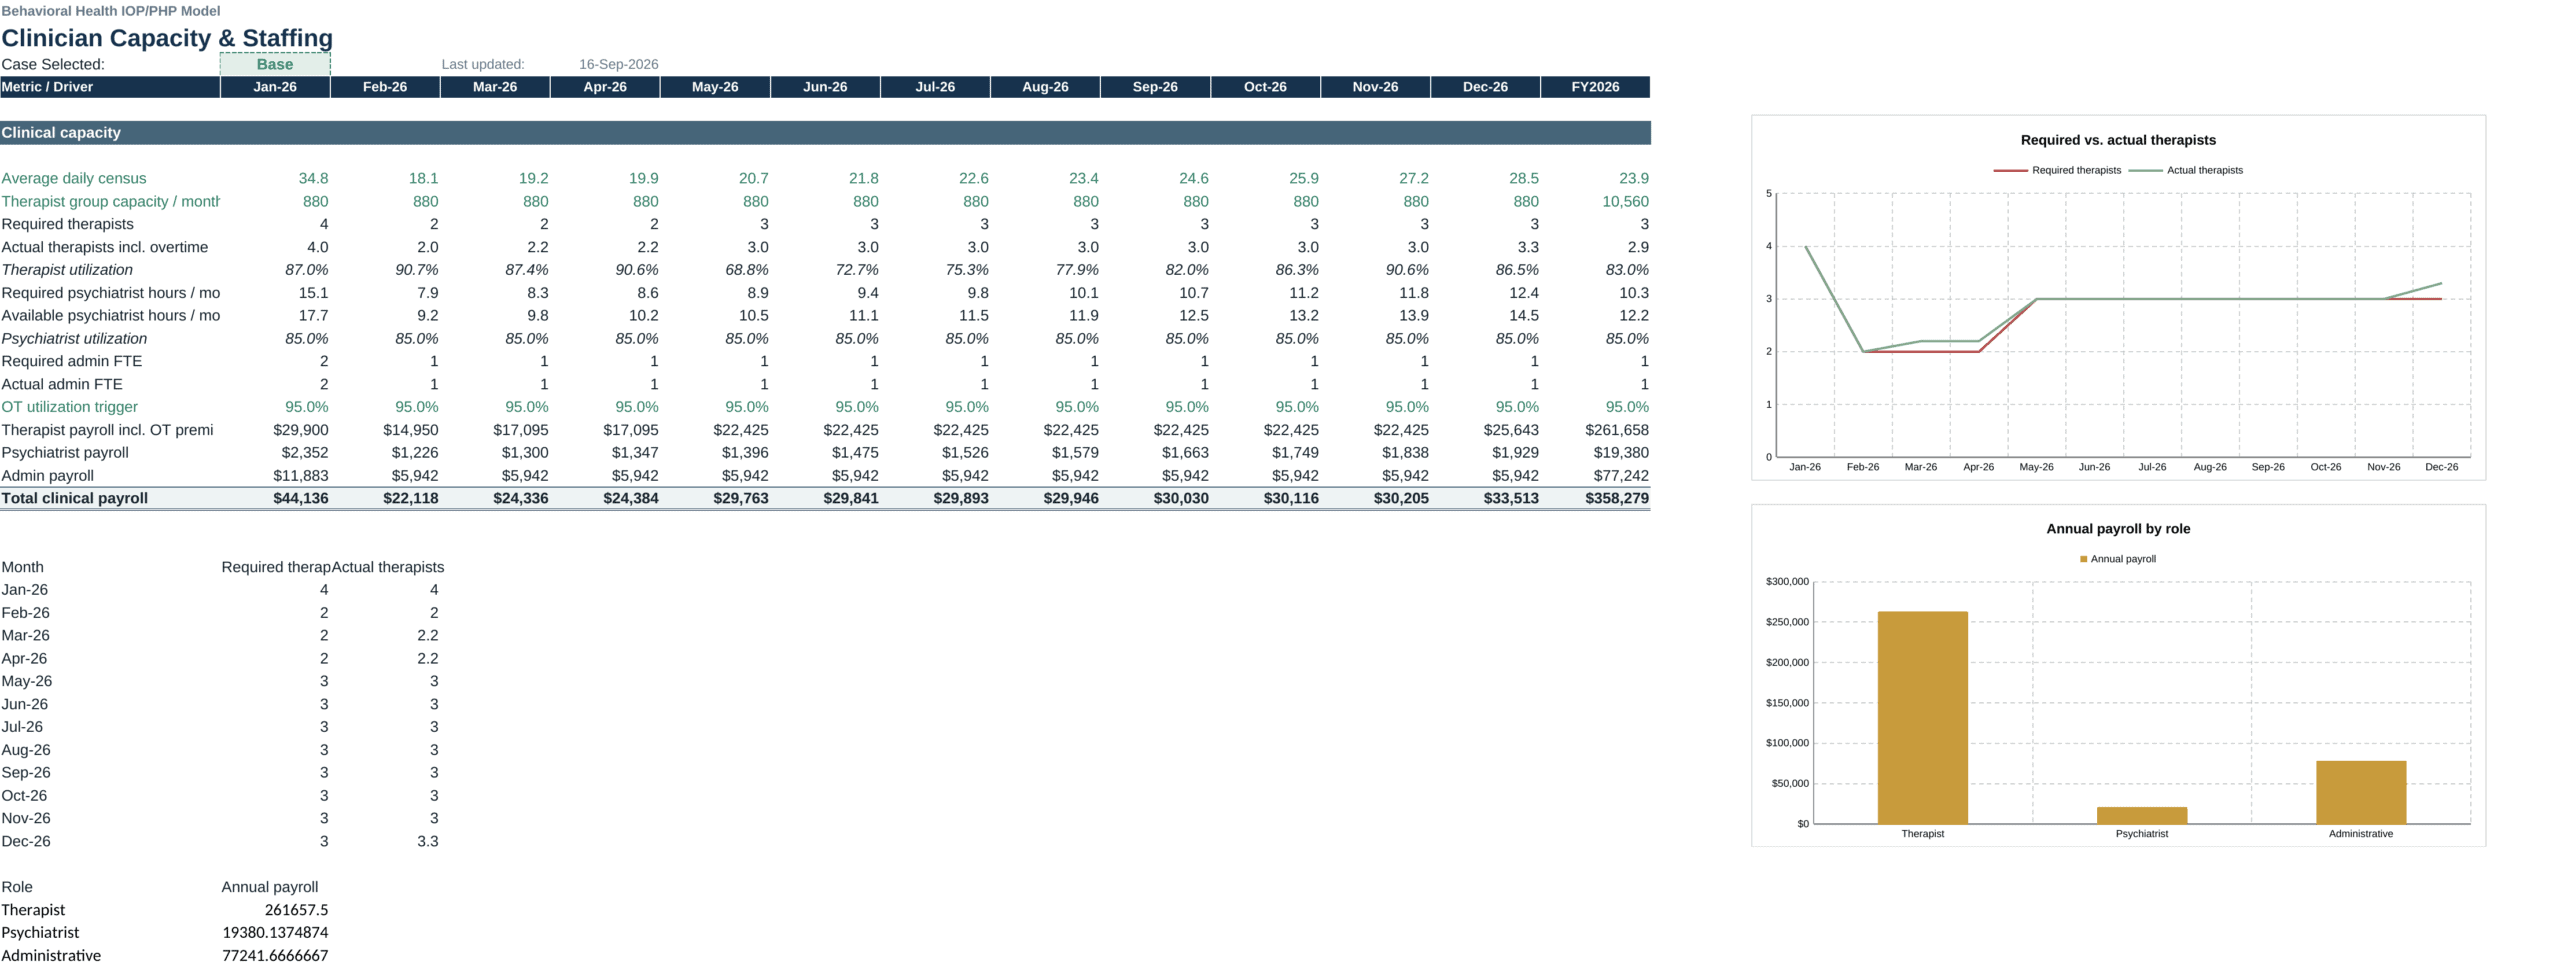
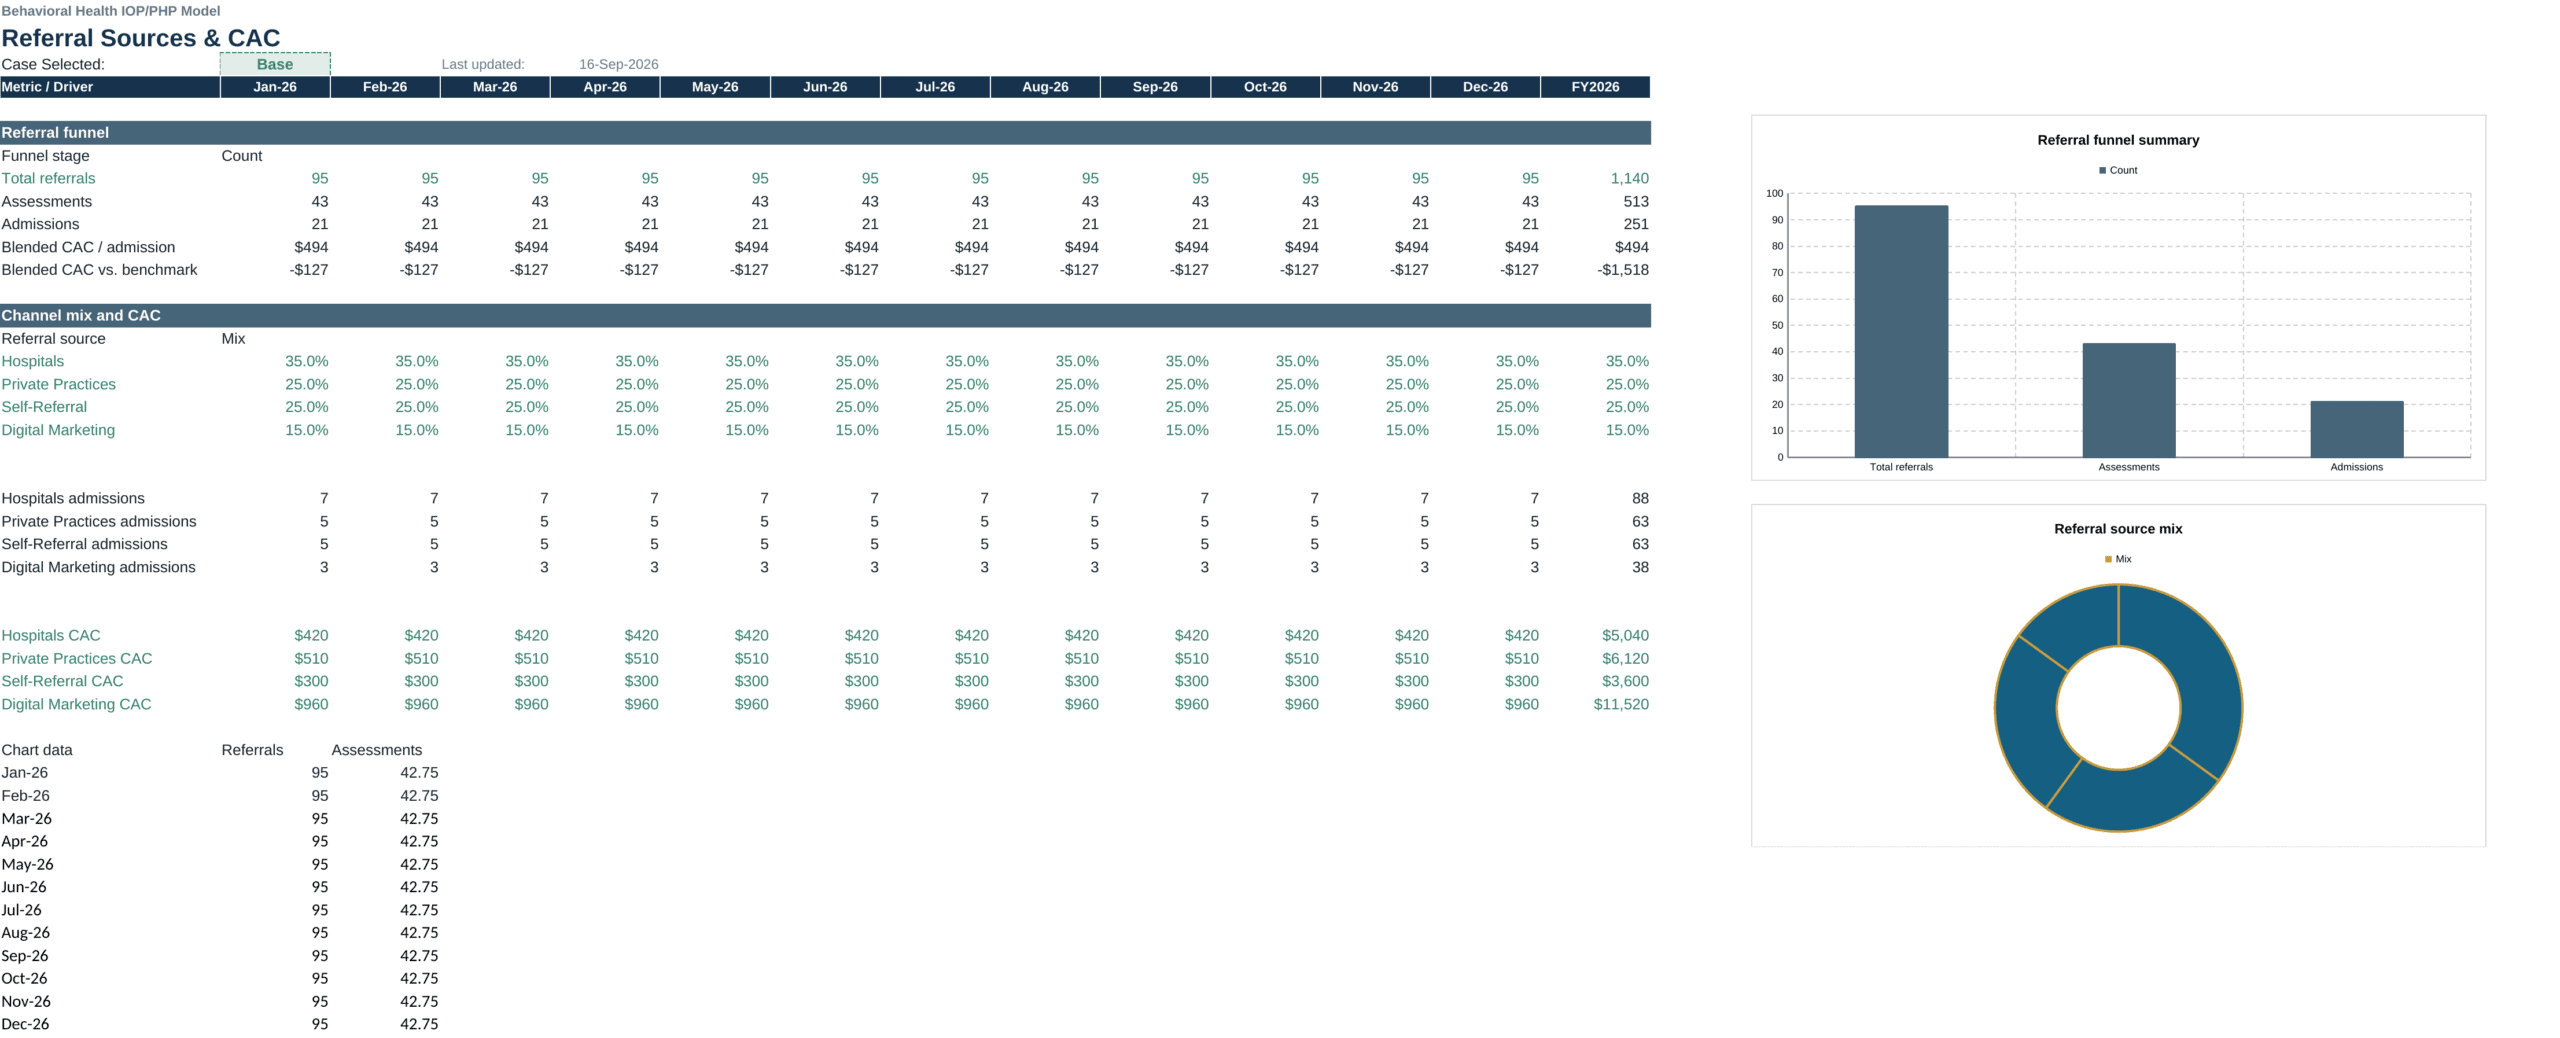
Clinician Capacity & Staffing estimates required therapists, actual therapists including overtime FTE, therapist utilization, psychiatrist hours and utilization, administrative FTE, and payroll. Referral Sources & CAC models referrals, assessments, admissions, blended CAC, channel mix, admissions by source, and source-level CAC.
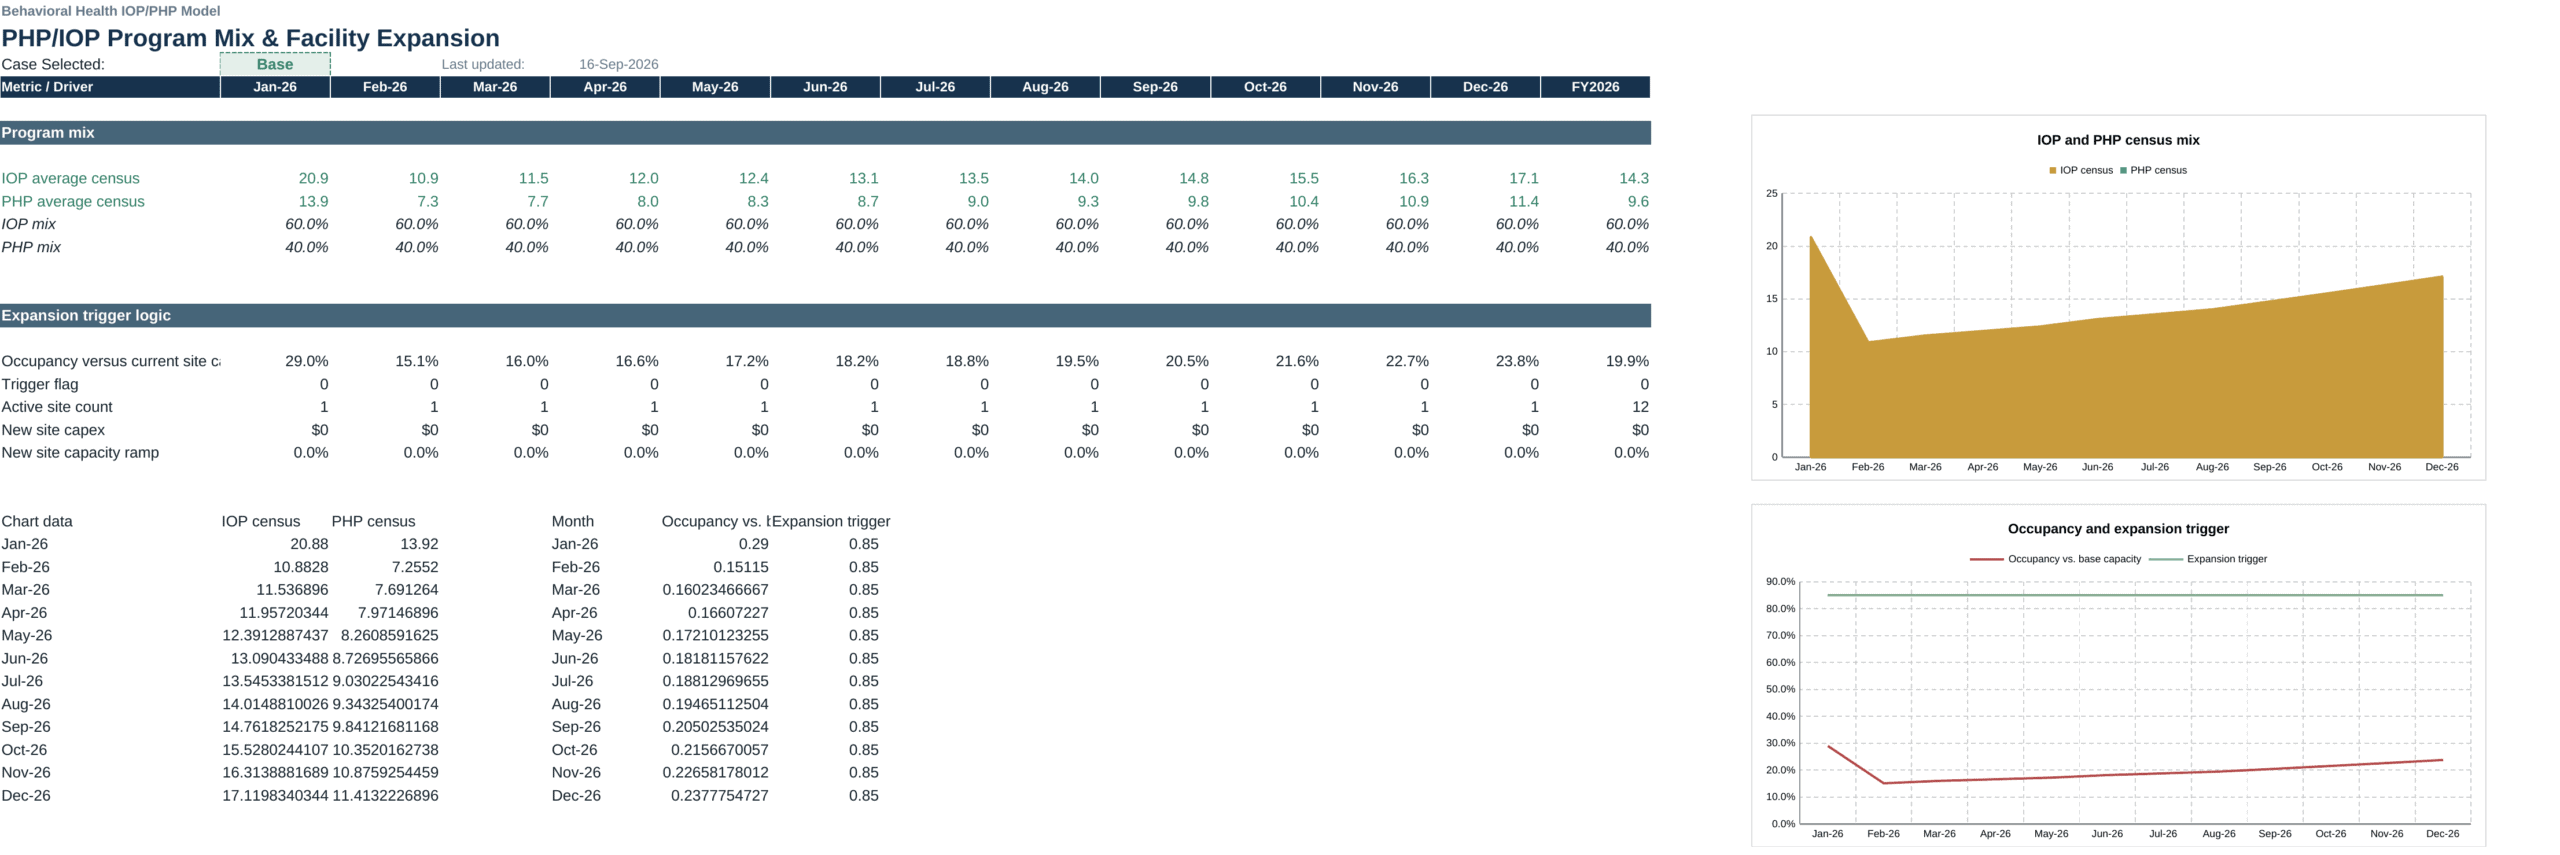
Program Mix & Site Expansion tracks IOP/PHP program mix, occupancy versus capacity, expansion triggers, active site count, new-site capex, and capacity ramp. Staffing & Cost Structure combines clinical payroll, patient-day variable costs, supplies, claims-processing costs, rent, utilities, other fixed opex, and total operating cost.
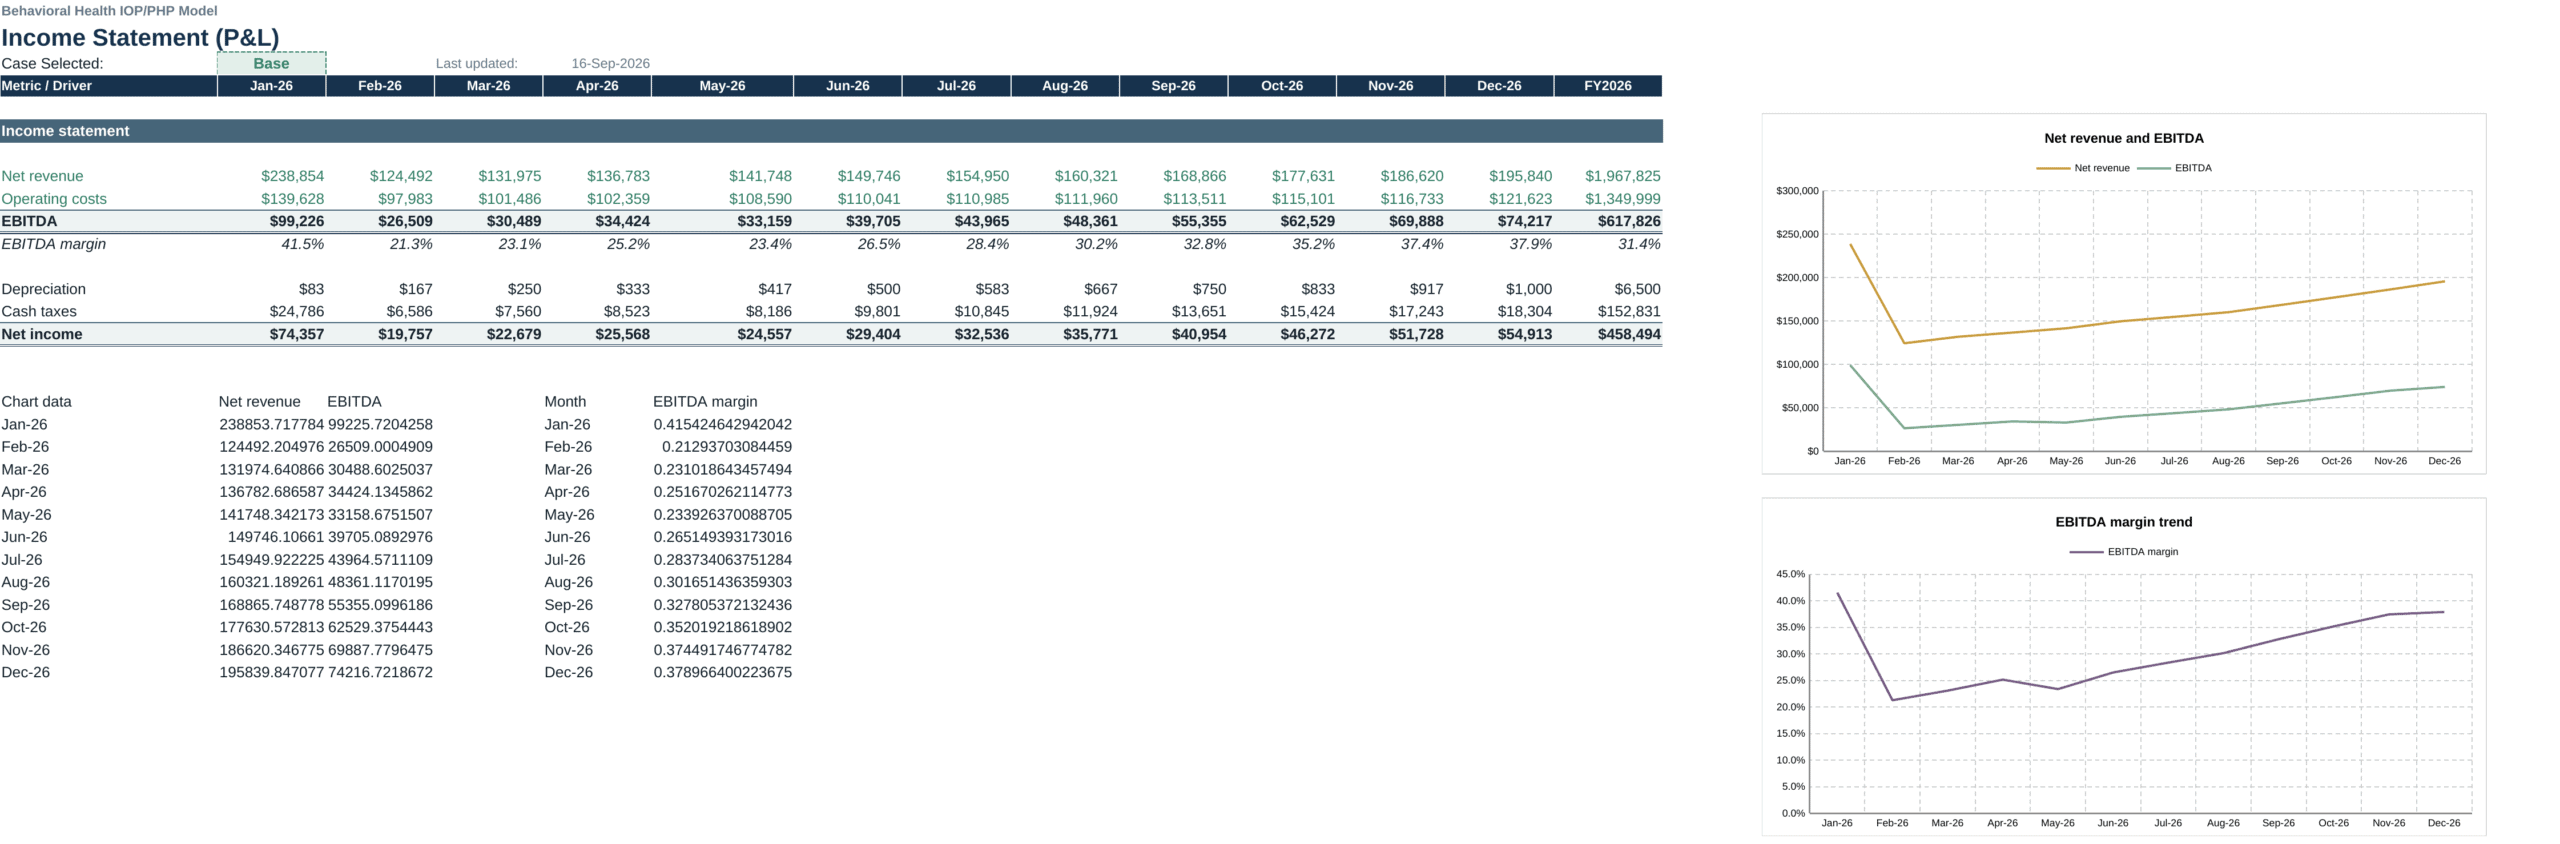
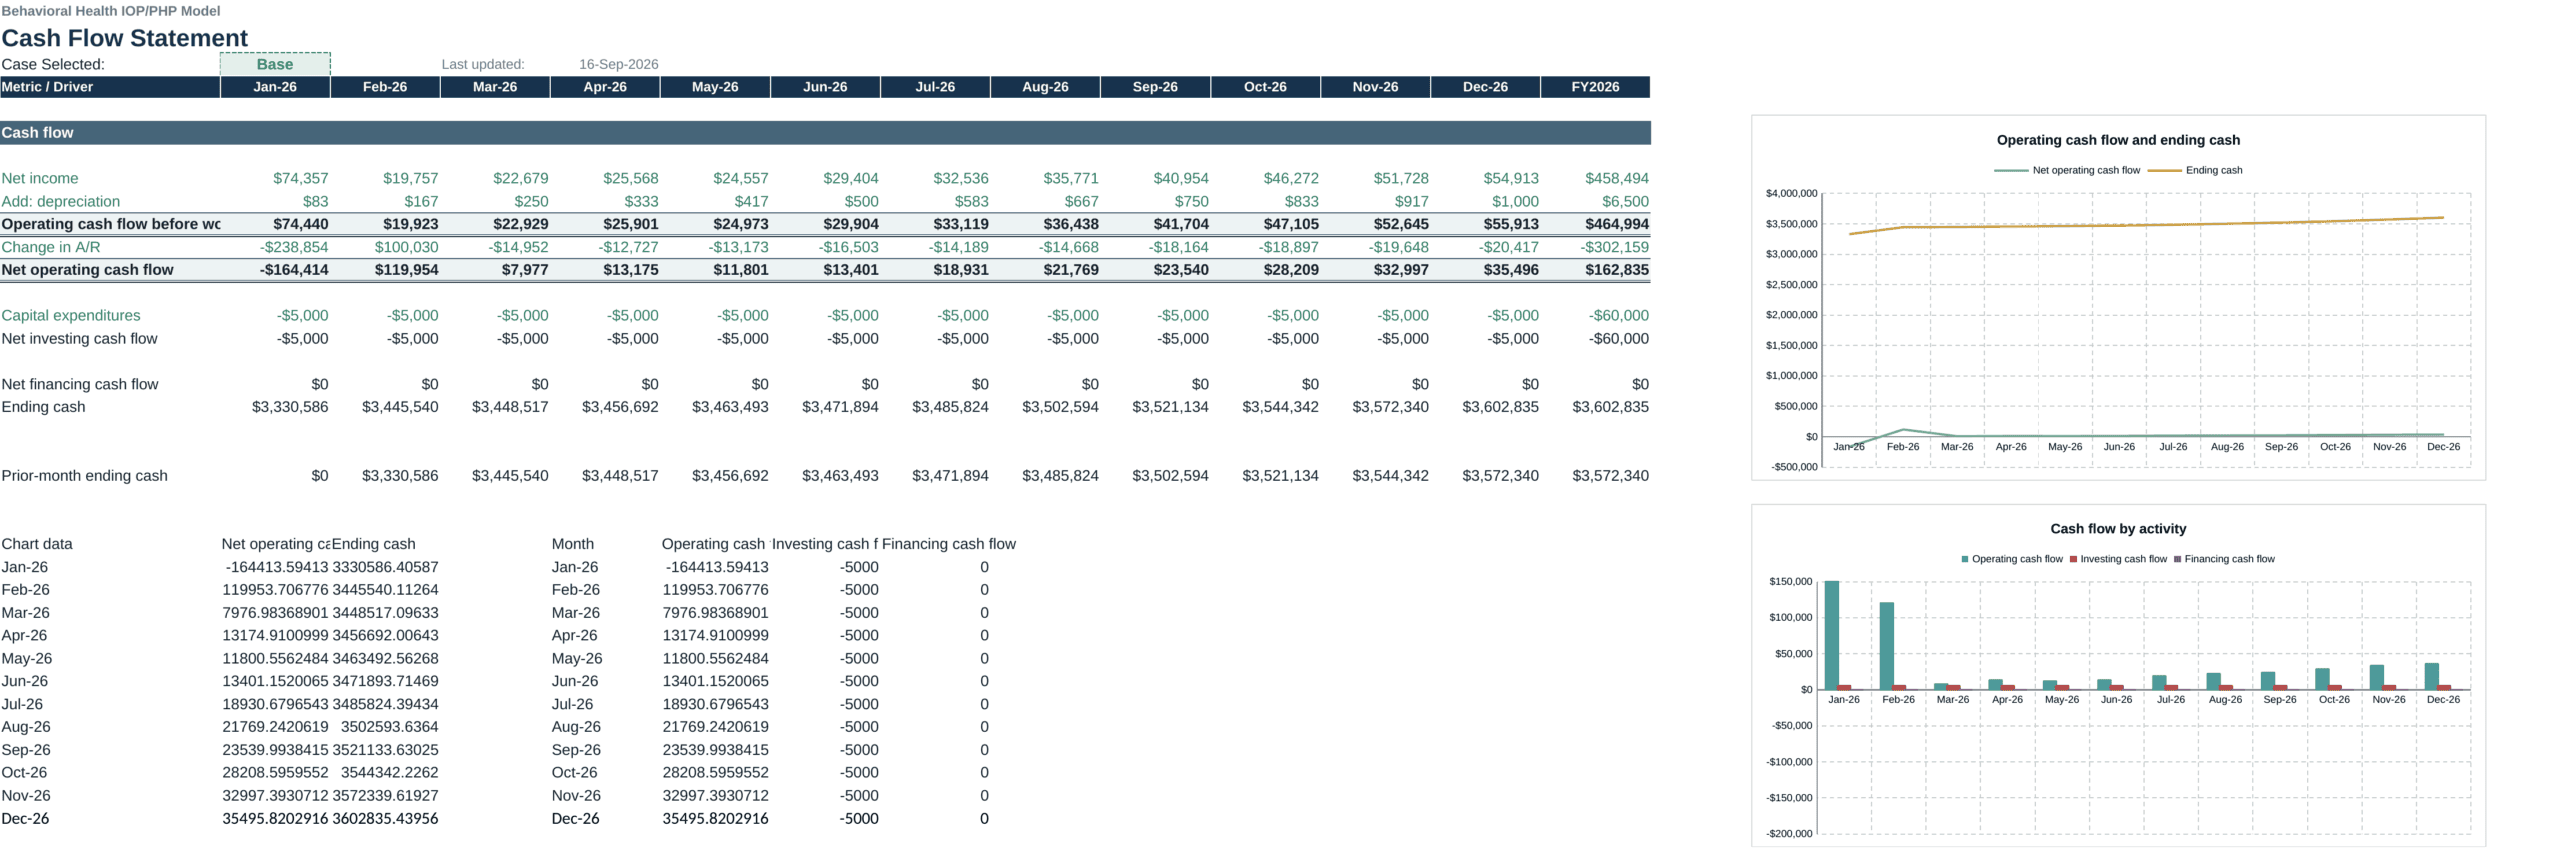
Income Statement (P&L) presents monthly and FY2026 net revenue, operating costs, EBITDA, EBITDA margin, depreciation, cash taxes, and net income. Cash Flow Statement converts earnings into operating cash flow, working-capital movement, capex, financing cash flow, and ending cash.
Break-Even & Contribution calculates payer-level net revenue per patient-day, weighted net revenue, contribution margin per patient-day, break-even occupancy, break-even daily census, and margin of safety. Sensitivity & Scenario Analysis provides a single-driver EBITDA matrix and tornado-style low/base/high analysis for census, payer mix, denials, clinical payroll, and IOP rates, plus seller-built stress-test outputs.
Audit & QA is the seller-created internal control sheet containing workbook checks, reconciliations, and build-time flex-test records; it is included as part of the supplied model and is not a Studio audit. Design System documents workbook styling, colors, fonts, and version information.
🔄 Scenarios and sensitivities
The model includes three operating cases: Conservative, Base, and Optimistic. Key assumptions can vary by case across capacity, program mix, LOS, census growth, staffing ratios, payroll, operating costs, A/R lag, denials, collections, referral conversion, payer mix, reimbursement rates, and other operating drivers.
Sensitivity analysis flexes selected drivers around the active case, including census, commercial payer mix, denial rate, clinical payroll, and IOP rate. The workbook also provides low/base/high EBITDA comparisons to show which assumptions have the greatest effect on profitability.
👥 Intended users
This model is suited to behavioral health operators, IOP/PHP founders, CFOs, finance teams, clinic administrators, revenue-cycle leaders, clinical leadership, lenders, investors, advisors, and acquisition teams that need a structured operating and financial view of an outpatient behavioral health platform.
📦 Delivered files
You receive the original seller-supplied .xlsx financial model, a 20-sheet full-workbook PDF preview. The Excel file is the client-ready working model; the PDF is previews of the supplied workbook.
Similar ProductsOther customers were also interested in...



 eFinancialModels
Electric Vehicle (EV) Charging Station Financial M...
With this comprehensive 5- or 10-year monthly tool, investors can assess the viability of setting up... Read more

Financial Model for Mobile App | Mobile App Busine...
The Mobile App Financial Plan Template in Excel allows you to develop financial projections when lau... Read more

 HenrySheykin
Food Truck Financial Model Excel Template
The Food Truck Financial Model helps entrepreneurs, founders, business owners, consultants, and anal... Read more

Green Hydrogen Production from Wind Energy Financi...
The Green Hydrogen from Wind Financial Model aims to comprehensively forecast a horizon of 40 years ... Read more

Simple Mutual Non-Disclosure Agreement Template
Protect your business secrets with ease using our Simple Mutual Non-Disclosure Agreement Template. S... Read more

Solar Energy Financial Model
The Solar Energy Financial Model Spreadsheet Template in Excel assists you in preparing a sophistica... Read more

 Peter Graf
The Customer-Centric Financial Model for Restauran...
Starting a restaurant without a financial plan is like driving a car blindfolded. You wouldn´t do i... Read more
You must log in to submit a review.