
0 ITEMS

Battery Storage (BESS) Arbitrage Financial Model with Real 2025 Hourly Prices – 8 European Markets
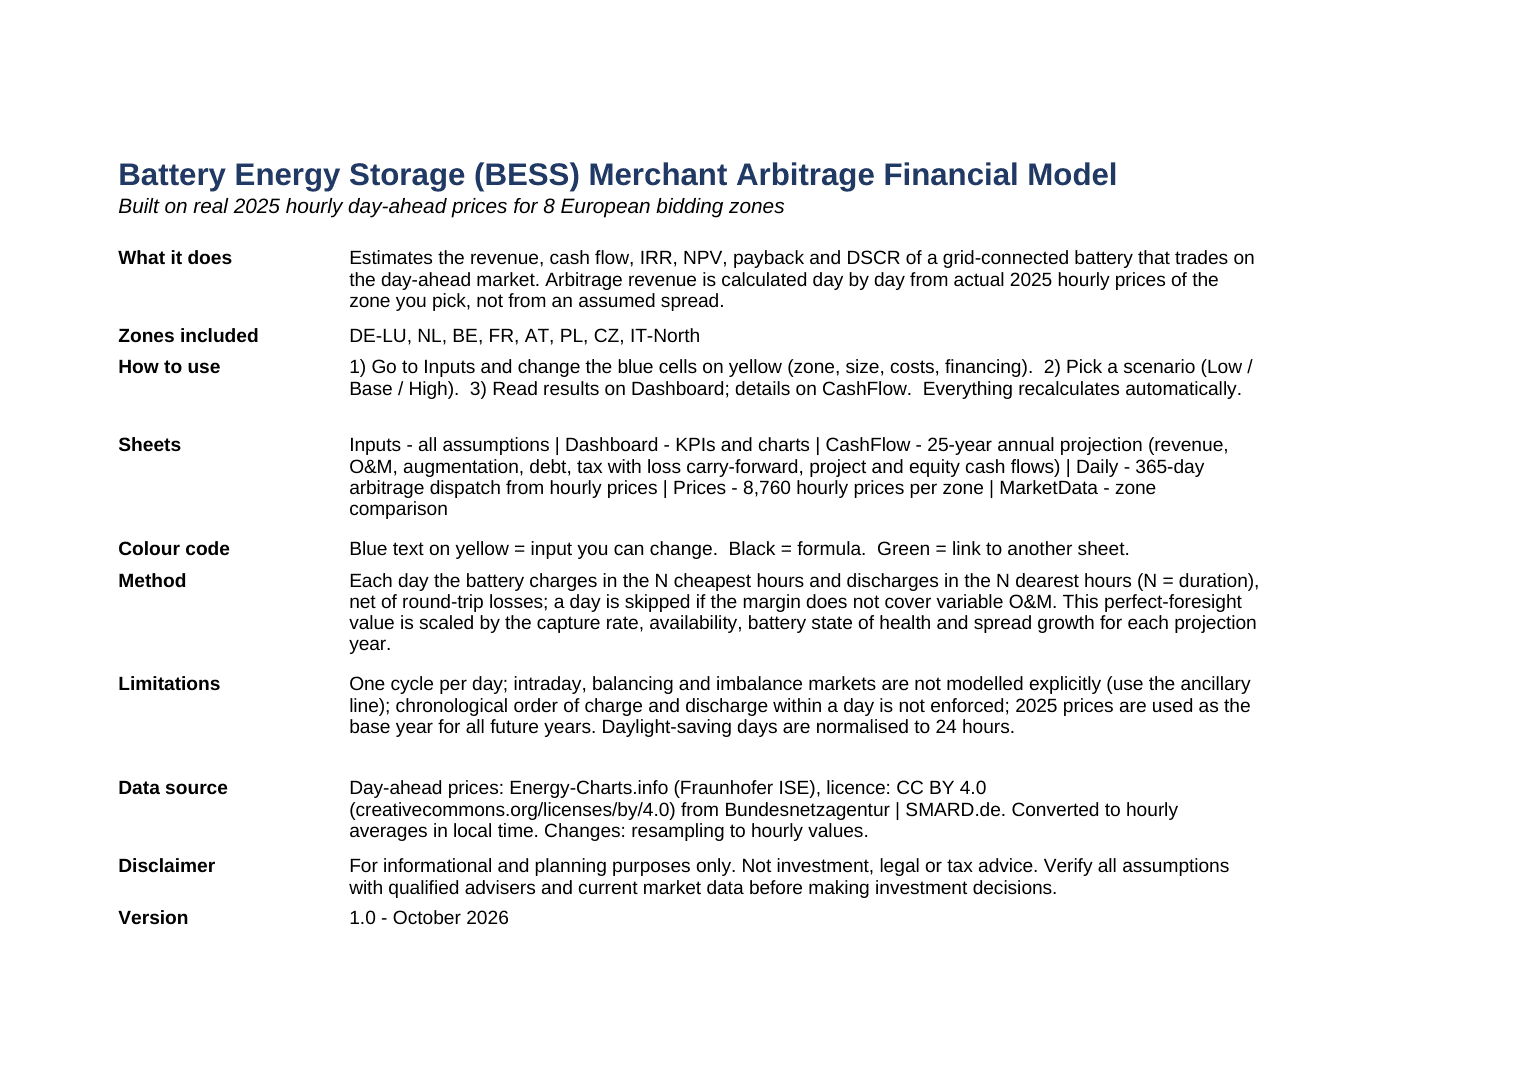
A battery energy storage (BESS) financial model built on real 2025 hourly day-ahead prices for eight European markets (DE-LU, NL, BE, FR, AT, PL, CZ, IT-North). It dispatches the battery day by day to calculate arbitrage revenue, then projects 25 years of cash flows with degradation, debt (DSCR), tax, project and equity IRR, NPV and payback. Excel, no macros, fully unlocked.
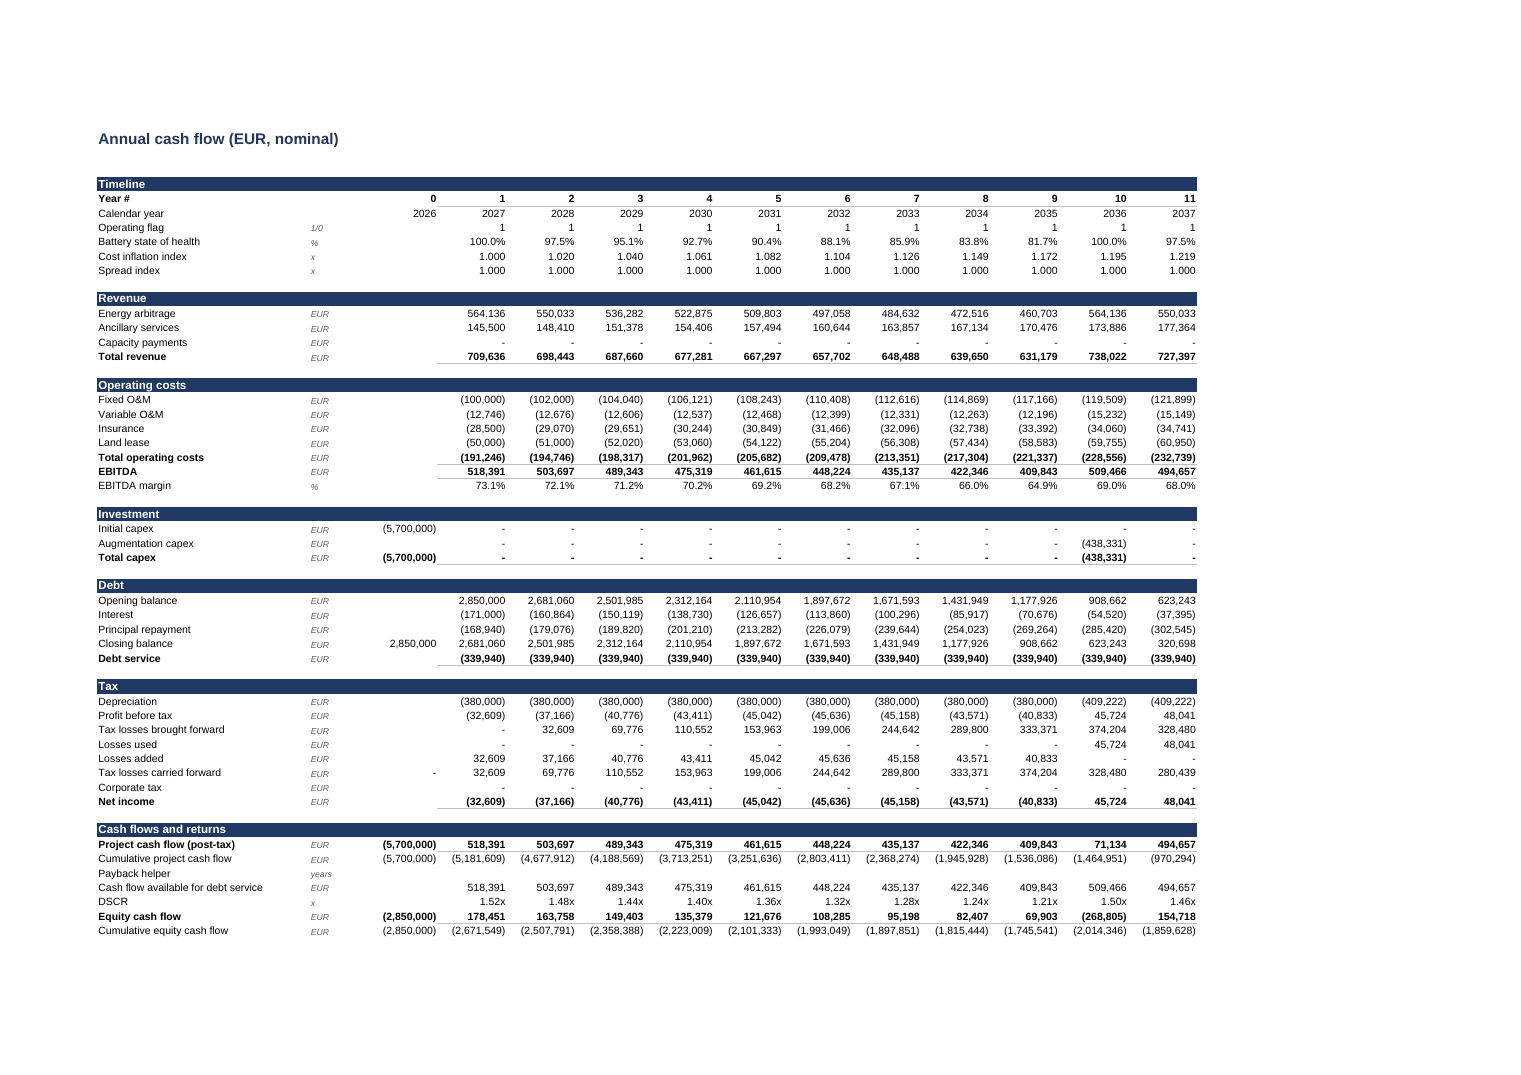
Most BESS models ask you to guess the price spread. This one calculates it.
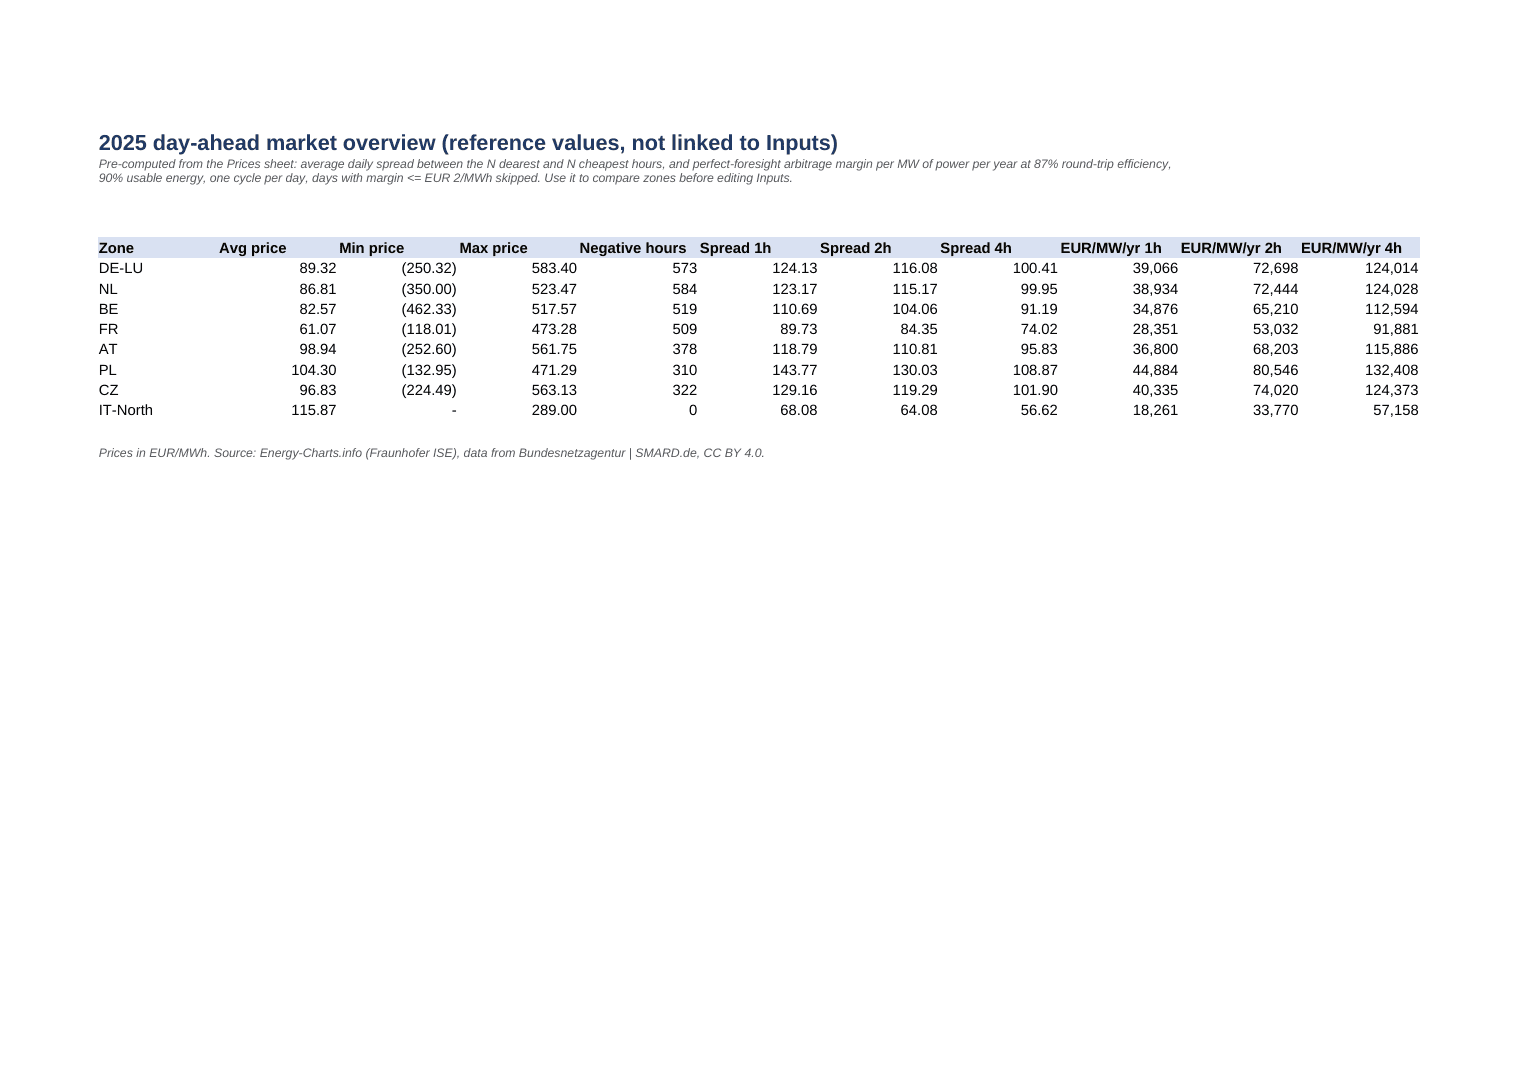
The model includes the full year of 2025 hourly day-ahead prices for eight European bidding zones (Germany-Luxembourg, Netherlands, Belgium, France, Austria, Poland, Czech Republic and Northern Italy). Pick a zone and a battery size, and the model dispatches the battery day by day against real prices to calculate arbitrage revenue, then projects 25 years of cash flows.
What you get
- Daily dispatch for 365 days: charge in the cheapest hours, discharge in the most expensive, net of round-trip losses and variable O&M
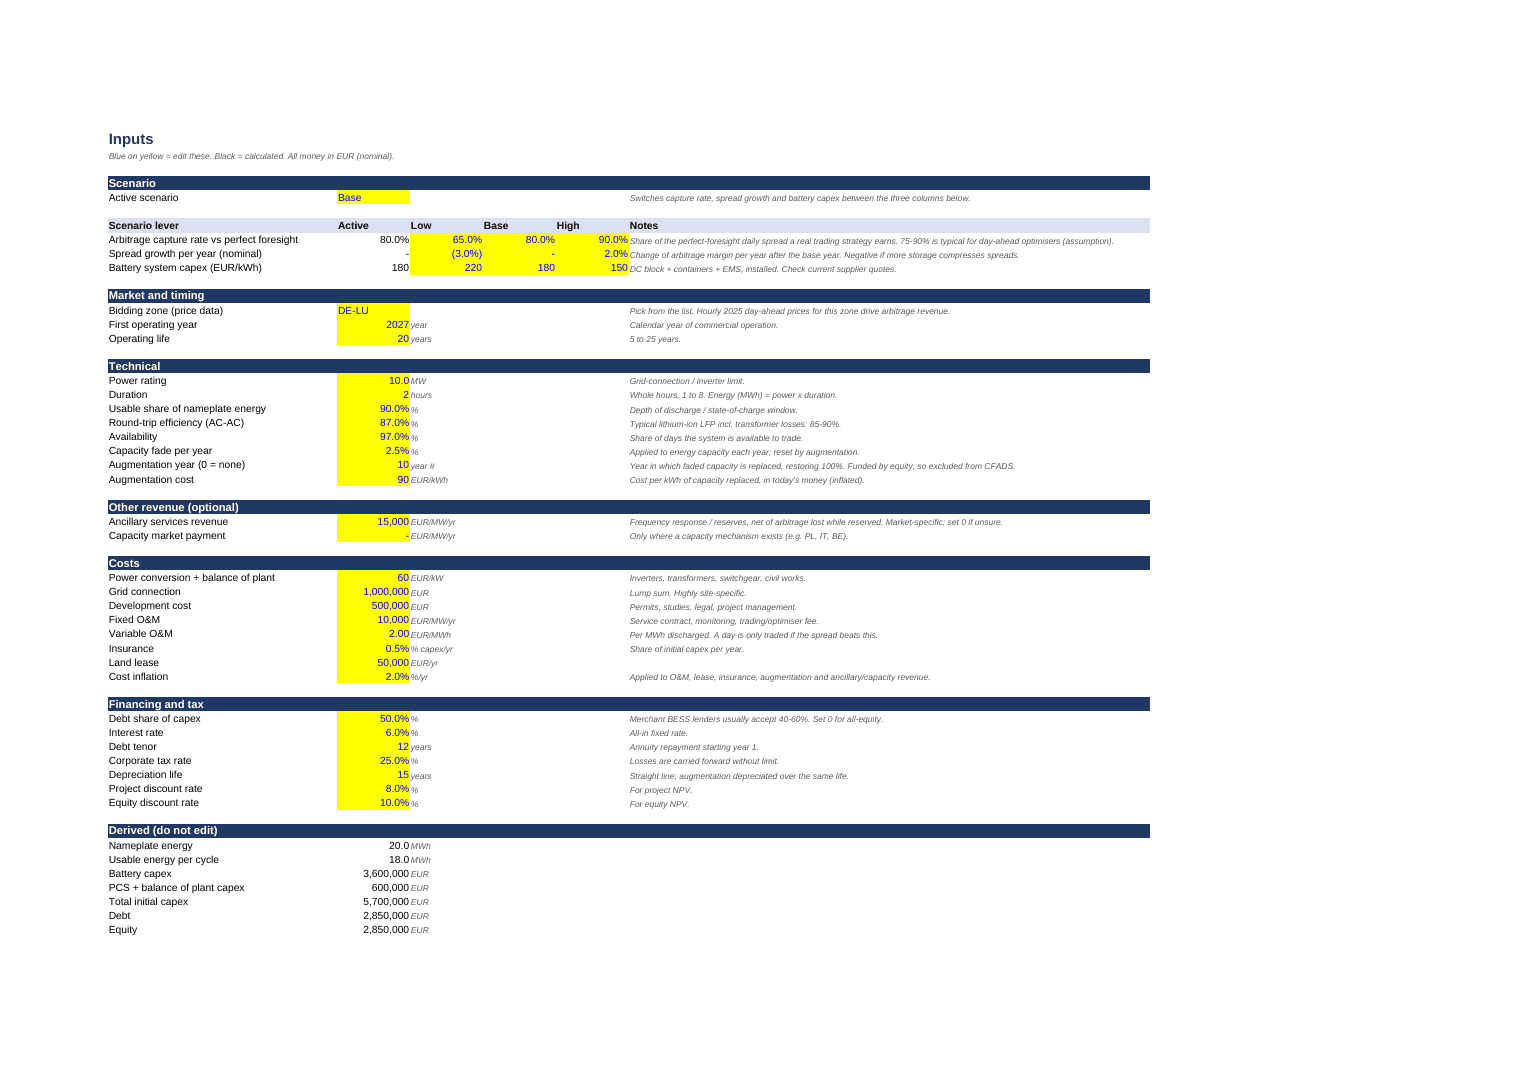
- Low / Base / High scenarios (capture rate, spread growth, battery capex)
- Battery degradation and augmentation
- Ancillary services and capacity market revenue lines
- Capex build-up, fixed and variable O&M, insurance, land lease, inflation
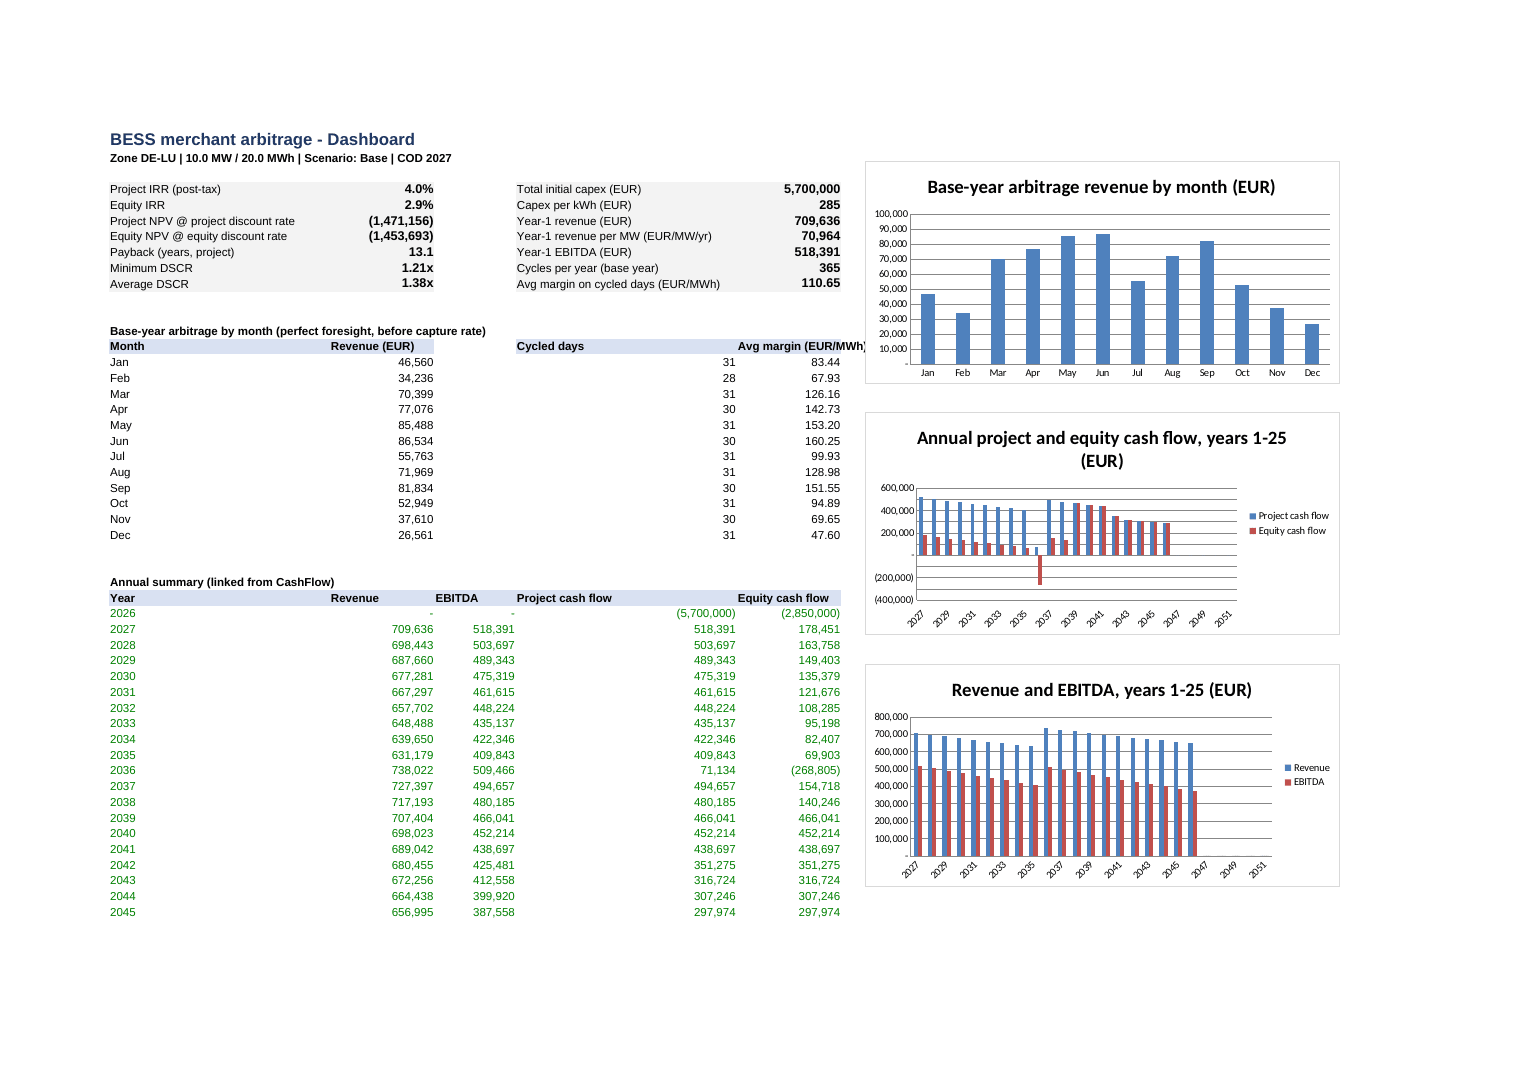
- Annuity debt with DSCR, corporate tax with loss carry-forward, straight-line depreciation
- Project and equity IRR, NPV, payback, minimum and average DSCR
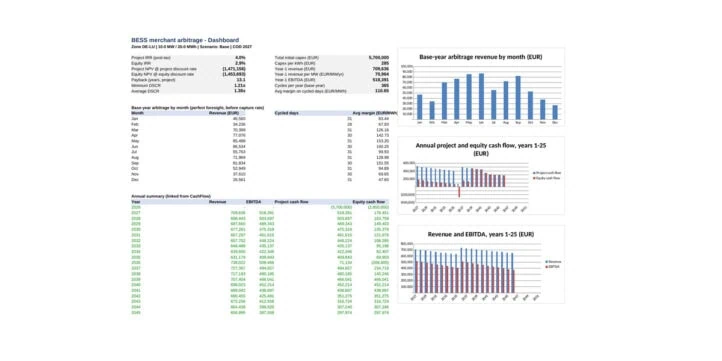
- Dashboard with KPIs and charts; monthly revenue profile
- Market comparison of all eight zones (average spreads and revenue per MW for 1, 2 and 4-hour systems)
How to use it
All inputs sit on one Inputs sheet and are colour-coded. Select the bidding zone, enter the power (MW) and duration (hours), and adjust round-trip efficiency, availability and capture rate. Then set capex, operating costs, financing and tax assumptions. Every result updates automatically: the Daily sheet shows the daily charge and discharge decisions, the CashFlow sheet shows the 25-year projection, and the Dashboard summarises returns and debt metrics. Switch scenarios with a single selector to see how sensitive the project is to spreads and capex.
Why this model
Merchant battery revenue depends on real price volatility, which an assumed average spread cannot capture. Using actual hourly prices gives a defensible starting point for site screening, investment committee discussions and lender conversations. The model has about 19,000 formulas and no hard-coded results, and its revenue calculation has been checked against an independent Python implementation.
Who it is for: developers screening sites, investors and lenders checking merchant assumptions, consultants and students learning BESS economics.
Format: Excel (.xlsx), no macros, fully unlocked formulas, colour-coded inputs. Works in Microsoft Excel and LibreOffice.
Data source: Energy-Charts.info (Fraunhofer ISE), Bundesnetzagentur | SMARD.de, CC BY 4.0.
Limitations: one cycle per day on the day-ahead market; intraday and balancing markets are represented by a single ancillary revenue input. For planning purposes only, not investment advice.
Similar ProductsOther customers were also interested in...



 eFinancialModels
Electric Vehicle (EV) Charging Station Financial M...
With this comprehensive 5- or 10-year monthly tool, investors can assess the viability of setting up... Read more

Financial Model for Mobile App | Mobile App Busine...
The Mobile App Financial Plan Template in Excel allows you to develop financial projections when lau... Read more

 HenrySheykin
Food Truck Financial Model Excel Template
The Food Truck Financial Model helps entrepreneurs, founders, business owners, consultants, and anal... Read more

Green Hydrogen Production from Wind Energy Financi...
The Green Hydrogen from Wind Financial Model aims to comprehensively forecast a horizon of 40 years ... Read more

Simple Mutual Non-Disclosure Agreement Template
Protect your business secrets with ease using our Simple Mutual Non-Disclosure Agreement Template. S... Read more

Solar Energy Financial Model
The Solar Energy Financial Model Spreadsheet Template in Excel assists you in preparing a sophistica... Read more

 Peter Graf
The Customer-Centric Financial Model for Restauran...
Starting a restaurant without a financial plan is like driving a car blindfolded. You wouldn´t do i... Read more
You must log in to submit a review.