
0 ITEMS

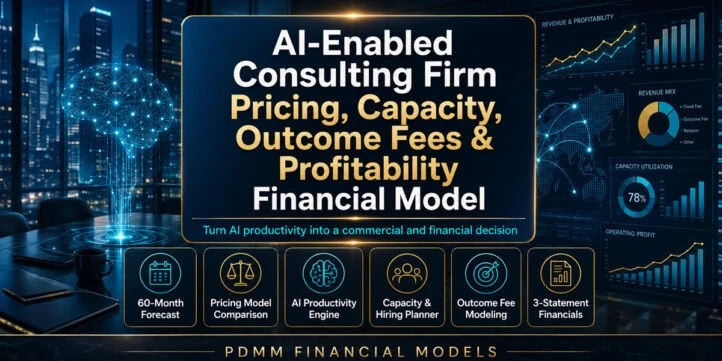
AI-Enabled Consulting Firm Pricing, Capacity, Outcome Fees & Profitability Financial Model
Turn AI productivity into a commercial and financial decision Consulting firms are being forced to answer a difficult question: when AI reduces delivery hours, who captures the value? A firm can keep the efficiency as margin, lower the client price, serve more work with the same team, change its staffing pyramid, or move toward fixed, retainer, hybrid and outcome-linked commercial models. Each choice affects utilization, project margin, hiring, revenue quality, working capital, EBITDA and cash in a different way.





🤖 AI-Enabled Consulting Firm Pricing, Capacity, Outcome Fees & Profitability Financial Model
Turn AI productivity into a commercial and financial decision
Consulting firms are being forced to answer a difficult question: when AI reduces delivery hours, who captures the value? A firm can keep the efficiency as margin, lower the client price, serve more work with the same team, change its staffing pyramid, or move toward fixed, retainer, hybrid and outcome-linked commercial models. Each choice affects utilization, project margin, hiring, revenue quality, working capital, EBITDA and cash in a different way.
This Excel model connects those choices in one integrated 60-month decision system. It is designed for boutique consulting firms, advisory practices, AI and digital-transformation consultancies, independent consultants scaling into teams, and finance or operations leaders responsible for professional-services economics. The workbook is populated with editable sample assumptions so users can immediately understand the mechanics and then replace the examples with their own firm data.
🎯 Decisions the model helps you make
- Compare T&M, fixed fee, retainer/subscription, hybrid and outcome/shared-savings pricing on a common economic basis.
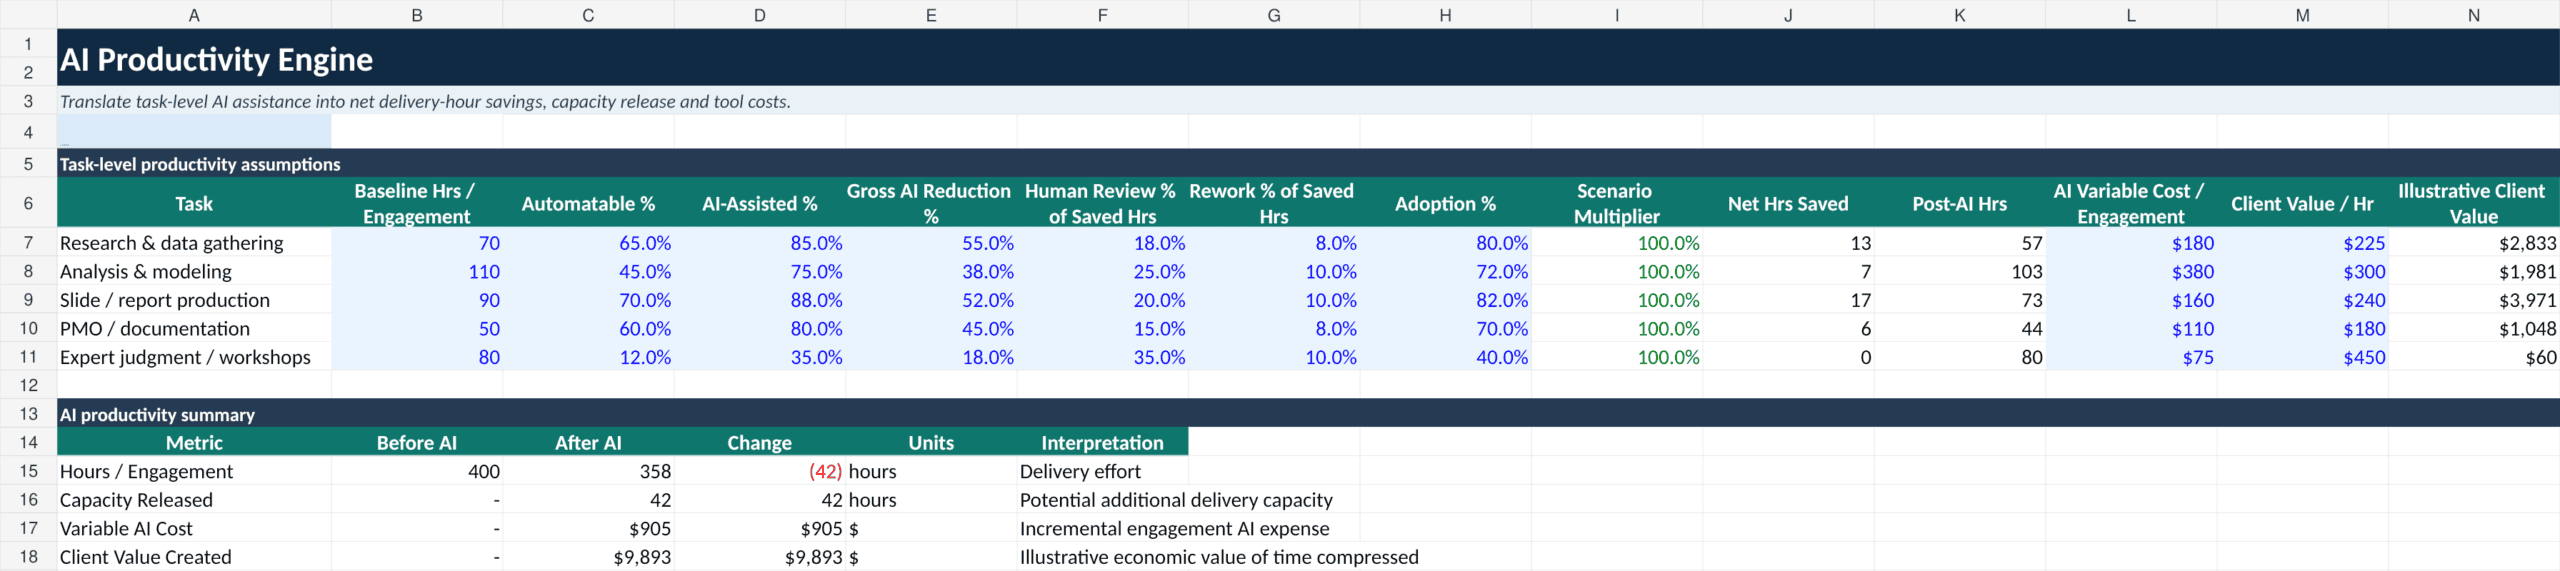
- Quantify how AI-assisted delivery changes baseline hours, review effort, rework, tool cost, post-AI hours and client value.
- Decide how much AI-driven price compression the firm can absorb by pricing structure.
- Test whether current staffing can support backlog and probability-weighted pipeline without breaching utilization thresholds.
- Estimate hiring requirements, recruitment starts, onboarding productivity, attrition and contractor overflow.
- Evaluate service-line and engagement contribution margins against target gross margins.
- Model expected outcome fees using measured client value, value-share percentages, success probability and collection realization.
- Understand how revenue, delivery costs, operating expenses and working capital flow into EBITDA, cash and the balance sheet.
🧭 Model workflow
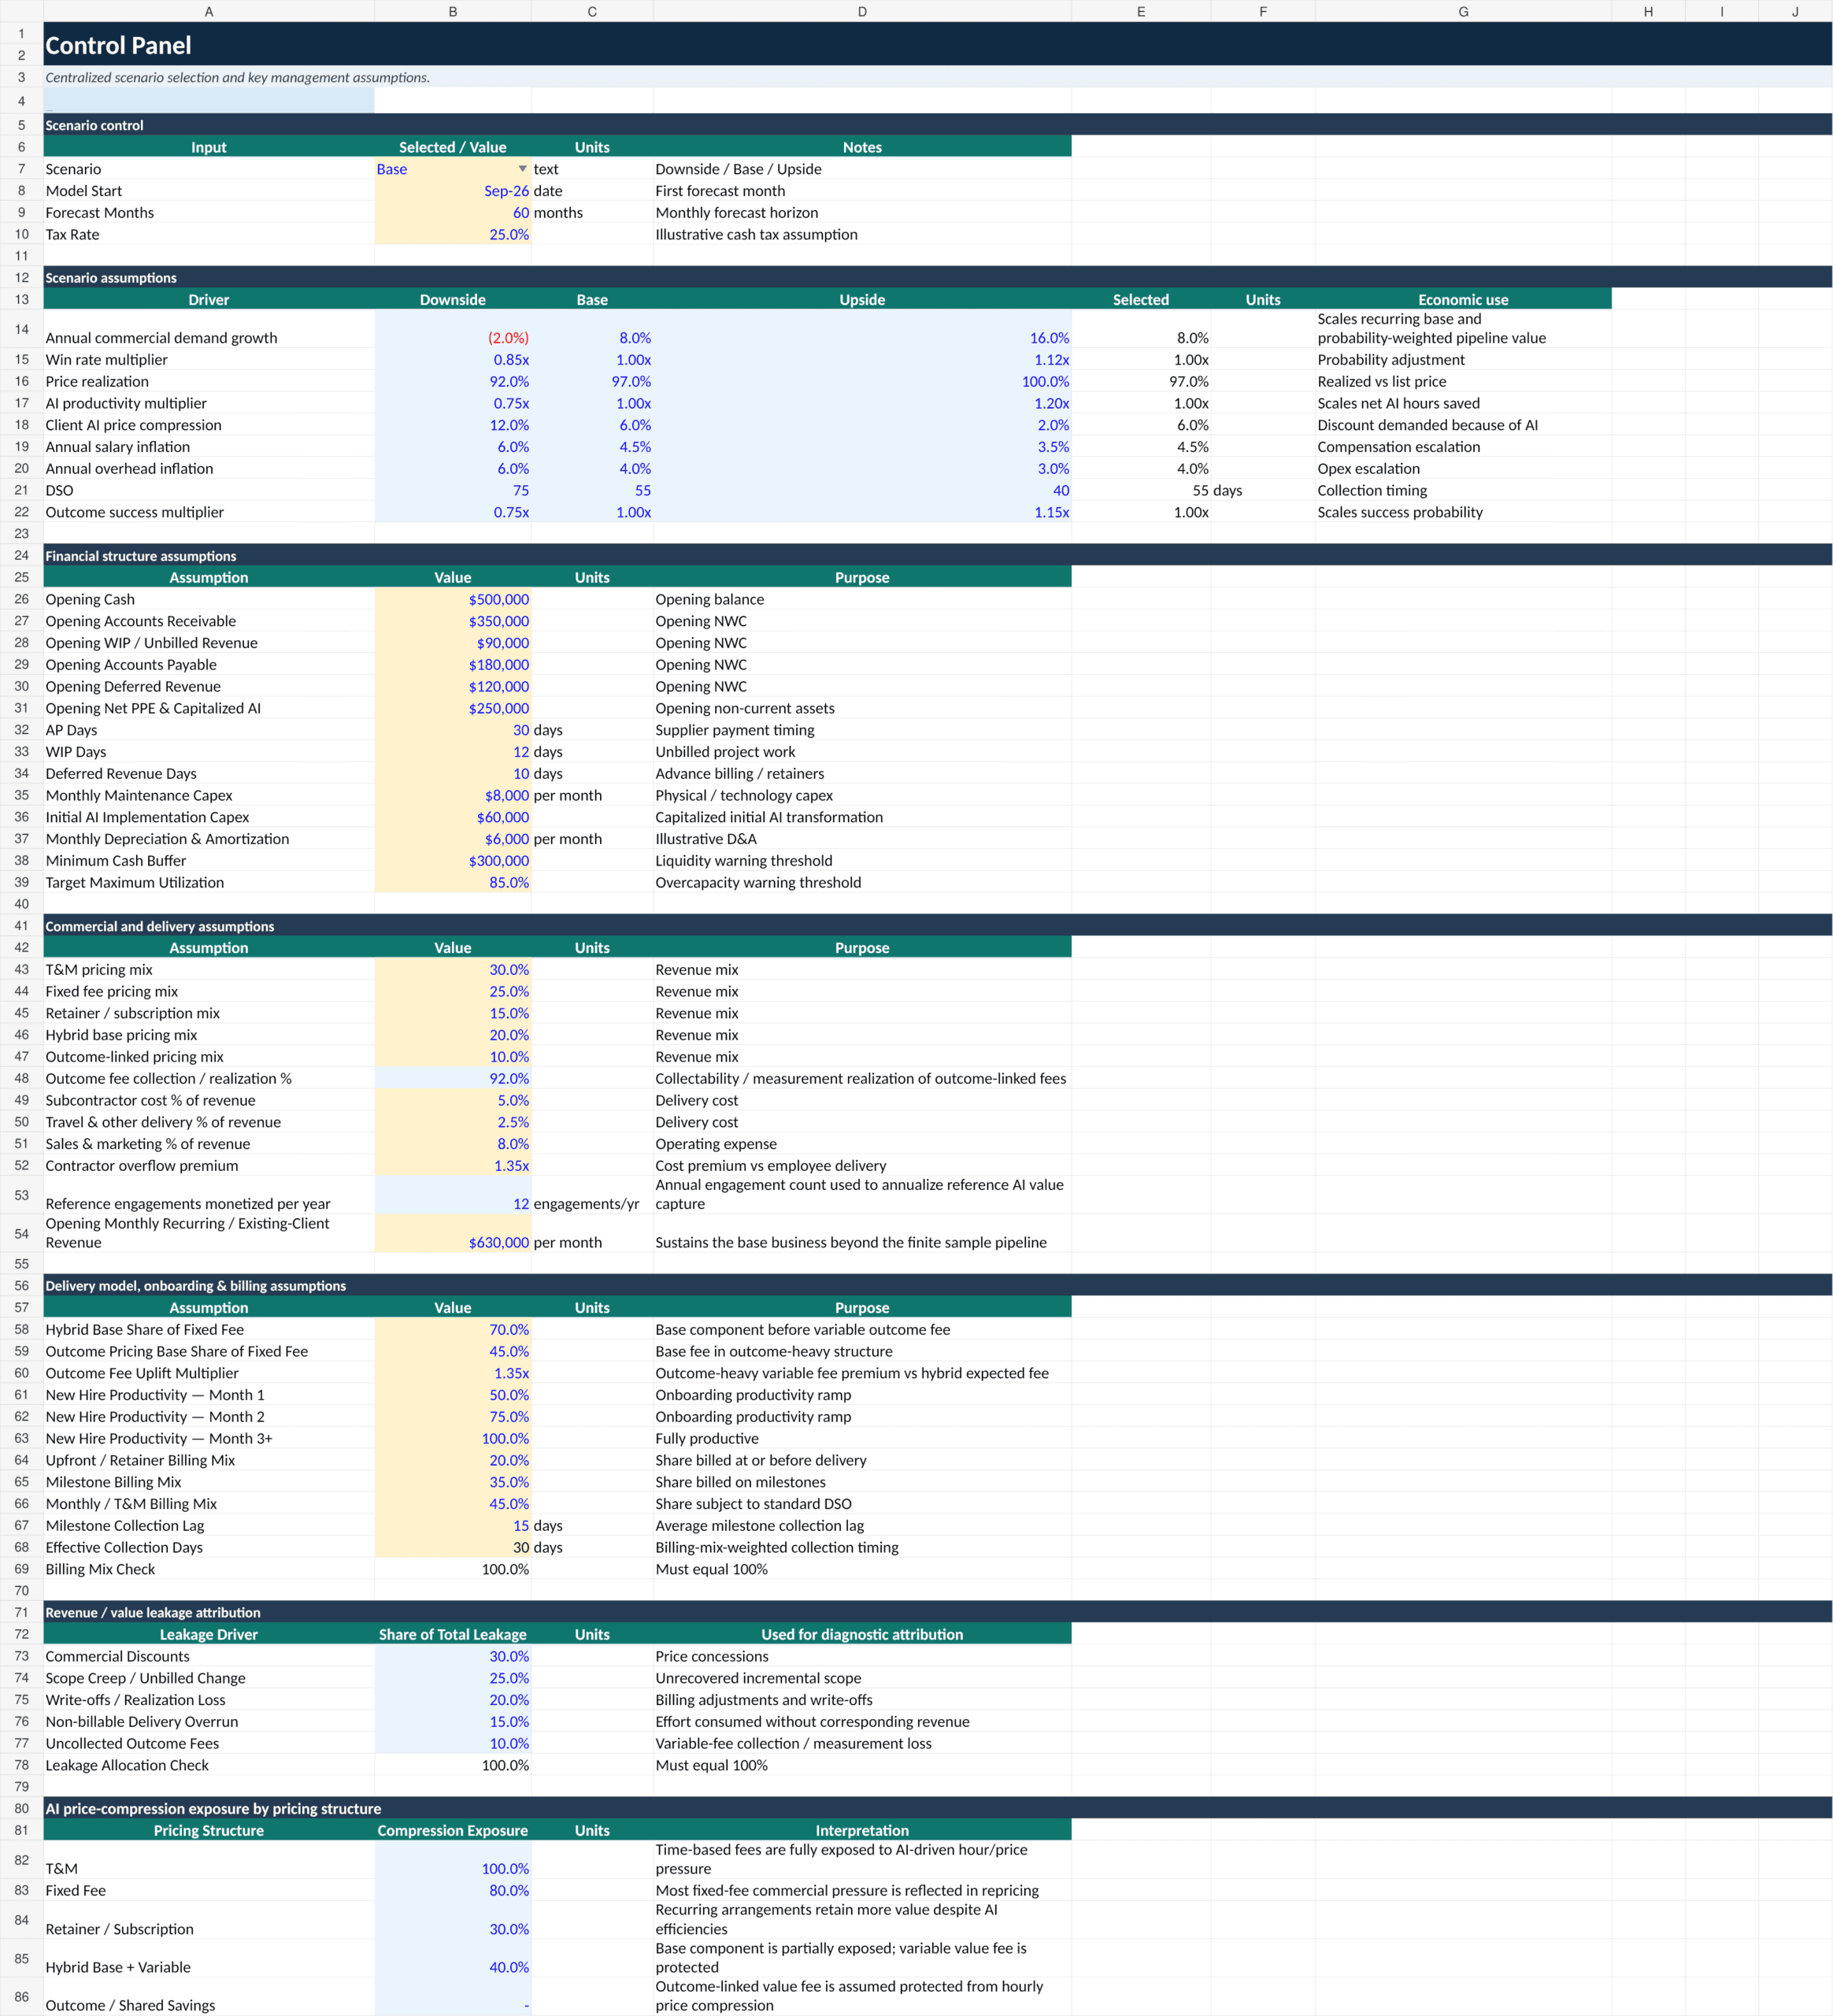
Start in 00_Read_Me for the workbook map and operating logic, then use 01_Control_Panel to select Downside, Base or Upside and edit the central commercial, delivery, financial, billing, leakage and AI price-compression assumptions. The model start date is September 2026 in the sample case and the forecast covers 60 monthly periods.
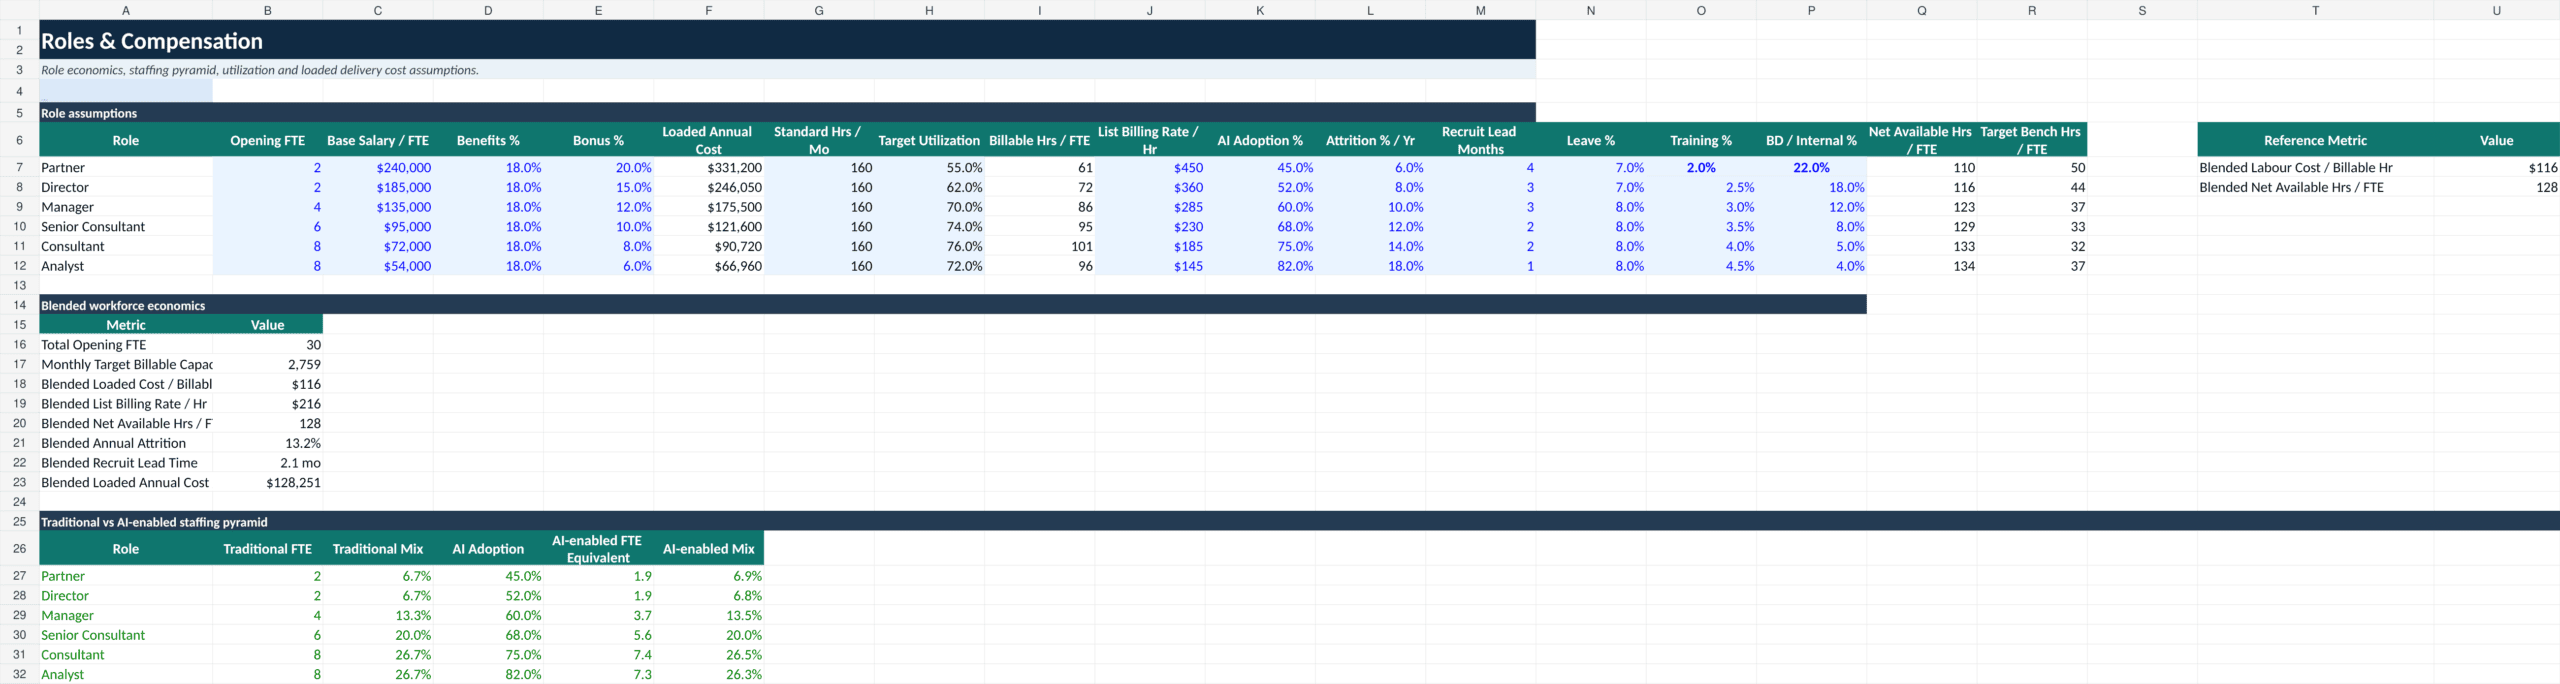
The core input architecture is then built through 02_Services_and_Pricing, 03_Roles_and_Compensation and 04_AI_Productivity_Engine. The service catalog stores billing rates, fixed fees, retainers, hybrid pricing, outcome value shares, typical durations, baseline hours, AI intensity, direct-cost assumptions and target margins. The workforce sheet models Partner, Director, Manager, Senior Consultant, Consultant and Analyst roles, including FTE, loaded compensation, available hours, target utilization, billing rates, AI adoption, attrition and recruitment lead time. The AI engine models research/data gathering, analysis/modeling, slide/report production, PMO/documentation and expert-judgment tasks with automation, assisted share, gross reduction, human review, rework, adoption, net hours saved, variable AI cost and client value.
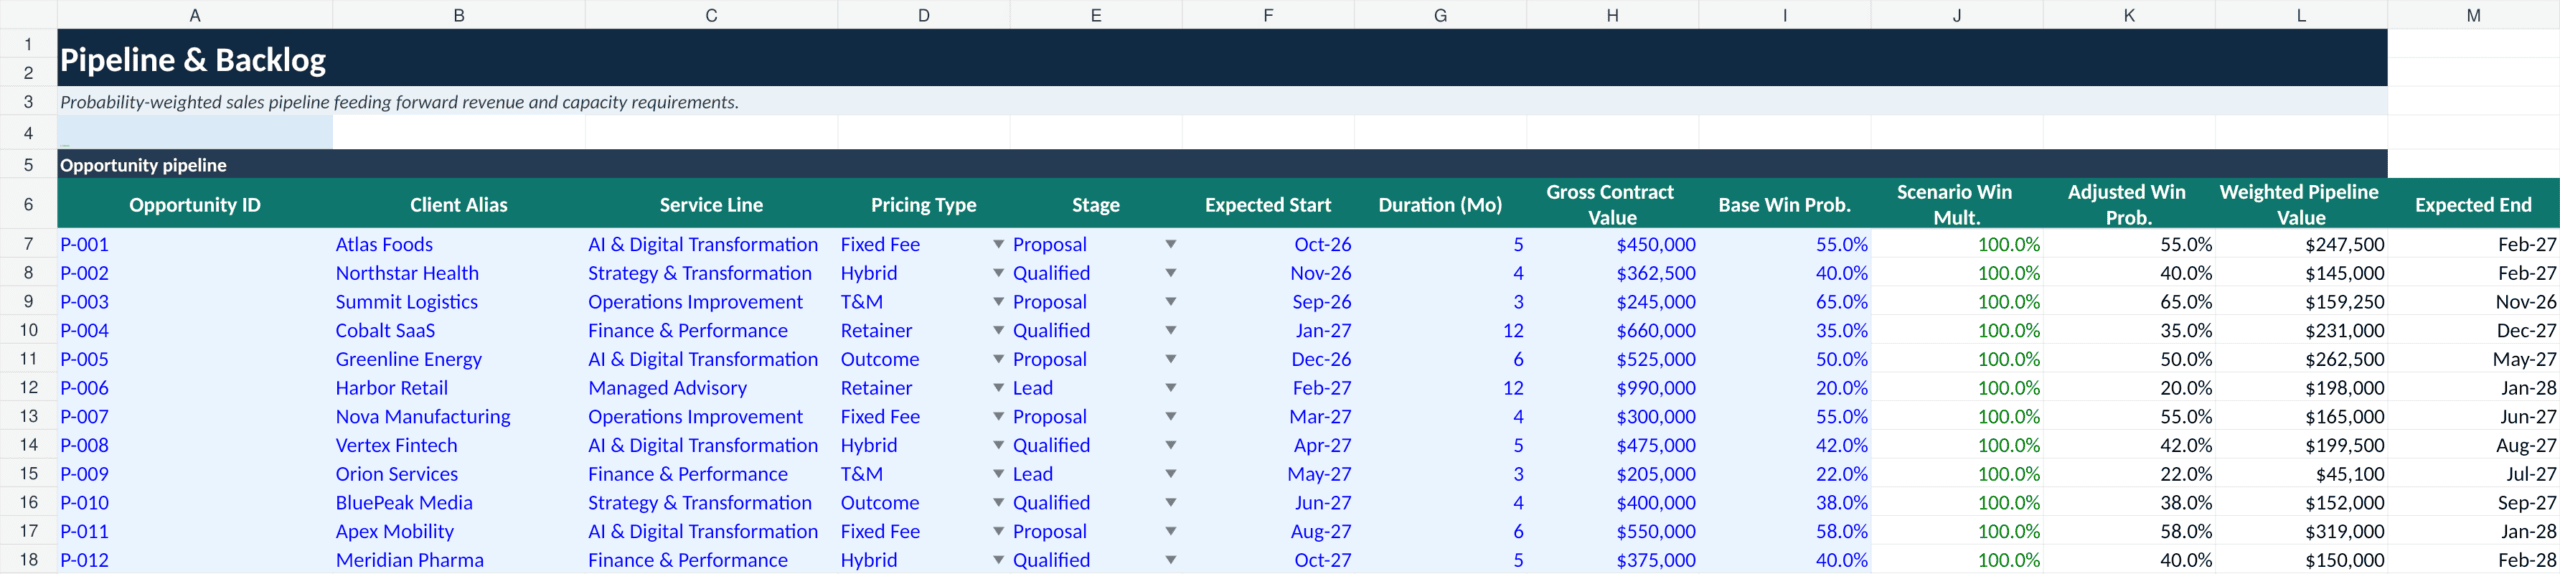
Commercial demand is captured in 05_Pipeline_and_Backlog and 06_Engagement_Database. Opportunities are modeled by stage, pricing type, start timing, duration, contract value, win probability, scenario-adjusted probability, weighted value and expected completion. Engagements include service line, pricing type, status, start/end dates, effective duration, baseline and post-AI hours, outcome economics, base fee, monthly revenue and contribution margin. Service-line defaults can be used when engagement-level overrides are left blank or zero.
💵 Pricing, outcome fees and project economics
07_Pricing_Model_Comparison provides a side-by-side view of hourly/T&M, fixed fee, retainer/subscription, hybrid and outcome/shared-savings structures for a reference engagement. It compares revenue, variable outcome revenue, delivery cost, contribution margin, contribution margin percentage and revenue per post-AI hour.
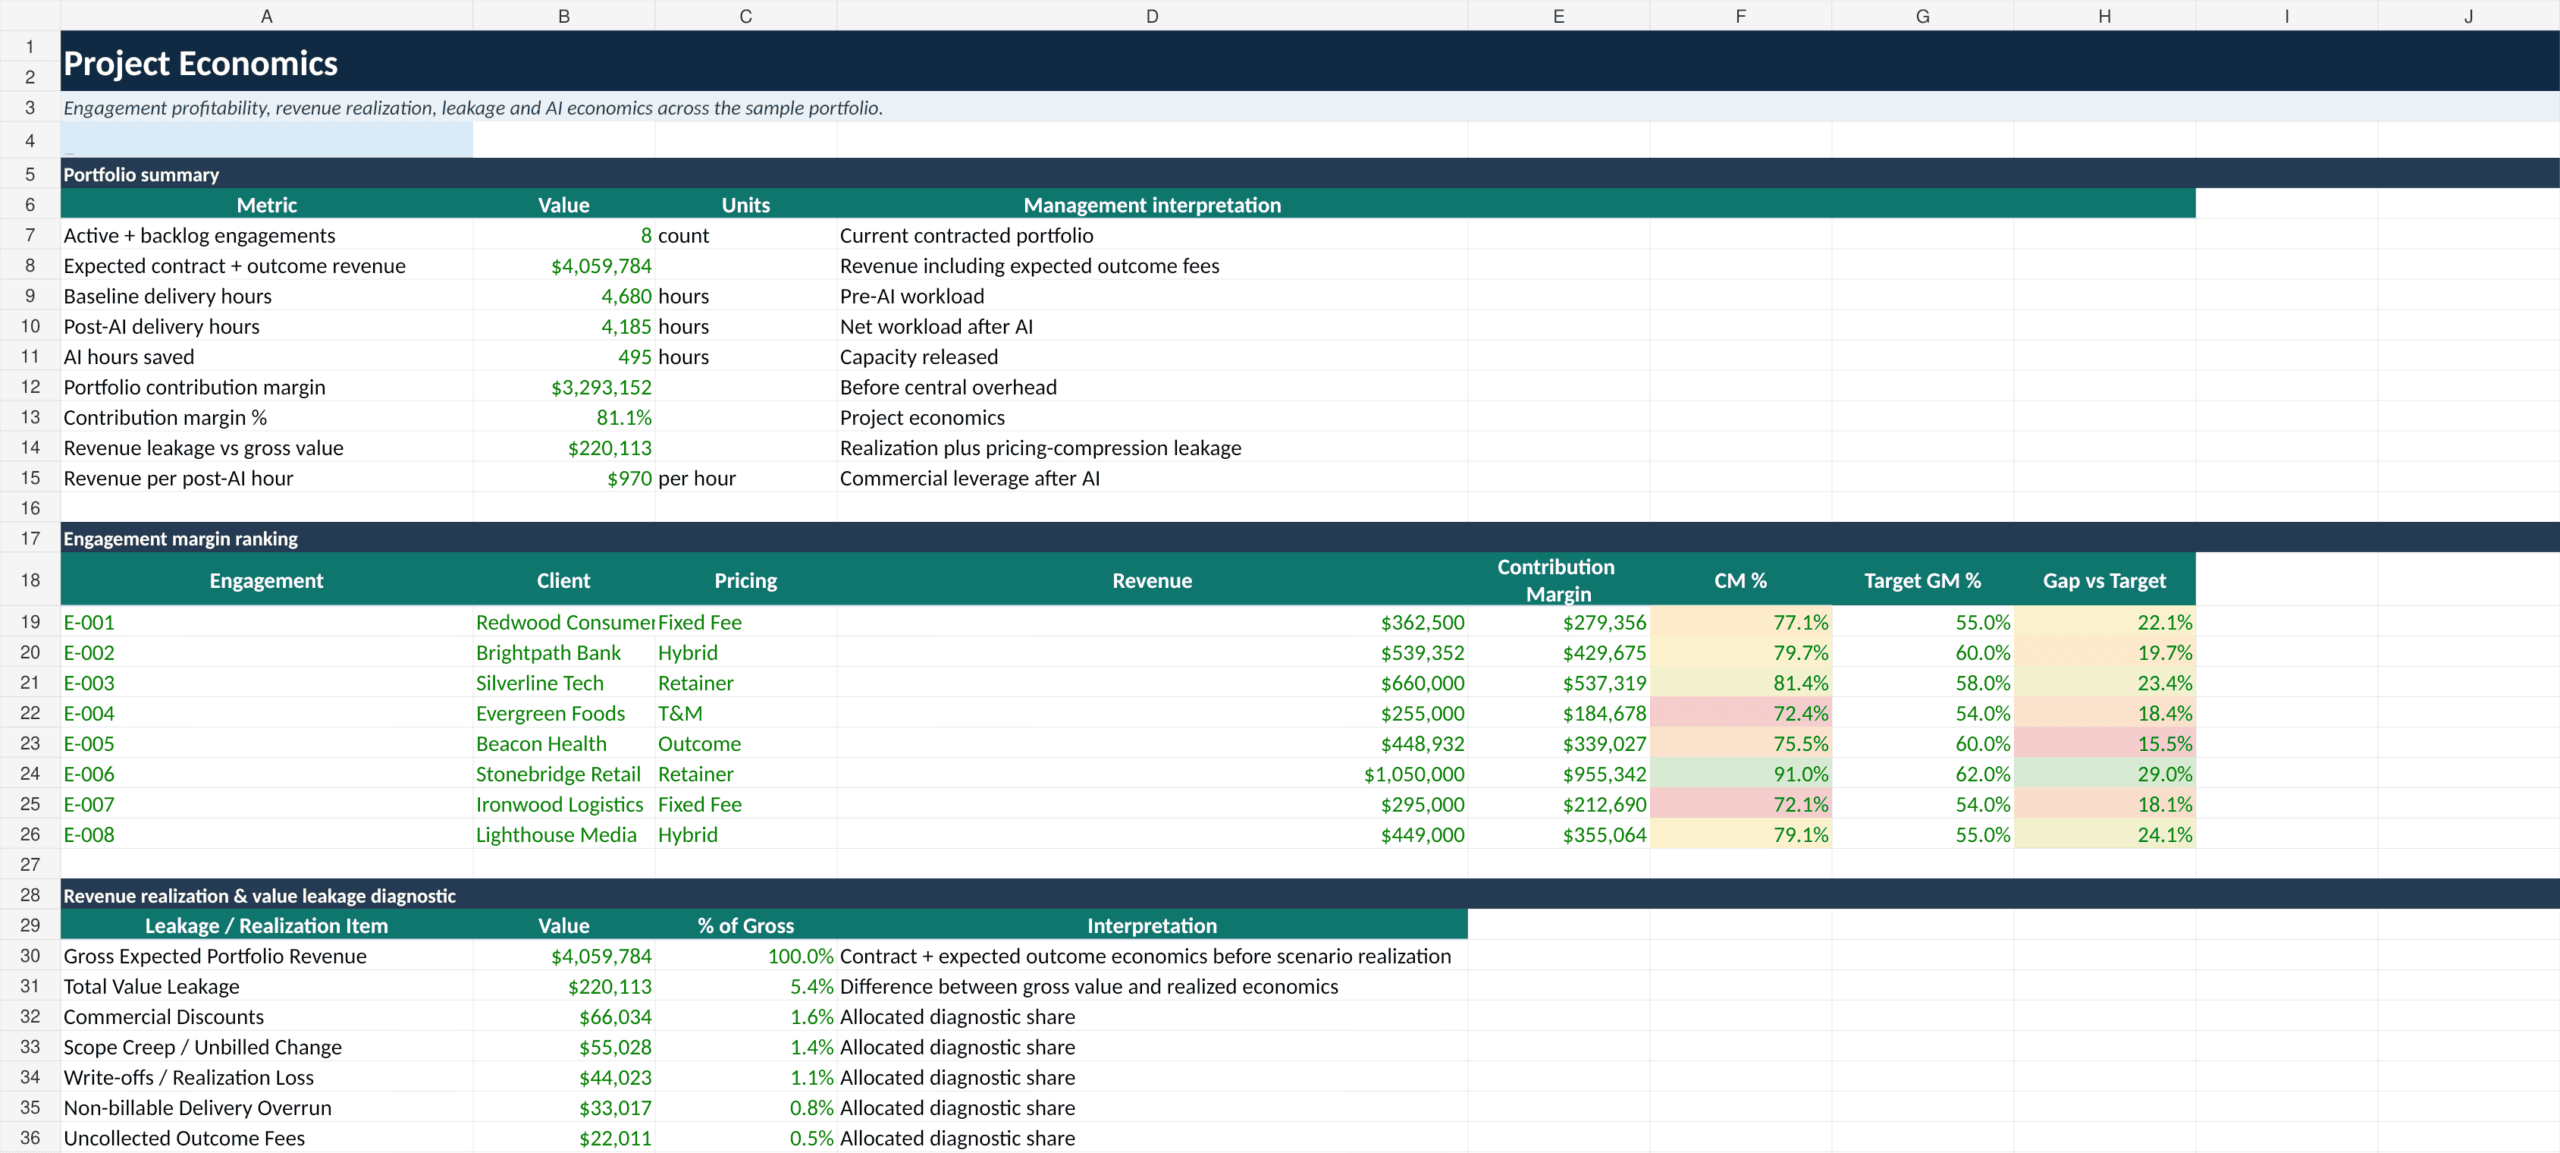
08_Outcome_Fee_Engine calculates expected outcome fees from measured client value, consultant attribution, value-share percentage, performance threshold, fee floor, fee cap, base success probability, scenario success multiplier and collection/realization. 09_Project_Economics summarizes portfolio revenue, baseline and post-AI hours, AI hours saved, contribution margin, revenue per post-AI hour, engagement margin ranking, service-line target margin gaps and revenue-leakage attribution.
👥 Capacity, hiring and financial forecast
10_Capacity_and_Hiring rolls FTE forward monthly for hires and attrition, applies onboarding productivity, calculates net available capacity and target billable capacity, compares demand before and after AI, estimates utilization, recommended incremental FTE, recruitment starts and contractor overflow.
11_Revenue_Forecast combines recurring/existing-client revenue, contracted engagements and weighted pipeline. Revenue is separated into the five pricing structures using actual engagement/opportunity pricing where available, with realization and structure-specific AI price-compression exposure. It also calculates baseline delivery hours and revenue per baseline hour.
12_Delivery_Costs converts the workforce and overflow schedule into delivery cost. 13_Operating_Expenses_and_AI_Costs includes sales and marketing, G&A, technology/knowledge systems, the fixed AI cost stack, facilities, professional fees and other corporate costs. 14_Working_Capital models accounts receivable, WIP/unbilled revenue, accounts payable, deferred revenue, net working capital, change in NWC and the resulting cash impact.
The financial statements are integrated through 15_Income_Statement, 16_Balance_Sheet and 17_Cash_Flow. These sheets provide monthly revenue, gross profit, EBITDA, EBIT, taxes, net income, assets, liabilities, equity, operating cash flow, capex, free cash flow and cash roll-forward mechanics.
📈 AI ROI, scenarios, sensitivities and dashboard
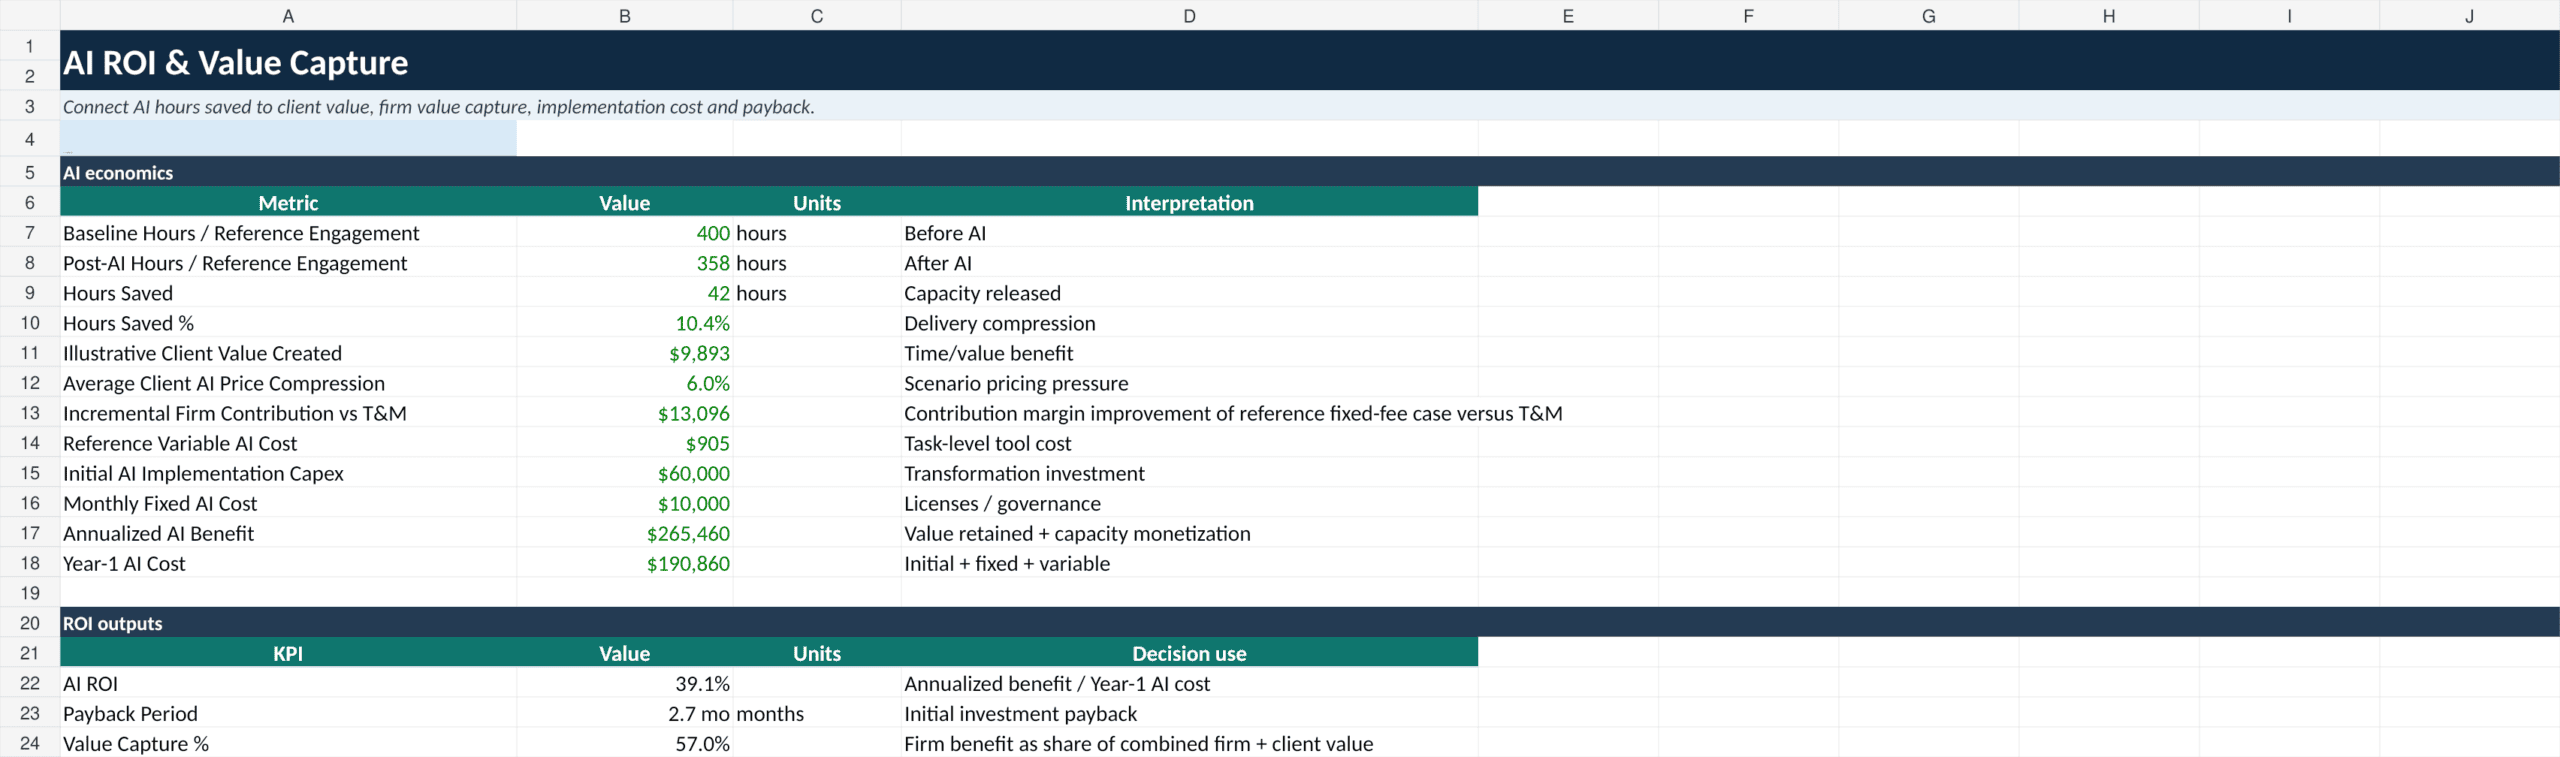
18_AI_ROI_and_Value_Capture translates reference-engagement AI hours saved, client value, incremental firm contribution, implementation capex, fixed AI cost and variable AI cost into annualized benefit, year-one cost, ROI, payback and value capture.
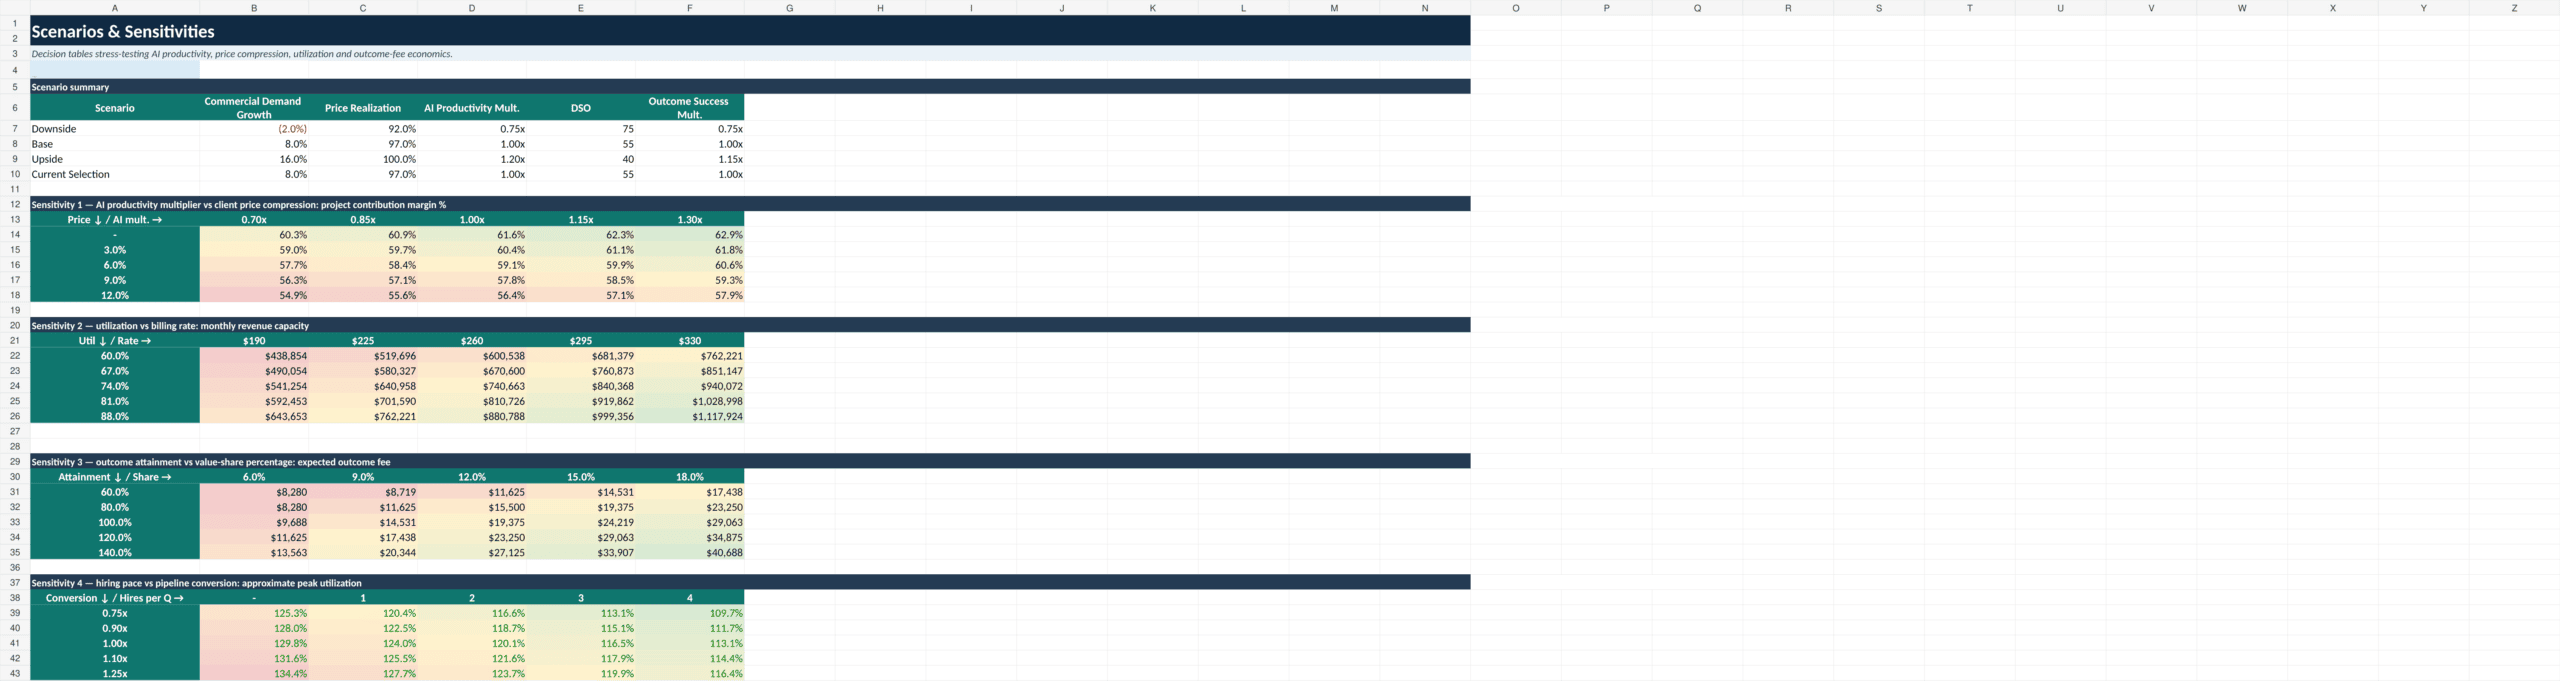
19_Scenarios_and_Sensitivities contains the Downside/Base/Upside comparison and four decision tables: AI productivity multiplier versus client price compression; utilization versus billing rate; outcome attainment versus value-share percentage; and hiring pace versus pipeline conversion.
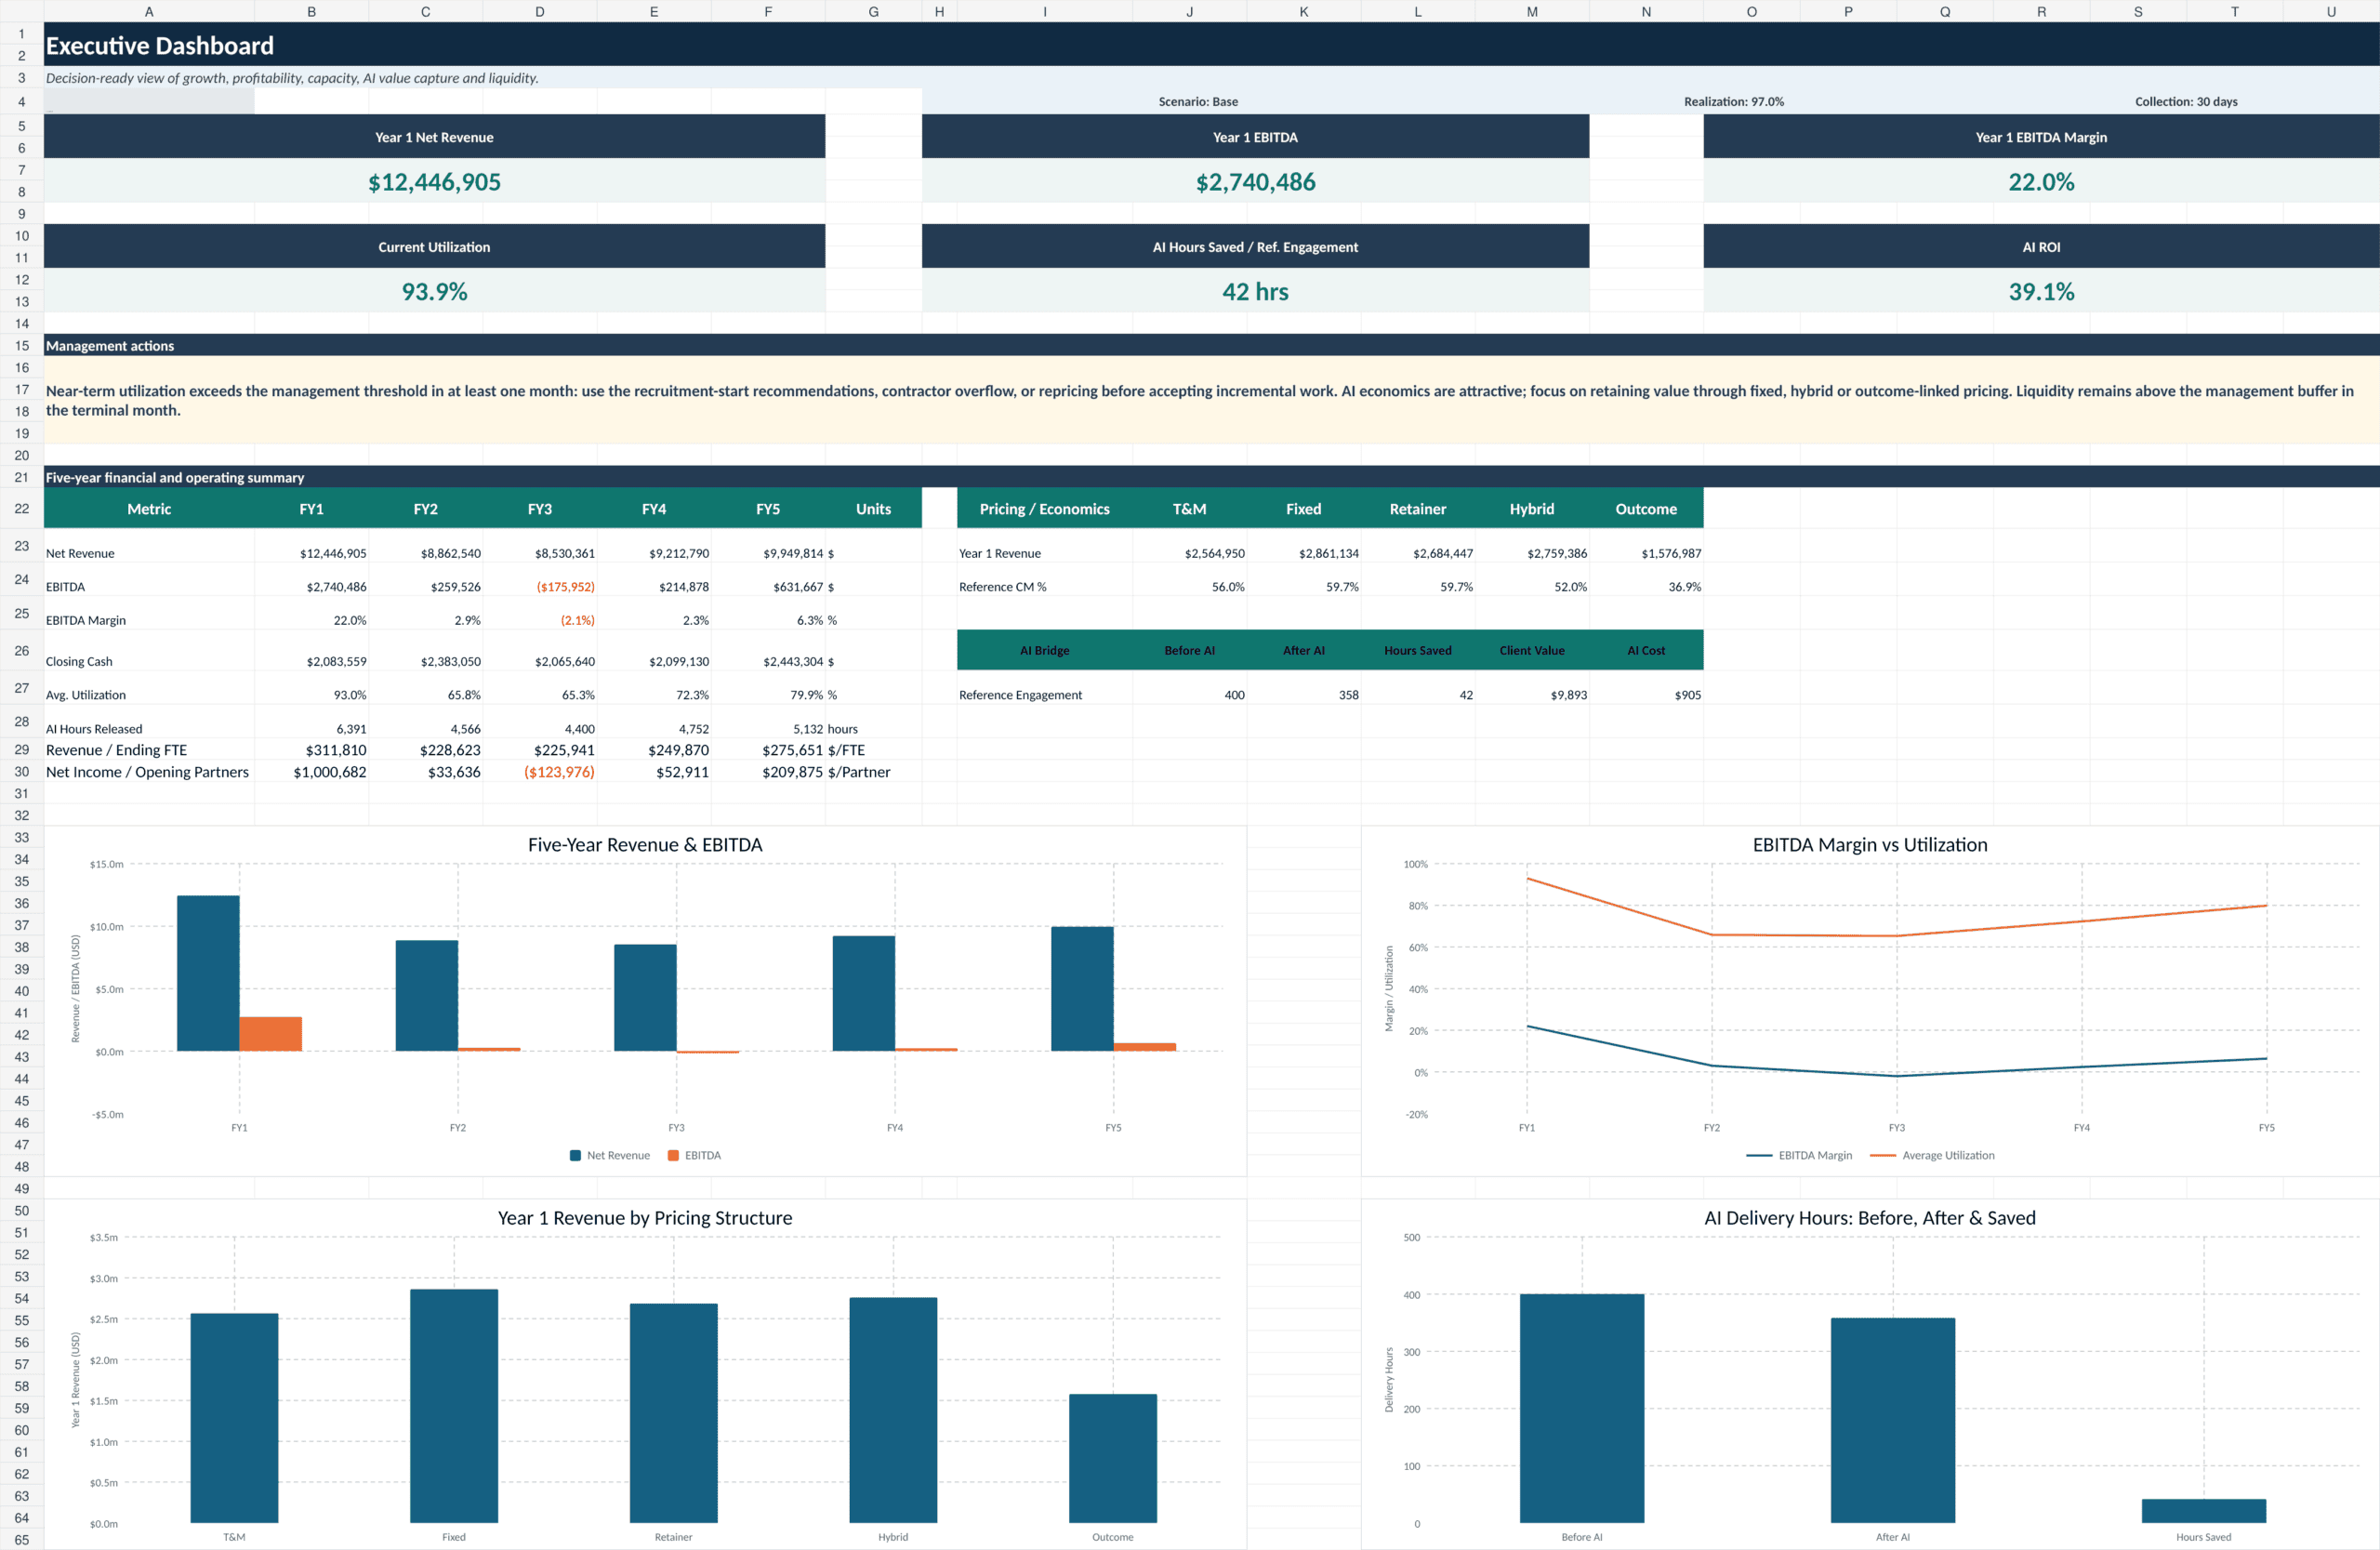
20_Executive_Dashboard brings the model together with KPI cards for Year 1 revenue, EBITDA, EBITDA margin, current utilization, AI hours saved per reference engagement and AI ROI. A management-actions panel highlights capacity and commercial implications, while four native Excel charts show five-year revenue and EBITDA, EBITDA margin versus utilization, Year 1 revenue by pricing structure, and AI delivery hours before/after/saved.
✅ Controls, methodology and practical benefits
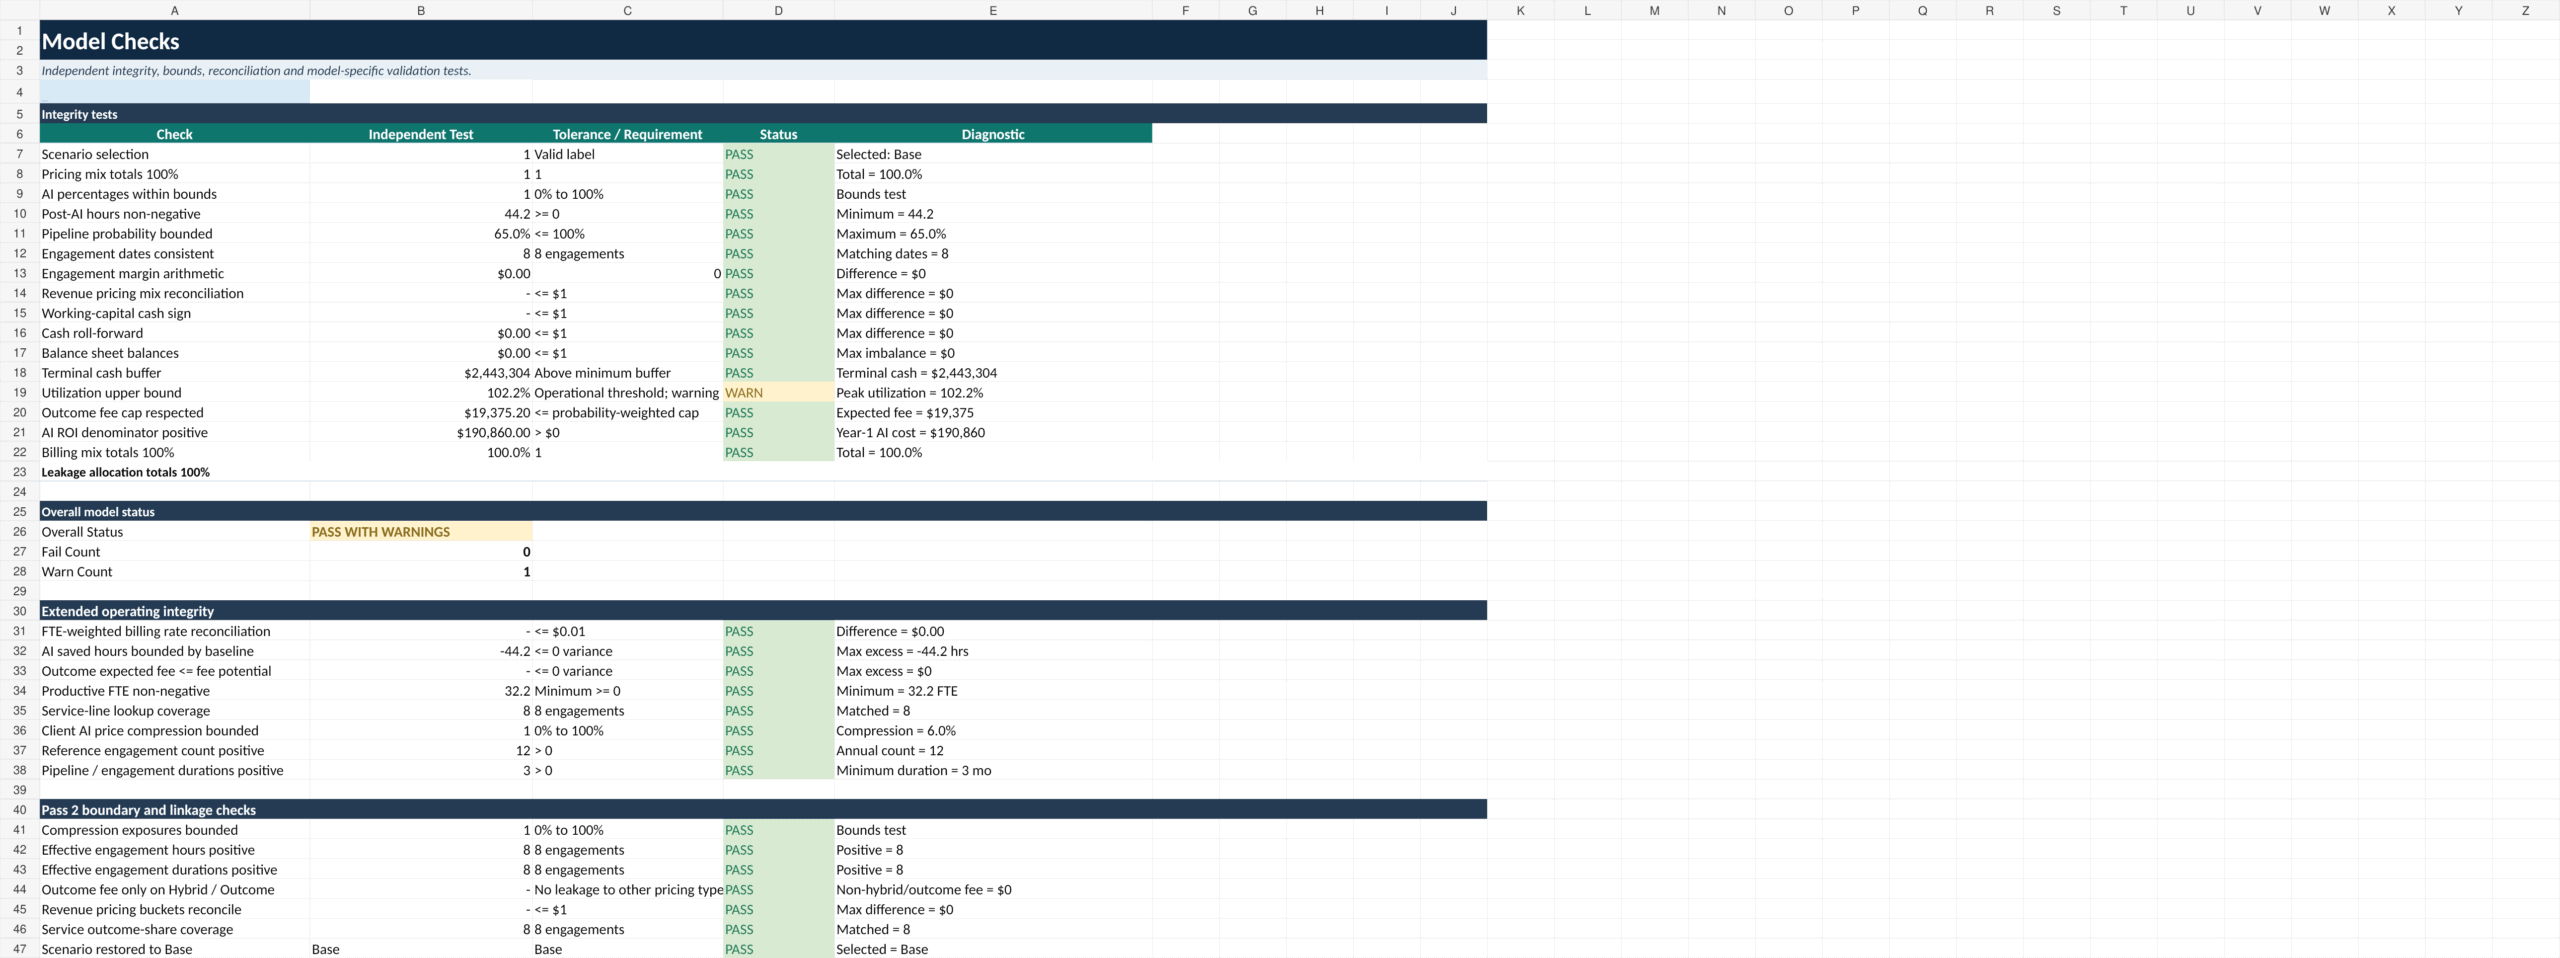
21_Model_Checks tests scenario selection, pricing mix, AI bounds, pipeline probability, engagement dates, margin arithmetic, revenue reconciliation, working-capital signs, cash roll-forward, balance-sheet balance, cash buffer, utilization, outcome-fee caps, AI ROI denominator, billing/leakage totals, service-line lookup coverage, compression bounds, effective engagement defaults and pricing-bucket linkage. 22_Sources_and_Methodology documents the modeling approach and source references used in the workbook.
The practical benefit is a single model that connects AI delivery efficiency to the commercial model and then to staffing and cash. Instead of analyzing pricing, utilization, AI ROI and the financial statements in separate spreadsheets, users can see how one assumption changes the whole consulting-firm system. The workbook is especially useful for annual planning, pricing reviews, hiring decisions, capacity discussions, new AI-enabled service design, partner meetings and management scenario analysis.
📦 Delivered upload assets
The marketplace package includes the client-ready Excel workbook, a 23-page full-sheet PDF preview with one page per worksheet, and 14 high-resolution buyer-facing screenshots for listing galleries and product review. The Excel workbook remains the core editable model.
Similar ProductsOther customers were also interested in...



 eFinancialModels
Electric Vehicle (EV) Charging Station Financial M...
With this comprehensive 5- or 10-year monthly tool, investors can assess the viability of setting up... Read more

Financial Model for Mobile App | Mobile App Busine...
The Mobile App Financial Plan Template in Excel allows you to develop financial projections when lau... Read more

 HenrySheykin
Food Truck Financial Model Excel Template
The Food Truck Financial Model helps entrepreneurs, founders, business owners, consultants, and anal... Read more

Green Hydrogen Production from Wind Energy Financi...
The Green Hydrogen from Wind Financial Model aims to comprehensively forecast a horizon of 40 years ... Read more

Simple Mutual Non-Disclosure Agreement Template
Protect your business secrets with ease using our Simple Mutual Non-Disclosure Agreement Template. S... Read more

Solar Energy Financial Model
The Solar Energy Financial Model Spreadsheet Template in Excel assists you in preparing a sophistica... Read more

 Peter Graf
The Customer-Centric Financial Model for Restauran...
Starting a restaurant without a financial plan is like driving a car blindfolded. You wouldn´t do i... Read more
You must log in to submit a review.