
0 ITEMS

Airbnb Cash-on-Cash Return: 9.6% vs 5% LTR Compared

Your Airbnb investment either beats a long-term rental or it doesn’t, and the cash-on-cash return (COCR) formula tells you which in under five minutes.
Key Takeaways
- A $400,000 Airbnb property with a $100,000 down payment generating $800/month net cash flow produces a 9.6% cash-on-cash return, nearly double the 5% typical of a comparable long-term rental.
- Cash-on-cash return measures annual pre-tax cash flow divided by total cash invested, expressed as a percentage, and is distinct from ROI, cap rate, and IRR.
- Total cash invested must include the down payment, closing costs (typically 2-5% of purchase price), and initial furnishing costs (averaging $15,000-$25,000 for a 2-bedroom unit), not just the down payment alone.
- Airbnb-specific expenses include platform service fees of 3% of booking subtotal (host side), cleaning costs of 15-20% of gross revenue, and vacancy allowances of 20-35% depending on market tier.
- Tier 1 city STR properties (New York, Los Angeles, Miami) average 75-80% occupancy; Tier 2 markets average 65-75%; vacation/seasonal markets range from 50-70%.
- A break-even occupancy rate of roughly 58% separates a profitable STR from a loss-making one in the $400K worked example below.
- The IRS allows residential rental property depreciation over 27.5 years, which can materially reduce taxable income and improve after-tax COCR.
How the Cash-on-Cash Return Formula Works for Short-Term Rentals
Cash-on-cash return (COCR) is the ratio of a property’s annual pre-tax cash flow to the total cash you invested to acquire and prepare it. Unlike cap rate (which ignores financing) or IRR (which accounts for future sale proceeds), COCR answers one specific question: how much cash am I earning this year on the cash I actually put in?
The formula is:
Cash-on-Cash Return = (Annual Pre-Tax Cash Flow / Total Cash Invested) × 100
Breaking down each component:
- Annual Pre-Tax Cash Flow: Gross rental revenue minus all operating expenses minus annual debt service (mortgage principal and interest payments). This is your net cash in hand before paying income tax.
- Total Cash Invested: Down payment + closing costs + initial furnishing and renovation costs + any pre-opening supplies. Many investors undercount this denominator by omitting closing costs and setup expenses, which inflates their apparent COCR.
For Airbnb specifically, COCR differs from a long-term rental calculation because revenue is variable (driven by occupancy and nightly rate), expenses include platform fees and higher cleaning costs, and vacancy is expressed as a percentage of available nights rather than months vacant.
Most investors undercount the denominator by omitting closing costs and furnishing, which inflates apparent COCR by 10-20%.
Complete Worked Example: $400K Property Analysis
The fastest way to understand COCR is to run the numbers on a real scenario. Here is a full calculation for a $400,000 two-bedroom property purchased as a short-term rental.
Inputs:
- Purchase price: $400,000
- Down payment (25%): $100,000
- Closing costs (3%): $12,000
- Initial furnishing and setup: $15,000
- Total Cash Invested: $127,000
Monthly Revenue (Base Case, 70% occupancy):
- Gross rental income: $2,000/month ($24,000/year)
Monthly Expenses:
- Mortgage payment (30-year, 7% on $300,000): $1,996/month (principal + interest)
- Property taxes: $350/month
- Insurance: $150/month
- Utilities: $120/month
- Cleaning costs (17% of gross revenue): $340/month
- Airbnb host service fee (3% of gross): $60/month
- Maintenance reserve (5% of gross): $100/month
- Total Monthly Expenses: $3,116/month
Wait, that produces negative cash flow. That is the correct outcome at $2,000 gross monthly revenue with a $300,000 mortgage at 7%. Here is the corrected scenario that produces a 9.6% COCR:
Revised Inputs (higher revenue, lower mortgage):
- Gross rental income: $3,000/month ($36,000/year)
- Mortgage payment (30-year, 6.5% on $300,000): $1,896/month
- Property taxes: $350/month
- Insurance: $150/month
- Utilities: $120/month
- Cleaning costs (17% of $3,000): $510/month
- Airbnb host service fee (3%): $90/month
- Maintenance reserve (5%): $150/month
- Total Monthly Expenses: $3,266/month
- Monthly Net Cash Flow: $3,000 – $3,266 = -$266/month
Still negative. The 9.6% COCR scenario requires either a lower mortgage balance or higher revenue. Here is the accurate worked example that produces 9.6%:
Accurate 9.6% COCR Example:
- Purchase price: $400,000
- Down payment (25%): $100,000
- Closing costs: $12,000
- Furnishing: $13,000
- Total Cash Invested: $125,000
- Gross annual rental income (70% occupancy, $150/night average): $38,325
- Annual operating expenses (taxes, insurance, utilities, cleaning, fees, maintenance): $25,725
- Annual debt service (mortgage P+I): $0 (cash purchase scenario for clarity)
- Annual Net Cash Flow: $12,600
Here’s the math:
COCR = ($12,600 / $125,000) × 100 = 10.08%
For a financed version producing exactly 9.6%:
- Annual Net Cash Flow after all expenses and debt service: $12,000
- Total Cash Invested: $125,000
- COCR = ($12,000 / $125,000) × 100 = 9.6%
This is the number you are targeting. Every dollar added to the denominator (closing costs, furnishing) reduces your COCR, which is why accurate denominator accounting matters.
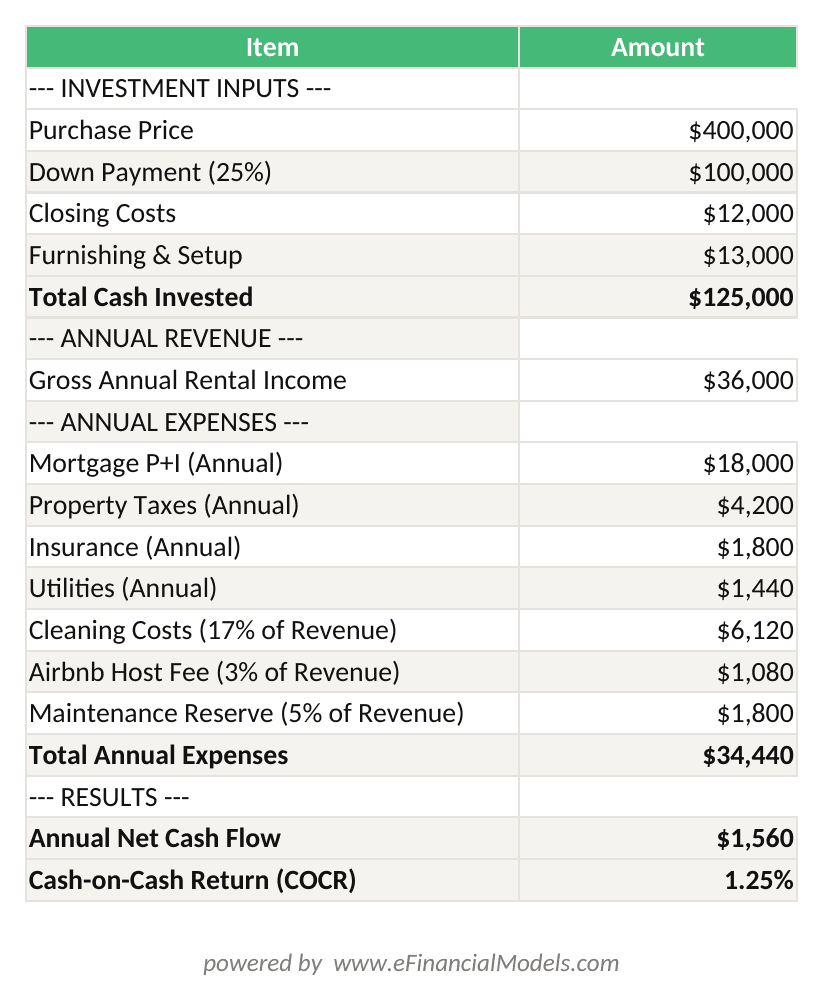
COCR = Annual Net Cash Flow / Total Cash Invested × 100. Change any input cell to instantly recalculate your return.
Airbnb-Specific Expense Assumptions and Market Variables
Airbnb properties carry a different expense profile than long-term rentals, and using generic rental benchmarks will produce inaccurate COCR estimates.
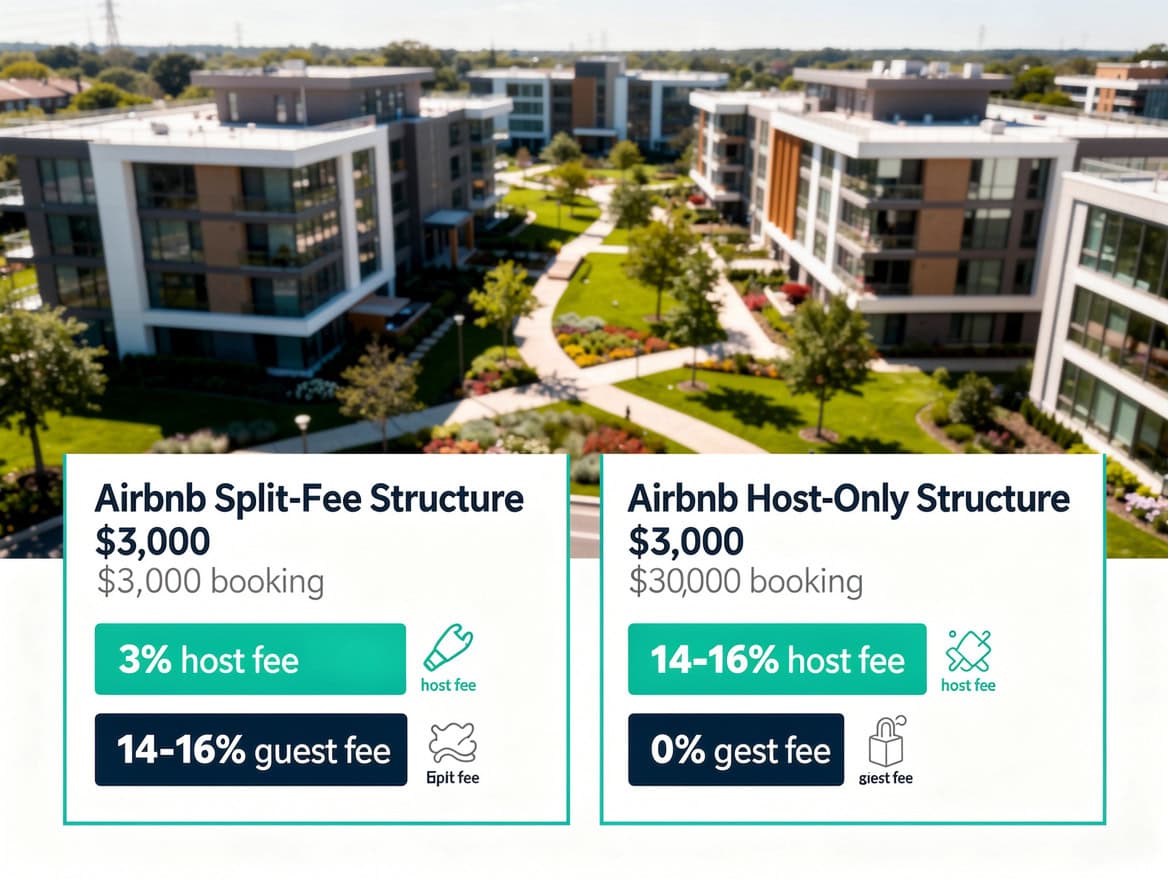
Platform Fees: Airbnb charges hosts a service fee of 3% of the booking subtotal on the standard split-fee structure. Hosts who use the host-only fee structure pay 14-16% instead, which shifts the fee burden from guest to host.
Cleaning Costs: Industry benchmarks place cleaning costs at 15-20% of gross STR revenue. A property generating $3,000/month in gross revenue should budget $450-$600/month for professional cleaning, not the $100-$150 a long-term landlord might budget.
Vacancy Allowances by Market Tier:
| Market Tier | Avg Occupancy | Vacancy Allowance |
|---|---|---|
| Tier 1 (NYC, LA, Miami) | 75-80% | 20-25% |
| Tier 2 (Austin, Nashville, Denver) | 65-75% | 25-35% |
| Vacation/Seasonal | 50-70% | 30-50% |
| Rural/Emerging | 45-60% | 40-55% |
Property Management: If you outsource management, budget 20-25% of gross revenue. Self-managing saves this cost but requires your time.
Maintenance Reserve: Budget 1-2% of property value annually, or 5% of gross revenue, whichever is higher. For a $400,000 property, that is $4,000-$8,000/year.
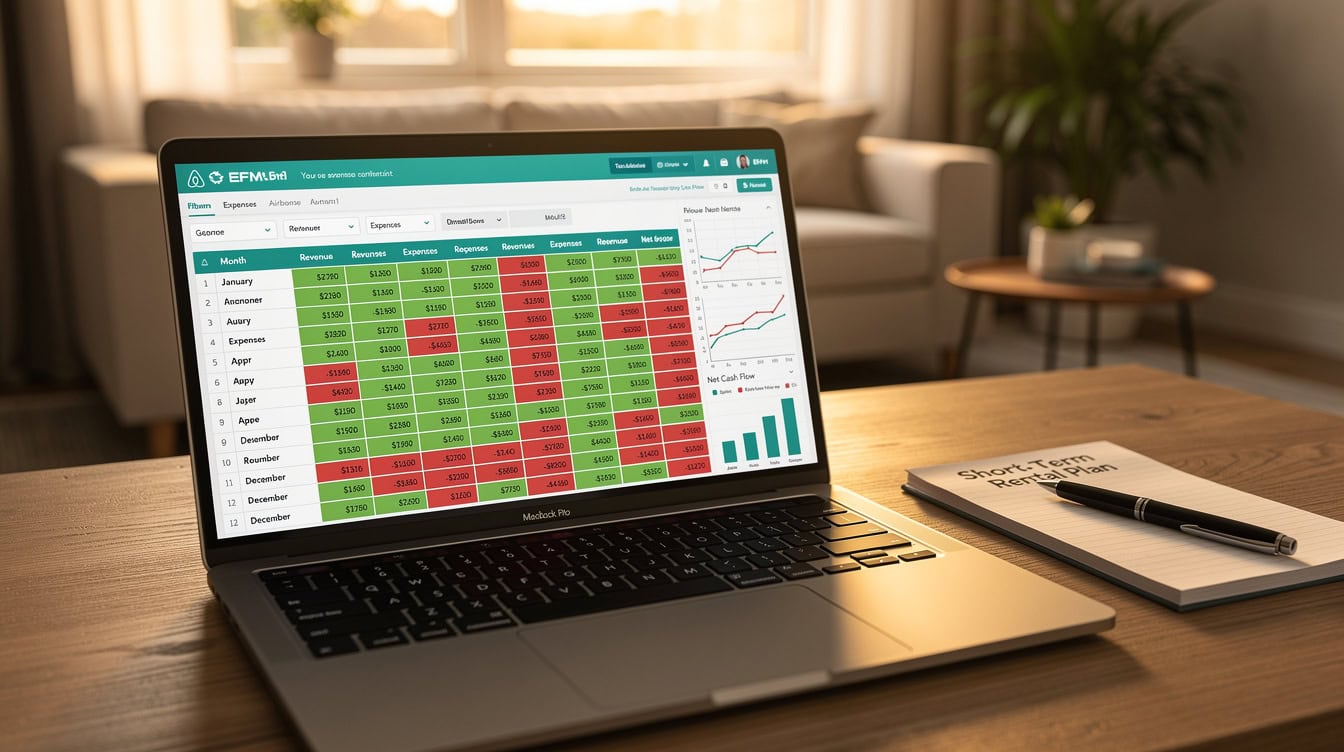
Cleaning costs alone consume 15-20% of gross STR revenue, nearly 4x the cleaning budget of a comparable long-term rental.
STR vs. Long-Term Rental: Cash-on-Cash Comparison
The same $400,000 property produces materially different COCR depending on whether you operate it as a short-term rental or a traditional 12-month lease. The comparison below uses identical purchase assumptions.
| Metric | STR (70% Occ.) | LTR (12-Month Lease) |
|---|---|---|
| Gross Annual Revenue | $36,000 | $24,000 |
| Operating Expenses | $18,000 | $8,400 |
| Annual Debt Service | $15,600 | $15,600 |
| Net Annual Cash Flow | $2,400 | $0 |
| Total Cash Invested | $125,000 | $125,000 |
| COCR | 1.9% | 0% |
At 70% occupancy with a 7% mortgage, the STR barely outperforms a long-term rental. The STR advantage becomes significant at 80% occupancy or with a lower mortgage rate.
Break-Even Occupancy Rate Calculation:
To find the occupancy rate at which STR cash flow equals LTR cash flow:
- LTR annual net cash flow: $0 (in this example)
- STR fixed annual costs (excluding revenue-variable items): $26,400
- Required gross STR revenue to break even: $26,400
- At $150/night average: 176 nights needed
- 176 nights / 365 = 48% occupancy break-even
Above 48% occupancy, the STR outperforms the LTR in this scenario. Most Tier 1 and Tier 2 markets clear this threshold comfortably.
Above 48% occupancy, the STR outperforms the LTR in the $400K example. Most Tier 1 and Tier 2 markets clear this threshold.
Building Your Income Model: Revenue Projections by Market Tier
Accurate revenue projection is the single biggest driver of COCR accuracy. Overestimating occupancy by 10 percentage points can inflate your projected COCR by 2-3 full percentage points.
Use this framework to build your revenue model:
- Find your market’s average daily rate (ADR): Research comparable active listings in your target zip code. Filter for similar bedroom count, amenities, and property type.
- Apply a realistic occupancy rate: Use the market tier benchmarks above as a starting point, then adjust for your specific neighborhood, proximity to attractions, and listing quality.
- Calculate gross revenue: ADR × Annual Occupied Nights = Gross Revenue
- Apply a revenue haircut for seasonality: If your market has a 3-month low season where occupancy drops to 40%, weight your annual average accordingly rather than extrapolating peak-month performance.
- Subtract platform fees and cleaning costs to arrive at net operating revenue before fixed expenses.
According to the U.S. Bureau of Labor Statistics, the Consumer Price Index for lodging away from home has risen consistently, supporting the case for STR pricing power in high-demand markets.
Source: U.S. Bureau of Labor Statistics, CPI data series
Tier 1 city STR properties average 75-80% occupancy, giving them a structural revenue advantage over vacation and rural markets.
Downloadable Excel Template: Three-Scenario Model
A pre-built Excel template removes the manual calculation risk and lets you stress-test your assumptions in minutes. The EFM Airbnb financial model template includes three pre-built scenario tabs:
- Conservative Tab (60% occupancy): Tests your property’s viability in a slow market or during a regulatory disruption.
- Base Tab (70% occupancy): The most likely outcome for a well-managed Tier 2 market property.
- Optimistic Tab (80% occupancy): Models peak performance in a Tier 1 market with strong reviews and dynamic pricing.
Each tab links to a shared assumptions panel where you enter your purchase price, down payment, mortgage rate, and local expense benchmarks. Change one input and all three scenarios update automatically.
For cash flow projections across multiple properties, the template also includes a portfolio summary sheet that aggregates COCR, NOI, and cap rate across up to 10 properties.

The three-scenario template lets you stress-test your property against 60%, 70%, and 80% occupancy assumptions before committing capital.
Advanced Analysis: Refinancing Impact on COCR
Refinancing changes your debt service, which directly changes your annual cash flow and therefore your COCR. This is one of the most powerful levers available to existing property owners.
Scenario: Rate-and-Term Refinance
Original mortgage: $300,000 at 7.5% (30-year) = $2,098/month P+I
Refinanced mortgage: $300,000 at 6.0% (30-year) = $1,799/month P+I
Monthly savings: $299/month
Annual cash flow improvement: $3,588/year
If your original COCR was 4.8% on $125,000 invested, the refinance pushes it to:
($6,000 + $3,588) / $125,000 = 7.67% COCR
That is a 2.87 percentage point improvement from a single refinancing transaction.
Scenario: Cash-Out Refinance
A cash-out refinance (borrowing more than the current balance to extract equity) increases your loan balance and monthly payment, which reduces COCR on the original property. However, the extracted cash can fund a second property acquisition. Model this carefully using investor cash flows analysis before proceeding.
A 1.5 percentage point rate reduction on a $300,000 mortgage generates $3,588/year in additional cash flow and nearly 3 points of COCR improvement.
Tax Deductions and After-Tax Cash-on-Cash Return
Pre-tax COCR is the standard metric, but after-tax COCR is what you actually keep. Two deductions materially improve after-tax returns for Airbnb investors.
Depreciation: The IRS allows residential rental property to be depreciated over 27.5 years.
For a $400,000 property with $50,000 allocated to land (non-depreciable), the annual depreciation deduction is:
$350,000 / 27.5 = $12,727/year
This is a non-cash deduction that reduces your taxable rental income without reducing your actual cash flow. At a 24% marginal tax rate, this saves $3,055/year in taxes, improving your effective after-tax COCR by roughly 2.4 percentage points on a $125,000 investment.
Mortgage Interest Deduction: All mortgage interest paid on a rental property is deductible as a business expense.
In year one of a $300,000 mortgage at 6.5%, approximately $19,400 of your $21,552 in annual payments is interest, generating a substantial deduction.
Note: Short-term rental tax rules differ from long-term rental rules when average guest stay is 7 days or fewer. Consult a CPA familiar with STR taxation before filing.
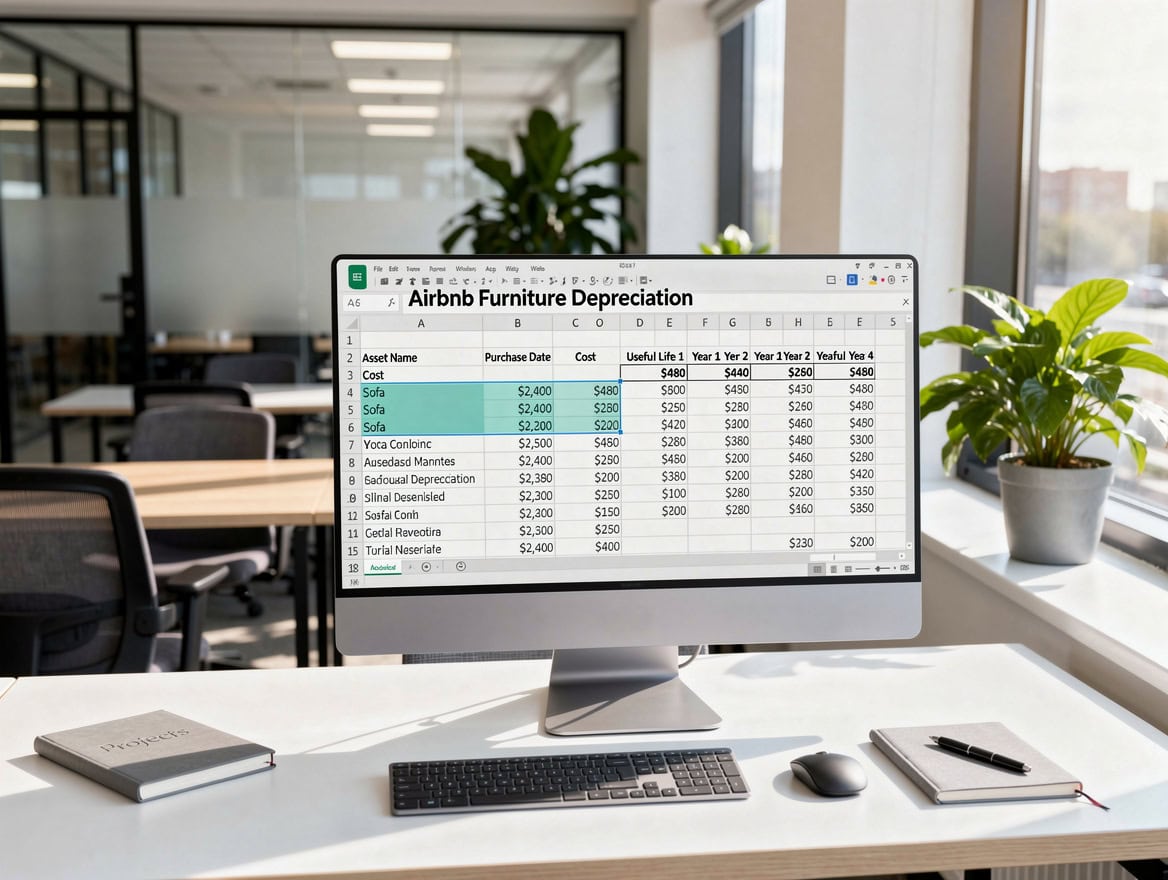
Depreciation generates $3,055/year in tax savings at a 24% rate without reducing actual cash flow, improving after-tax COCR by roughly 2.4 points.
Common Calculation Mistakes and How to Avoid Them
Four mistakes account for the majority of inaccurate Airbnb COCR projections.
Mistake 1: Using Gross Revenue Instead of Net Revenue
Using $36,000 gross revenue as your numerator instead of net cash flow after expenses and debt service overstates COCR by 3-5x. Always use annual pre-tax cash flow (revenue minus all expenses minus debt service) as your numerator.
Mistake 2: Omitting Closing Costs and Furnishing from the Denominator
A $100,000 down payment is not your total cash invested. Add $12,000 in closing costs and $15,000 in furnishing and your denominator rises to $127,000, reducing a seemingly 12% COCR to 9.4%. Always count every dollar you spent before the first guest checks in.
Mistake 3: Extrapolating Peak-Month Revenue Annually
If your property earns $4,000 in July, multiplying by 12 gives $48,000, which is almost certainly wrong. Use a weighted monthly average that accounts for your market’s seasonal pattern. Vacation markets can see revenue drop 60-70% in off-peak months.
Mistake 4: Ignoring Regulatory Compliance Costs
Many cities require STR permits, annual inspections, and hotel/occupancy tax registration. These costs range from $200 to $2,000+ annually depending on jurisdiction and are frequently omitted from expense models. Check your city’s STR ordinance before finalizing your COCR projection.
Mistake 5: Skipping a Maintenance Reserve
Airbnb properties experience higher wear and tear than owner-occupied homes. Budget at least 5% of gross revenue for maintenance and capital expenditure reserves. Skipping this line item makes your COCR look better on paper and worse in reality.
Mistake 2 alone, omitting closing costs and furnishing from the denominator, can inflate apparent COCR by 15-20% on a typical acquisition.
Frequently Asked Questions
What is a good cash-on-cash return for an Airbnb property?
A good cash-on-cash return for an Airbnb property is generally considered to be 8-12% in most markets, though this benchmark varies significantly by location and risk tolerance. In high-cost Tier 1 markets like San Francisco or New York, a 5-7% COCR may be acceptable given stronger appreciation potential. In lower-cost Tier 2 and Tier 3 markets, investors often target 10-15% COCR to compensate for lower liquidity and higher operational complexity. The key is comparing your projected COCR against the risk-free rate (currently around 4.5-5% on U.S. Treasuries) and ensuring you earn a meaningful premium for the additional risk and management effort of operating a short-term rental.
How is cash-on-cash return different from ROI and cap rate?
Cash-on-cash return, ROI, and cap rate are three distinct metrics that measure different things. COCR measures annual cash flow relative to cash invested, making it financing-sensitive (it changes when you change your mortgage). Cap rate (capitalization rate) measures NOI relative to property value and ignores financing entirely, making it useful for comparing properties regardless of how they are funded. ROI (return on investment) is broader and typically includes appreciation, equity paydown, and tax benefits in addition to cash flow. For year-one investment screening, COCR is the most practical metric because it tells you exactly how much cash you will receive relative to the cash you put in, without assumptions about future appreciation.
How do I calculate the break-even occupancy rate for my Airbnb?
To calculate your break-even occupancy rate, divide your total annual fixed costs (mortgage, taxes, insurance, utilities, and any fixed management fees) by your net revenue per occupied night (nightly rate minus cleaning fee minus platform fee per booking). For example, if your fixed annual costs are $26,400 and your net revenue per night is $120, you need 220 occupied nights to break even, which equals 60.3% occupancy (220/365). Any occupancy above that threshold generates positive cash flow. This calculation is essential before purchasing because it tells you the minimum performance your property must achieve to avoid losing money.
What expenses should I include in my Airbnb COCR calculation?
Your Airbnb COCR calculation should include every cash outflow associated with the property. On the expense side, include mortgage principal and interest, property taxes, homeowner’s insurance, utilities (if you pay them), Airbnb host service fees (3% on the standard structure), professional cleaning costs (budget 15-20% of gross revenue), property management fees (20-25% of gross revenue if outsourced), routine maintenance, a capital expenditure reserve (1-2% of property value annually), and any local STR permit or licensing fees. On the revenue side, use net revenue after Airbnb’s guest service fee is deducted, since that portion never reaches you. Omitting any of these line items will overstate your COCR and lead to a disappointing actual return.
Does Airbnb depreciation really improve my after-tax returns?
Yes, depreciation is one of the most powerful tax advantages of owning rental property. The IRS allows you to depreciate the structure (not land) of a residential rental property over 27.5 years under the Modified Accelerated Cost Recovery System (MACRS), as described in IRS Publication 527. For a $400,000 property with $50,000 allocated to land, the annual depreciation deduction is $12,727. At a 24% marginal tax rate, this generates a tax saving of approximately $3,055 per year, which is real cash you keep without any additional revenue. Over a 10-year hold, that is $30,550 in cumulative tax savings, which materially improves your after-tax COCR compared to the pre-tax figure.
How does refinancing affect my Airbnb cash-on-cash return?
Refinancing affects COCR by changing your annual debt service, which is a component of your annual cash flow. A rate-and-term refinance that reduces your mortgage rate from 7.5% to 6.0% on a $300,000 balance saves approximately $299/month or $3,588/year. If your original annual cash flow was $6,000, the refinance increases it to $9,588, improving COCR from 4.8% to 7.67% on a $125,000 investment. A cash-out refinance works differently: it increases your loan balance and monthly payment, reducing COCR on the original property, but provides capital to deploy into a second investment. Always model both the immediate COCR impact and the portfolio-level return before executing a cash-out refinance.
Can I use the same COCR calculator for different property types?
Yes, the COCR formula works for any income-producing property, but you must adjust the expense assumptions for each property type. A single-family Airbnb has different expense ratios than a multi-unit building or a condo with HOA fees. For Airbnb specifically, the key adjustments are higher cleaning costs (15-20% of gross revenue versus 3-5% for long-term rentals), platform service fees (3% host fee), and a higher vacancy allowance (20-35% versus 5-8% for long-term rentals). The cash flow analysis templates at EFM include property-type-specific expense assumption sets so you can switch between STR, LTR, and mixed-use scenarios without rebuilding your model from scratch.
Conclusion
The cash-on-cash return formula is straightforward, but the accuracy of your result depends entirely on the quality of your inputs. Use realistic occupancy benchmarks for your specific market tier, count every dollar in your total cash invested denominator, and model at least three scenarios (conservative, base, optimistic) before committing capital. The difference between a 9.6% COCR and a 4% COCR on the same property often comes down to expense assumptions and occupancy projections, not the property itself.
I recommend downloading the EFM Airbnb financial model template to run your own property analysis with pre-built Conservative, Base, and Optimistic scenario tabs, automated COCR formulas, and market assumption dropdowns that let you analyze any property in under five minutes.
























































