0 ITEMS

Financial KPIs for Small Business: 6 Ratios Every Founder Tracks
A founder should track six financial ratios: gross margin, operating margin, current ratio, days sales outstanding, debt-to-equity and cash runway. Together they show whether the business earns money, pays its bills, collects on time, borrows safely and lasts long enough to grow.
Key Takeaways
- Six ratios cover profit, liquidity, collections, leverage and survival, so one monthly review answers the question of which KPIs deserve attention.
- Gross margin and operating margin separate the profit of each sale from the profit left after all running costs.
- The current ratio and days sales outstanding reveal whether short-term bills can be paid and whether customers pay quickly enough.
- Debt-to-equity and cash runway show how much lenders fund the business and how many months of cash remain.
- In the hypothetical example, all six ratios come from a short list of inputs, and cash fell by USD 240,000 although operating income was positive.
Six ratios answer the six questions every founder faces
A key performance indicator (KPI) is a measure that tracks progress toward a business goal. The six below each answer one plain question: is each sale profitable, is the business profitable after costs, can short-term bills be paid, how fast do customers pay, how much debt is carried, and how many months of cash are left.
In the U.S. Chamber of Commerce’s Q4 2025 Small Business Index, conducted by Ipsos, 74% of small businesses said they were comfortable with cash flow, yet only 24% said they were very comfortable, down from 31% in the third quarter (U.S. Chamber of Commerce, December 2025). Comfort is a sentiment, not a measurement, and ratios turn it into numbers that show early where a cash shortfall is forming. The tags for KPIs and financial ratios on eFinancialModels collect further templates on the same measures.
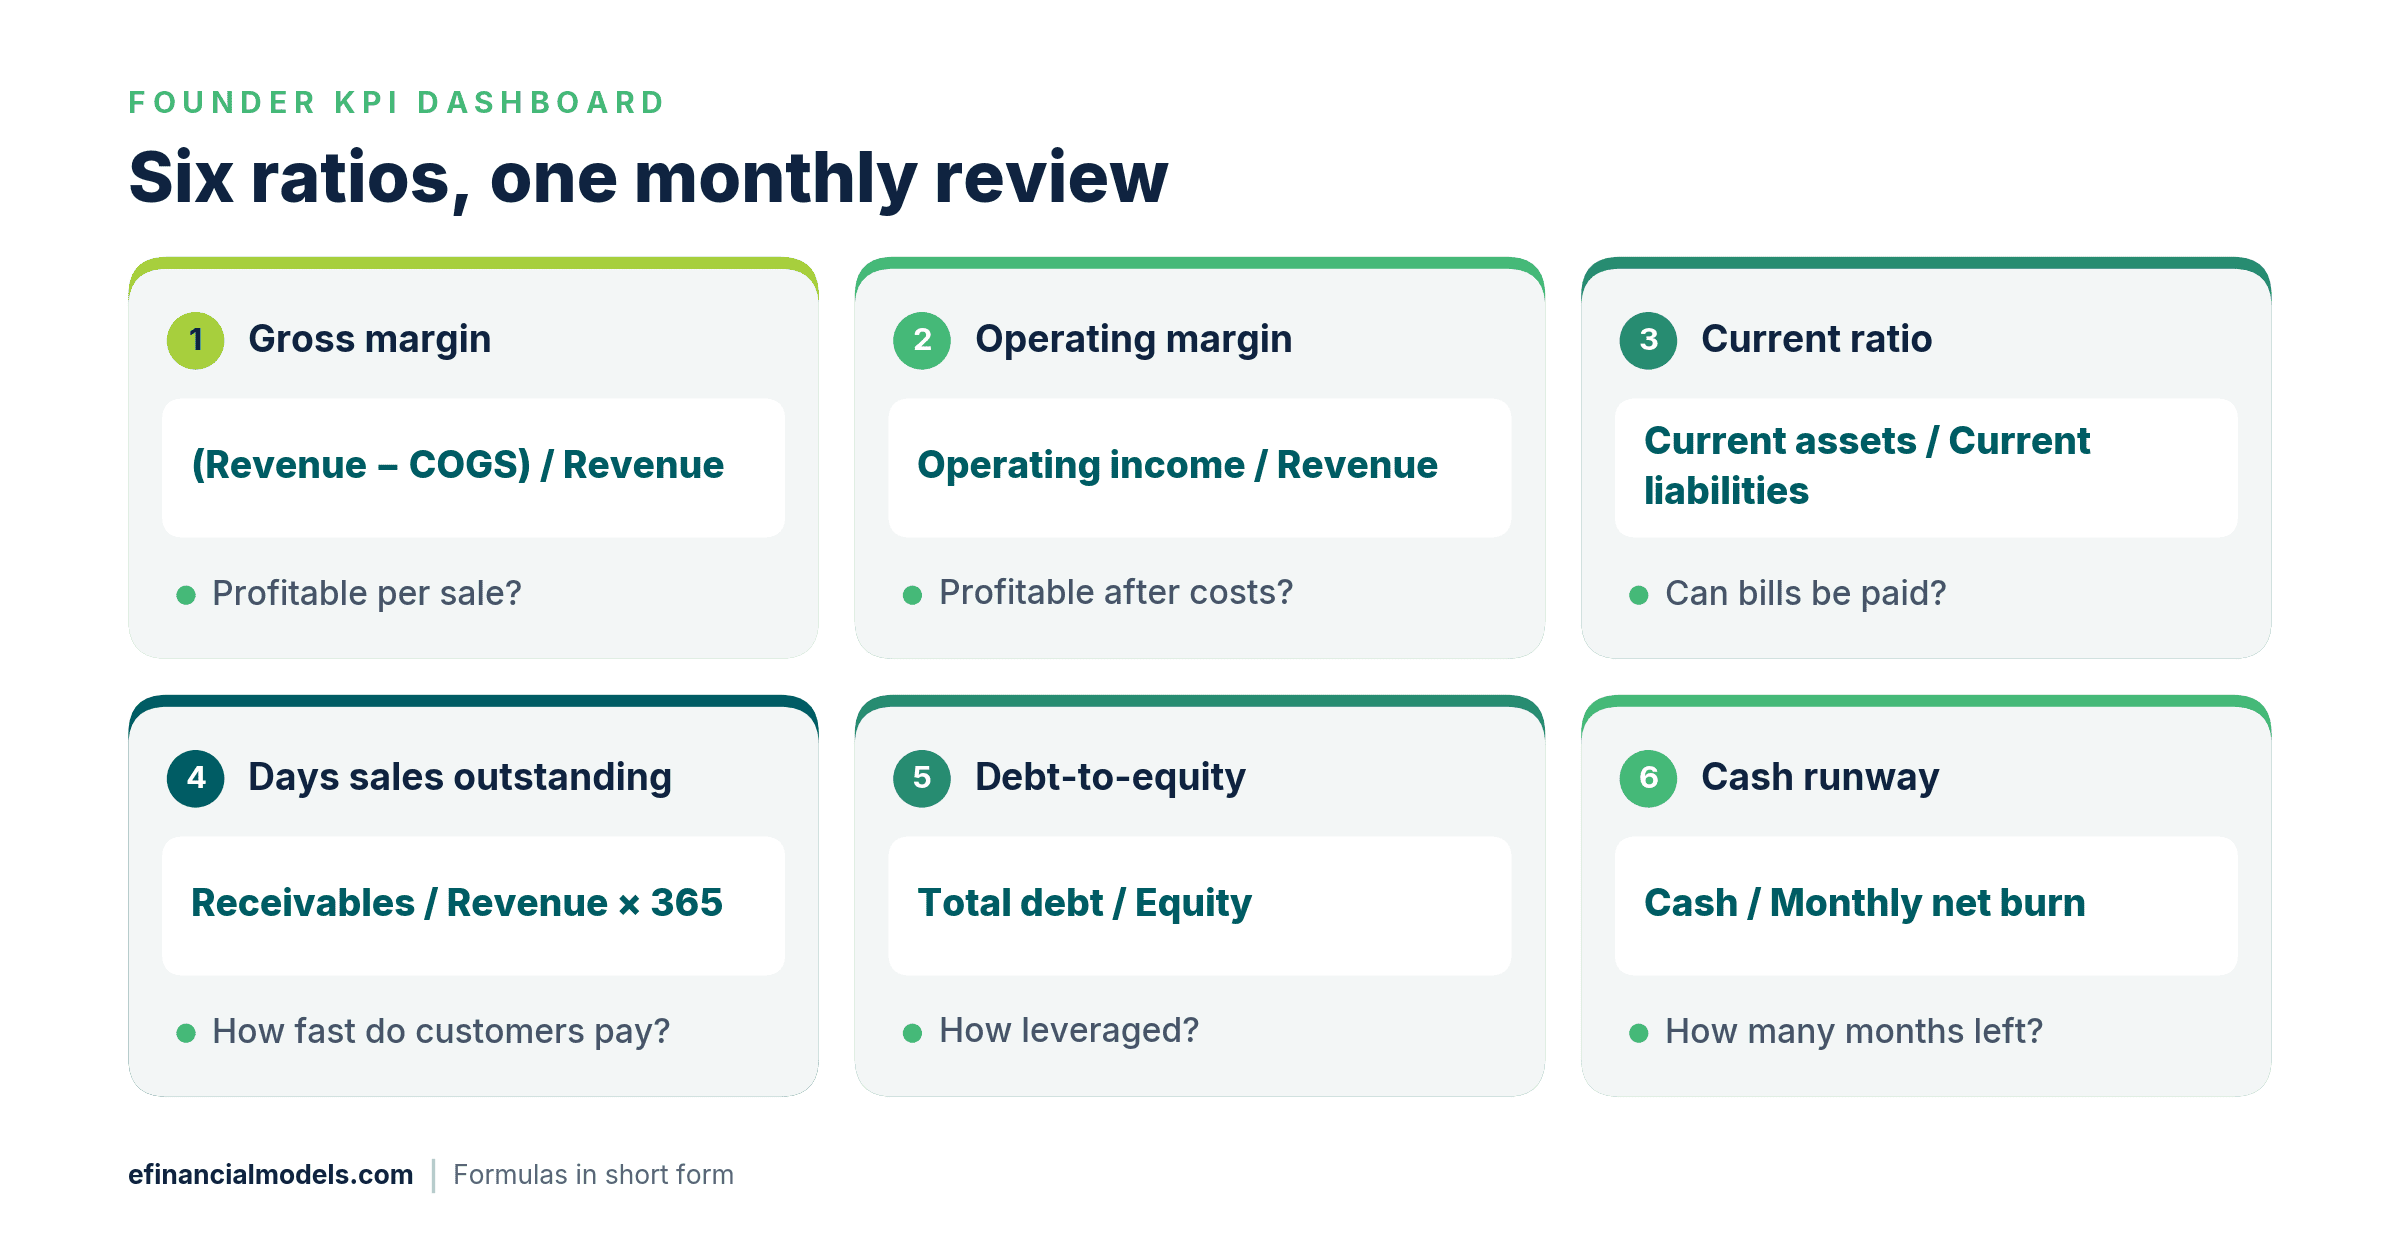
A one-page map of the six ratios, their formulas and the question each one answers.
Gross margin shows whether each sale earns enough
Gross margin is gross profit divided by net sales, where gross profit is revenue minus the cost of goods sold (COGS), the direct cost of producing what was sold (AccountingCoach). It tells a founder how many cents of each dollar remain to pay for everything else. A falling gross margin usually points to supplier price rises, discounting or a shift toward lower-margin products.
Operating margin shows whether the whole business pays for itself
Operating margin is operating income divided by net sales (Chase for Business). Operating income is gross profit minus operating expenses such as payroll, rent and marketing.
The current ratio shows whether short-term bills are covered
The current ratio compares a company’s current assets with its current liabilities (AccountingCoach). Current assets are cash and items expected to turn into cash within a year, mainly receivables and inventory. Current liabilities are the bills due within the same year. A result below 1.0 means short-term obligations exceed short-term assets, and a founder then needs a plan for the gap.
Days sales outstanding shows how fast customers pay
Days sales outstanding (DSO) counts the average days a sale stays unpaid. The formula has two steps: divide accounts receivable, the money customers still owe, by revenue, treating all sales as credit sales as the worked example below does, then multiply the result by the days in the year, usually 365. The worked example uses year-end receivables; average receivables give a smoother figure. Rising DSO means cash is stuck with customers. The accounts receivable templates on eFinancialModels track this by customer.
Debt-to-equity shows how much lenders fund the business
Debt-to-equity compares what the business owes with what its owners have invested (AccountingCoach). This guide measures what is owed as interest-bearing debt and divides it by shareholders’ equity, which isolates borrowing.
Cash runway shows how many months remain
Cash runway is the length of time a company can keep operating before it runs out of cash (Business Development Bank of Canada). It equals the closing cash balance divided by net monthly burn, which is the fall in cash over the period divided by the number of months. Profitable firms can still burn cash through inventory, equipment and debt repayments, so runway matters beyond start-ups. An unweighted fall 2025 survey sponsored by the lender Bluevine and republished by Stacker found that 39% of surveyed business owners held less than one month’s worth of operating expenses in cash (Stacker, October 2025).
Worked example: six ratios for one hypothetical company
Assume a hypothetical company with USD 4,800,000 of revenue, USD 2,160,000 of COGS and USD 2,352,000 of operating expenses. Year-end receivables are USD 720,000, inventory USD 300,000, current liabilities USD 900,000, total debt (interest-bearing borrowings) USD 1,100,000 and equity USD 1,375,000. Assume all sales are on credit, so revenue serves as credit sales. Cash fell from USD 840,000 to USD 600,000 during the year. Every blue cell in the inputs sheet is one of these assumptions.
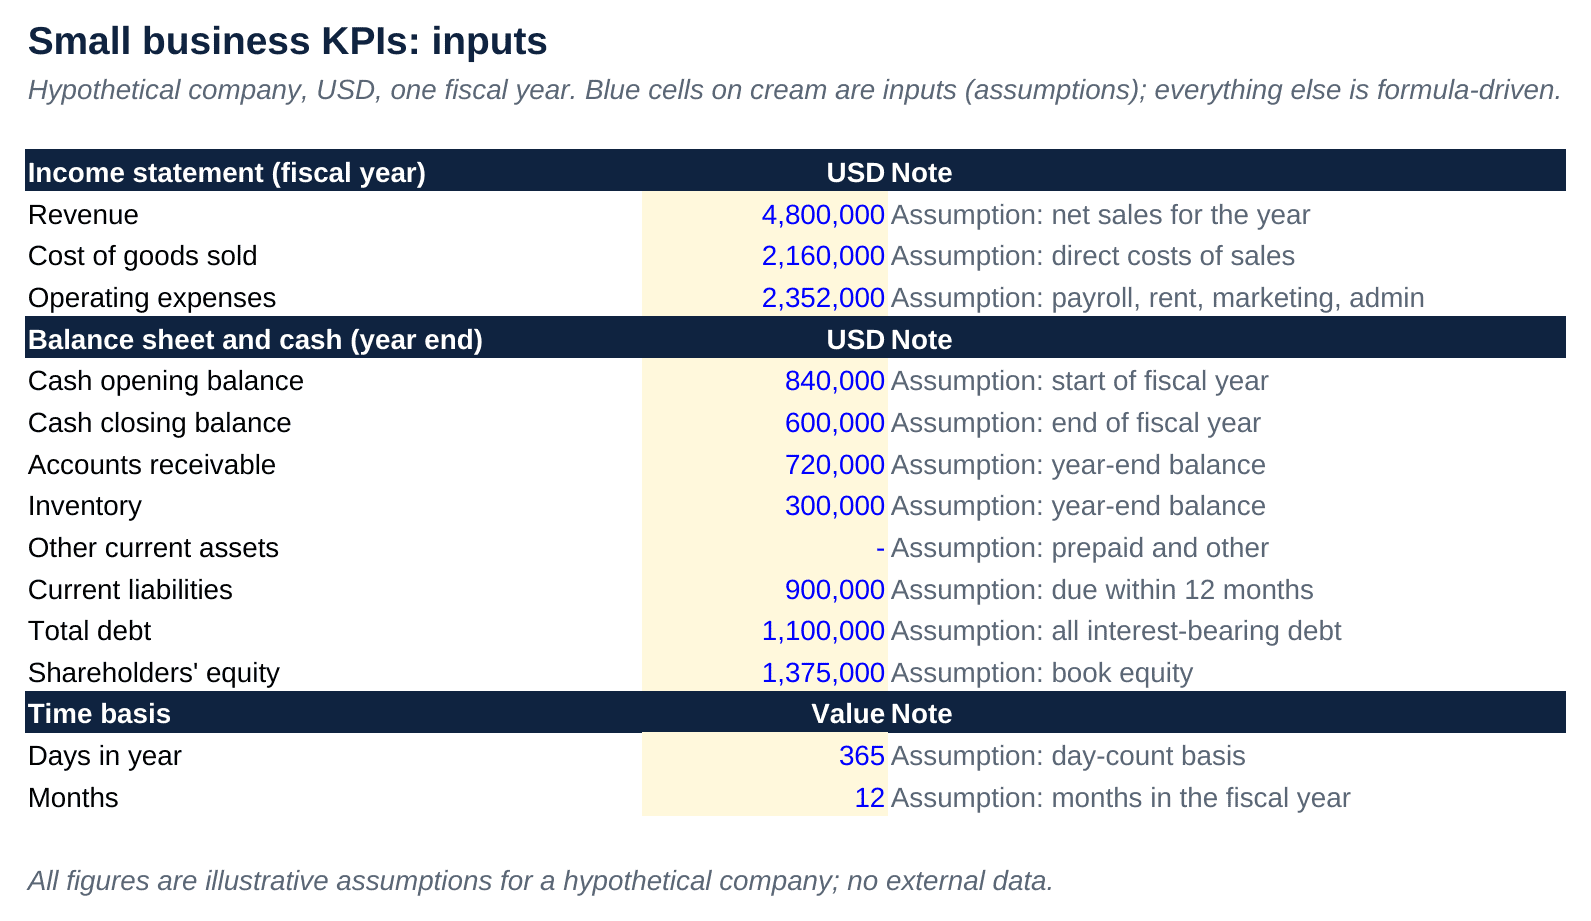
Inputs sheet of the worked example: every blue cell is an assumption a founder replaces with company figures. Source: eFinancialModels Analysis
The calculation sheet turns those inputs into the six ratios with live formulas. Gross profit is USD 2,640,000, so gross margin is 55.0%. Operating income is USD 288,000, so operating margin is 6.0%. Current assets are USD 1,620,000 (cash, receivables and inventory), so the current ratio is 1.80. DSO is 54.75 days, debt-to-equity is 0.80, and net monthly burn is USD 20,000, because cash fell by USD 240,000 over 12 months, which is USD 20,000 a month. Cash runway is the closing cash of USD 600,000 divided by that burn of USD 20,000, which gives 30.0 months.
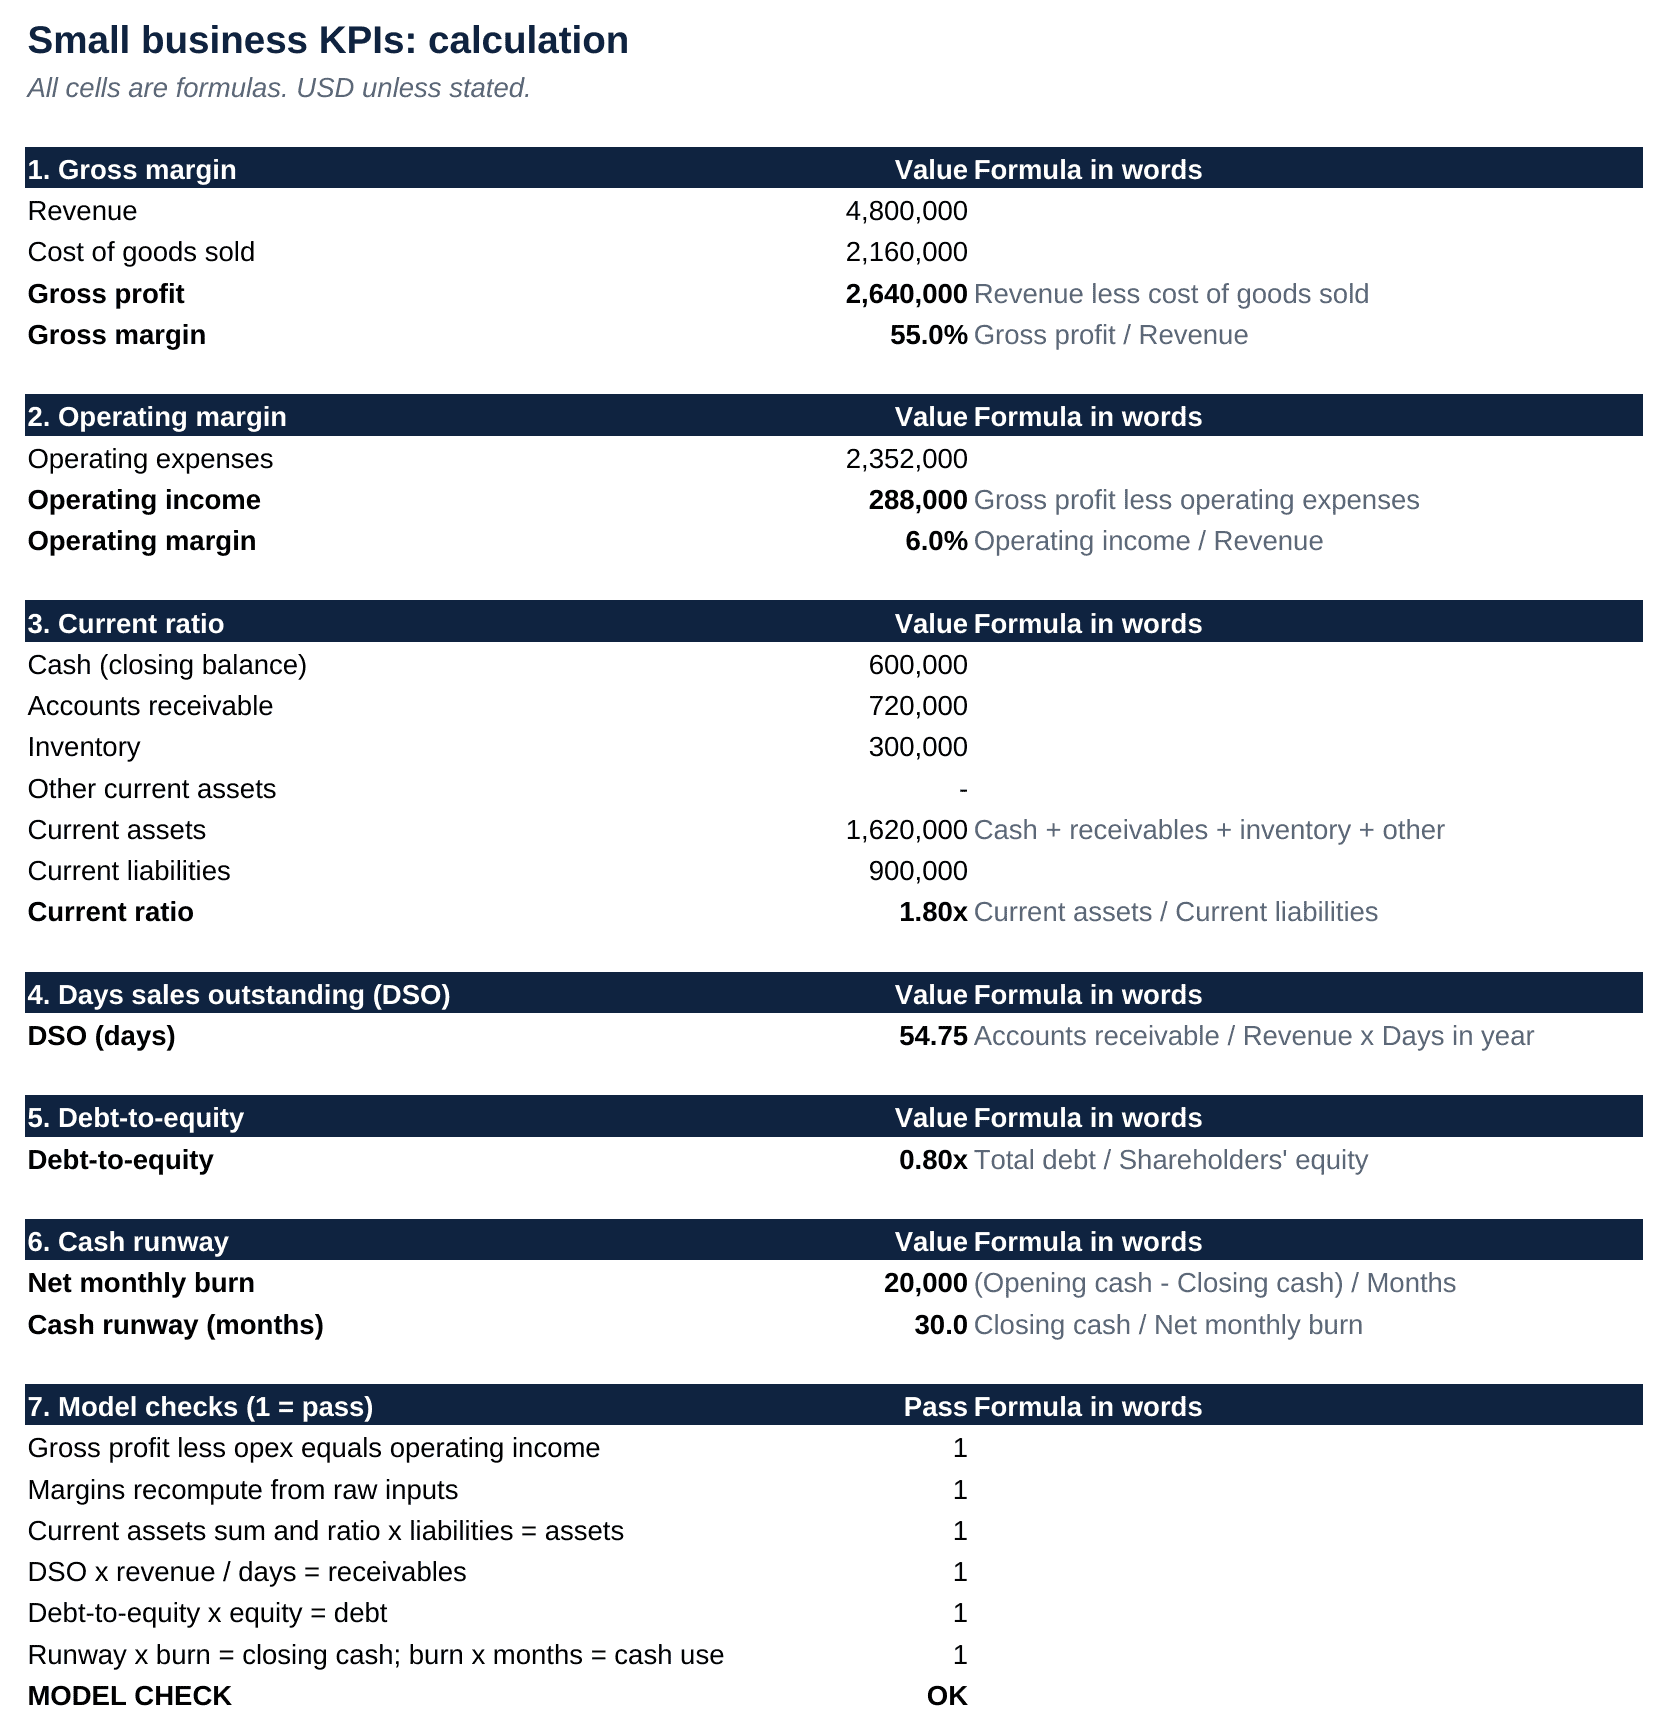
Calculation sheet: the six ratios as live formulas, with the reconciliation tests behind the model check. Source: eFinancialModels Analysis
| Ratio | Result | Reading in this example |
|---|---|---|
| Gross margin | 55.0% | 55 cents of each sales dollar remain after COGS |
| Operating margin | 6.0% | 6 cents of each sales dollar remain after all running costs |
| Current ratio | 1.80 | USD 1.80 of current assets per USD 1 of current liabilities |
| Days sales outstanding | 54.75 days | Customers take about 55 days to pay |
| Debt-to-equity | 0.80 | USD 0.80 of debt per USD 1 of equity |
| Cash runway | 30.0 months | 30 months of cash if the past year’s average burn continues |
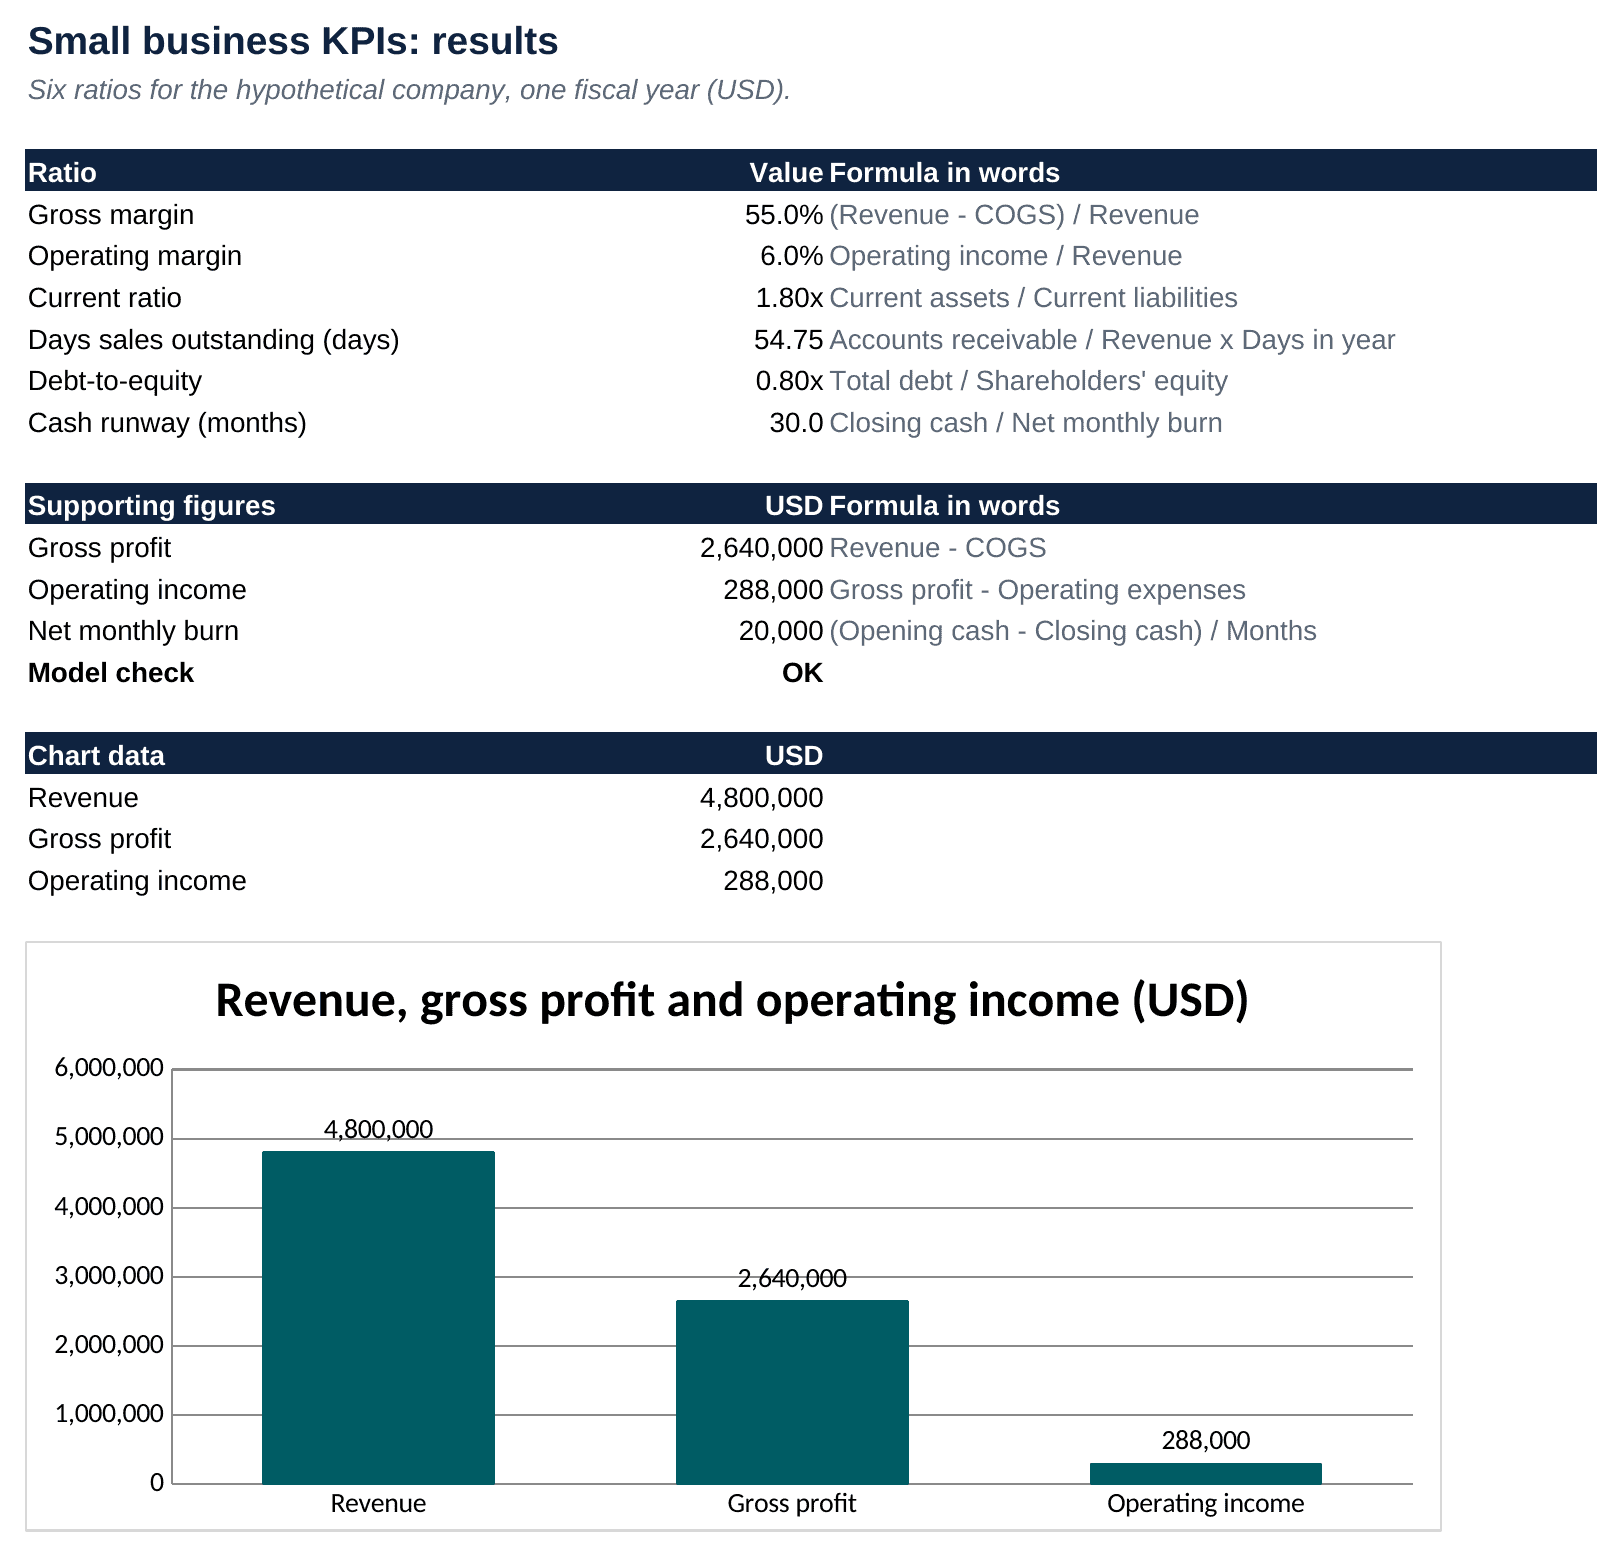
Results sheet: the six ratios on one page, next to the revenue to operating income chart. Source: eFinancialModels Analysis
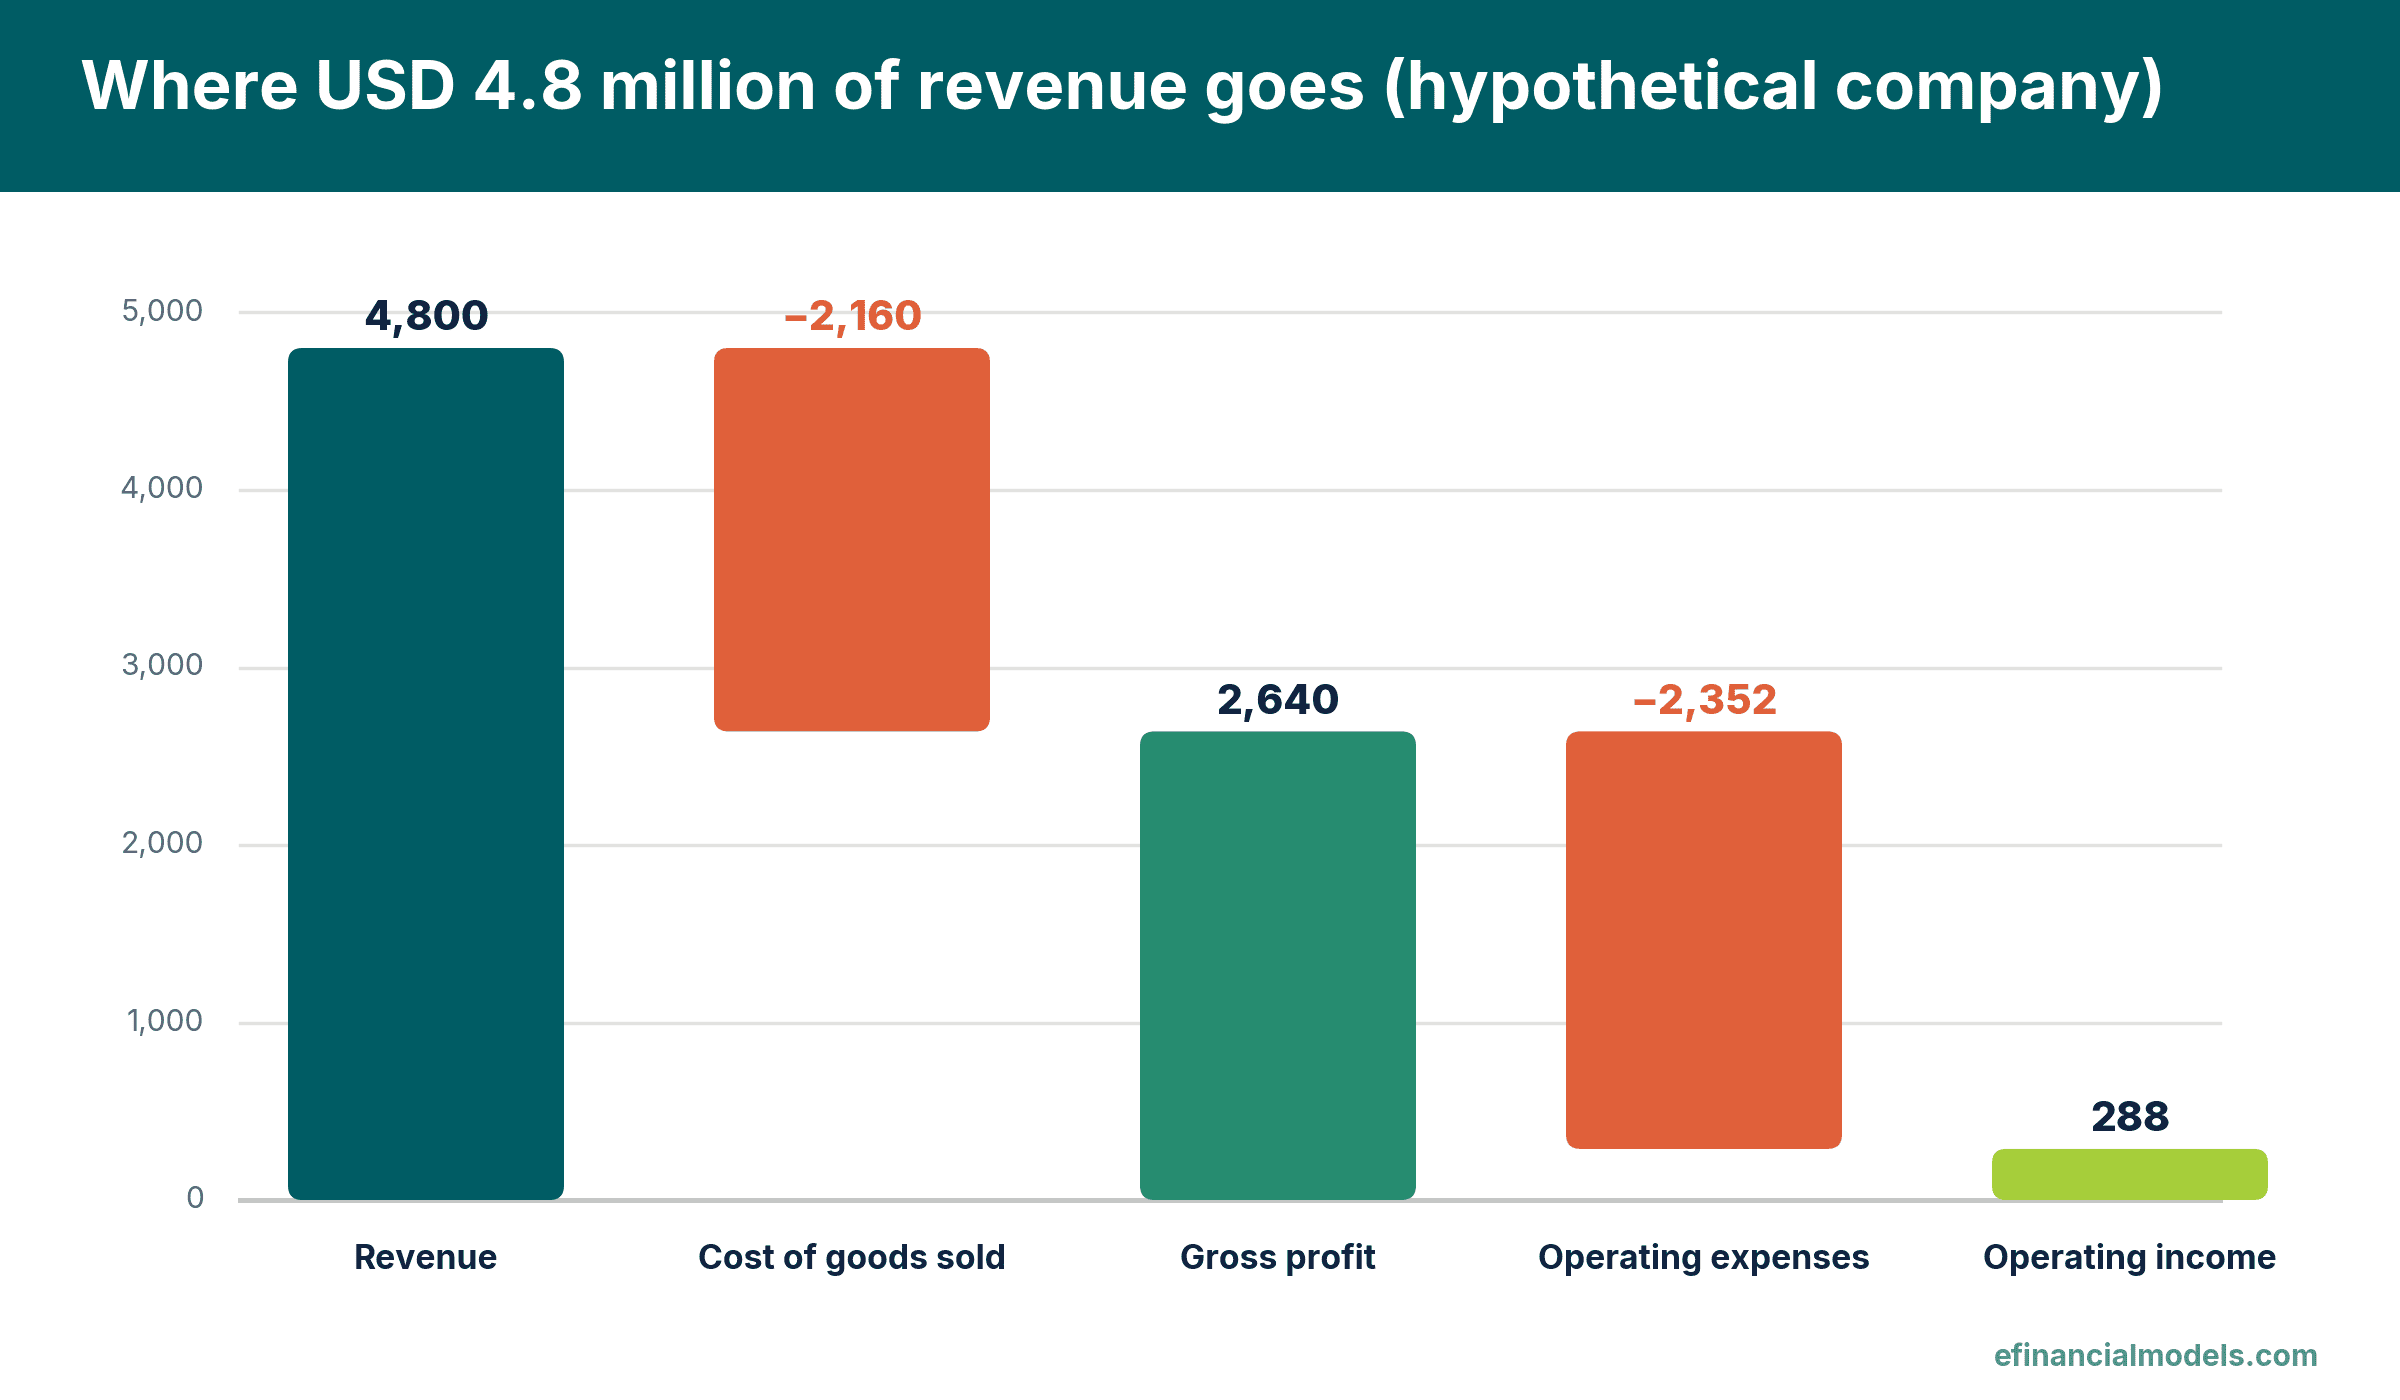
Waterfall of the hypothetical company’s revenue down to operating income, drawn from the same inputs. Source: eFinancialModels Analysis
The ratios also expose a tension. Operating income of USD 288,000 is a profit before interest and tax, yet cash fell by USD 240,000 over the year, because profit is not cash and the example also assumes outflows outside operating income, such as interest, tax, inventory growth, equipment and debt repayments, which are not itemised. The model check cell reads OK only when gross profit less operating expenses equals operating income, the margins recompute from the inputs, and the current assets, DSO, debt-to-equity and runway figures reconcile back to their inputs.
Read the six ratios together, every month
No single ratio tells the story. Strong margins with a rising DSO signal a collection problem, and a healthy current ratio with a shrinking runway signals that cash is being spent faster than it is earned. Higher is better for the two margins and for runway, while lower is better for DSO and debt-to-equity, and a current ratio below 1.0 calls for a plan. Targets differ by industry and business model, so each founder should set thresholds from the company’s own history and lender covenants, then review the six numbers after each month-end close. Peer benchmarks by sector are outside this guide; trade associations and lenders usually publish them.
Frequently Asked Questions
How often should a founder review these ratios?
Monthly is the practical rhythm, because the books are closed at month-end and a drift in any ratio can be caught before it compounds. Fast-moving businesses with thin cash, such as those financed by short credit lines, may add a weekly check of cash and receivables. Quarterly and annual views still matter for lenders and investors, but they arrive too late to steer day-to-day decisions.
Which ratio matters most for a business that sells on credit?
Days sales outstanding usually deserves first attention, since every extra day of waiting ties up cash that suppliers and staff expect to be paid on schedule. Pair it with the current ratio, because slow collections inflate receivables and can make liquidity look healthier than the bank balance suggests. Setting payment terms, sending prompt invoices and following up overdue accounts all move this number directly.
How is a KPI different from a financial ratio?
A KPI is any measure tied to a goal, including non-financial ones such as customer churn or delivery time. A financial ratio is one type of KPI, built by dividing one accounting figure by another. Ratios suit founders because they travel well across periods and between competitors. A dashboard normally mixes both, with ratios covering the money side and operational KPIs covering the work behind it.
What data does a founder need to calculate all six ratios?
An income statement and a balance sheet cover almost everything: revenue, COGS, operating expenses, cash, receivables, inventory, current liabilities, debt and equity. Runway also needs the cash balance from the start of the period, so the monthly decline can be measured. A basic accounting package exports these figures, and a spreadsheet then recalculates every ratio in seconds, and once saved, each month only needs fresh inputs.
Do the same targets apply in every industry?
No. A software firm and a distributor carry very different gross margins, inventory levels and payment terms, so a healthy figure in one sector can be a warning in another. Founders should compare each ratio with the company’s own trend first, then with peers of similar size and model. Lender requirements add a second reference point for the current ratio and debt-to-equity.
Conclusion
Six ratios give a founder a core monthly picture: two margins for profit, the current ratio and DSO for short-term cash, debt-to-equity for borrowing and runway for time. For a ready reference to the formulas, the free Financial Ratios Cheat Sheet from eFinancialModels sets out the current ratio, days receivables, gross profit margin and other liquidity, profitability and leverage ratios on one page.