0 ITEMS

How to Do a DCF Valuation: A Step-by-Step Guide for CFOs
A discounted cash flow (DCF) valuation estimates what a business is worth today by forecasting its free cash flow, discounting it at a rate that reflects risk, and adding a discounted terminal value. It works best for companies with positive, forecastable cash flows, and it needs a sensitivity test before anyone relies on the answer.
Key Takeaways
- A DCF values a business as the present value of forecast free cash flow, not of accounting profit.
- Five steps build it: forecast cash flow, set the discount rate, add terminal value, discount and sum, then bridge to equity value and test sensitivity.
- In the illustrative example, terminal value is 70.2% of a USD 41.72 million enterprise value, so assumptions drive the answer.
- A DCF suits positive, forecastable cash flows; for founder-led companies without steady cash generation it needs scenarios and market cross-checks.
- Cross-check the result against market multiples, and take tax or fairness questions to a tax adviser, lawyer or independent valuer.
A DCF turns forecast cash into today’s value
A discounted cash flow (DCF) valuation adds up a business’s future cash flows after reducing each one to today’s value. Free cash flow is operating profit after tax, taxed as if the business had no debt so that interest plays no part, plus depreciation, less capital expenditure and the increase in working capital (the cash tied up in receivables and inventory). Because free cash flow is measured before interest, it belongs to all funders of the business, which is why the next paragraph discounts it at a rate that blends debt and equity.
The discount rate is the annual return used to convert future cash into present value. When the cash flows belong to the whole firm, Aswath Damodaran of New York University notes that the appropriate rate is the cost of capital, the blended return required by everyone who funds the business (Damodaran, estimating discount rates). For most companies that is the weighted average cost of capital (WACC). The result is enterprise value, the value of the operating business before net debt. Subtracting net debt, which is borrowings less cash, gives equity value, the value that belongs to shareholders.
Five steps build a DCF valuation
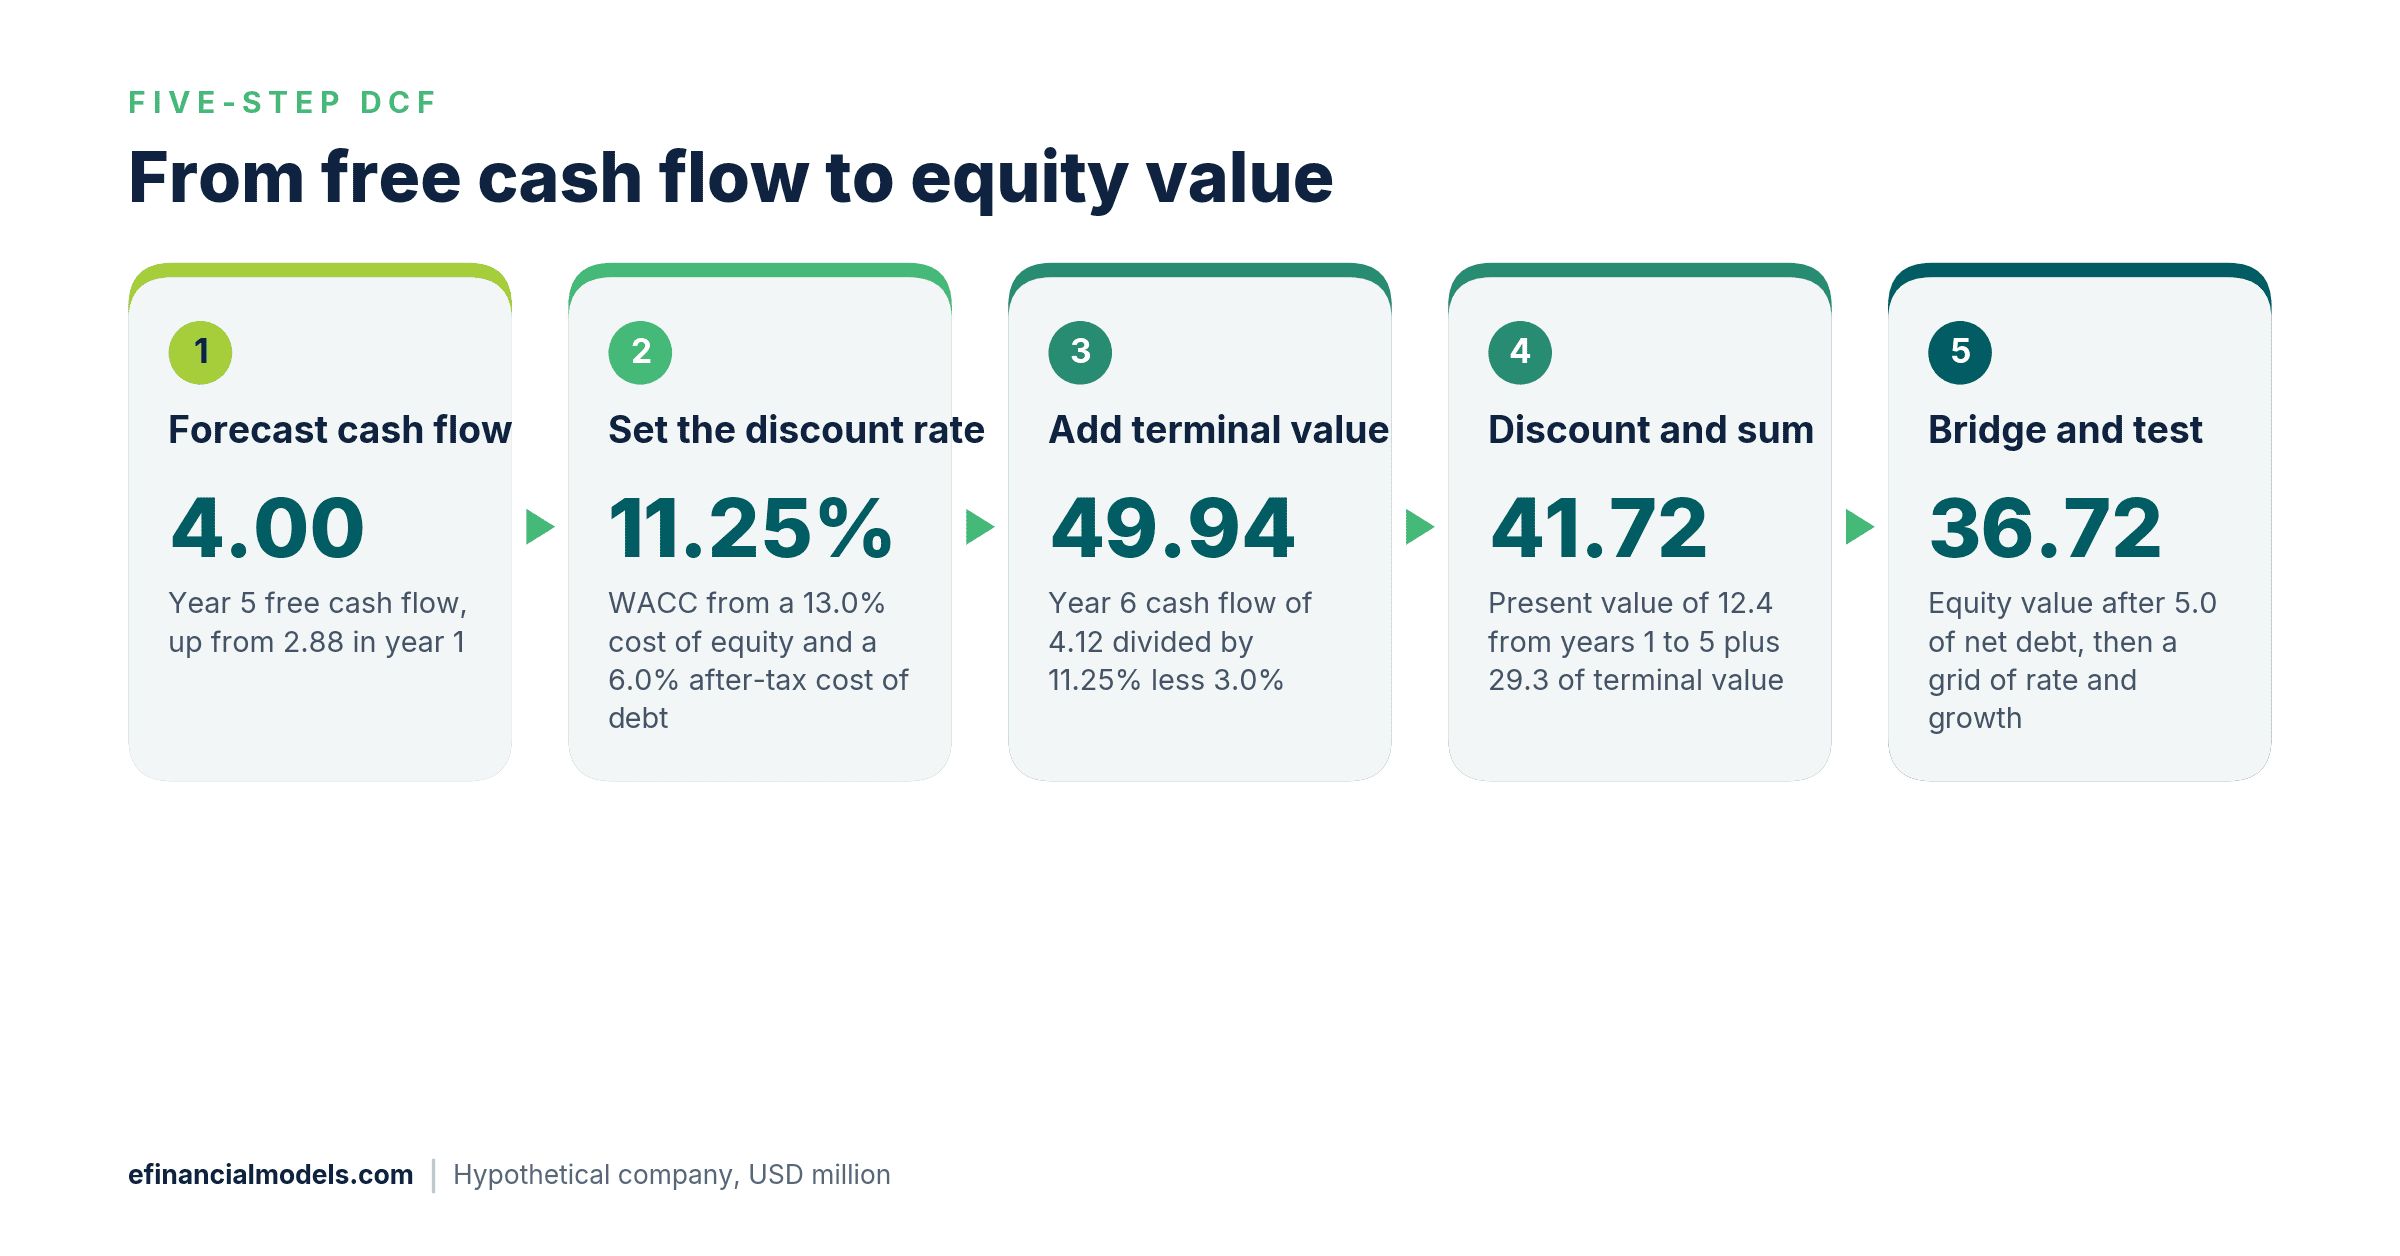
The worked example as five steps, in USD million, from year 5 free cash flow to equity value. Source: eFinancialModels Analysis
Step 1: Forecast free cash flow. Start from earnings before interest and tax (EBIT), which is operating profit. Subtract tax on that profit, add back depreciation, subtract capital expenditure, and subtract the increase in working capital. Run the forecast long enough for growth, margins and reinvestment to settle into a steady pattern, and keep every driver, such as margin and capital intensity, as a visible input.
Step 2: Set the discount rate. WACC weights two returns by how the business is funded: the cost of equity, which is the return shareholders require, and the after-tax cost of debt, which is the interest rate lenders charge reduced by the tax saving on interest. The cost of equity equals the risk-free rate, the return on a government bond with no default risk, plus beta, a measure of how strongly the company’s returns move with the market, times the equity risk premium, the extra return investors demand for holding equities. A size premium is added for small companies, which is a judgement call that not every valuer applies. A private company has no traded shares and so no observable beta; it takes a beta from comparable listed companies, adjusted to its own target capital structure.
Currency and inflation basis must match the cash flows, so nominal cash flows take a nominal rate.
Kroll recommended a US equity risk premium of 5.0% in its January 2026 update, to be paired with the higher of a normalized risk-free rate of 3.5% or the spot 20-year Treasury yield (Kroll, January 2026).
The 20-year US Treasury par yield was 5.29% on 6 November 2026 (US Treasury, daily par yield curve rates, November 2026).
Step 3: Add a terminal value. Terminal value is the value of all cash flows after the forecast period. The perpetuity growth method divides next year’s cash flow by the discount rate less the growth rate. Damodaran cautions that the constant growth rate cannot be greater than the overall growth rate of the economy, and that a large portion of a business’s value comes from the terminal value (Damodaran, closure in valuation).
Step 4: Discount and sum. Divide each year’s free cash flow by one plus the discount rate, raised to the power of the year number. Add the present value of the terminal value to reach enterprise value.
Step 5: Bridge to equity value and test the result. Subtract net debt from enterprise value to reach equity value. Sensitivity analysis is the practice of changing one or two inputs at a time to show how far the value moves, and the grid in the worked example below applies it to the discount rate and terminal growth. Then compare the implied multiple with market multiples for similar companies. Ready-made grids for this step sit in the eFinancialModels DCF model and WACC collections.
Worked example: a hypothetical company with an enterprise value of USD 41.72 million
The hypothetical company has USD 20.0 million of revenue today, and revenue rises by USD 2.0 million a year. The illustrative assumptions are an EBIT margin of 20%, tax of 25%, depreciation of 5% of revenue, capital expenditure of 6% of revenue, a working capital increase of 10% of each year’s revenue rise, and net debt of USD 5.0 million.
For the discount rate, assume a risk-free rate of 5.3%, an equity risk premium of 5.0%, a beta of 1.2 and a size premium of 1.7%. The cost of equity is 5.3% + 1.2 x 5.0% + 1.7% = 13.0%. Assume a pre-tax cost of debt of 8.0%, which is 6.0% after 25% tax. With 75% equity and 25% debt, WACC is 0.75 x 13.0% + 0.25 x 6.0% = 11.25%. Assume terminal growth of 3.0%.
| Year | Revenue | Operating profit after tax, before interest | Depreciation | Capital expenditure | Working capital increase | Free cash flow | Discount factor | Present value |
|---|---|---|---|---|---|---|---|---|
| 1 | 22.0 | 3.30 | 1.10 | 1.32 | 0.20 | 2.88 | 0.89888 | 2.589 |
| 2 | 24.0 | 3.60 | 1.20 | 1.44 | 0.20 | 3.16 | 0.80798 | 2.553 |
| 3 | 26.0 | 3.90 | 1.30 | 1.56 | 0.20 | 3.44 | 0.72627 | 2.498 |
| 4 | 28.0 | 4.20 | 1.40 | 1.68 | 0.20 | 3.72 | 0.65283 | 2.429 |
| 5 | 30.0 | 4.50 | 1.50 | 1.80 | 0.20 | 4.00 | 0.58681 | 2.347 |
USD million. Operating profit after tax is EBIT less 25% tax. The discount factor is 1 divided by 1.1125 raised to the year number.
The present value of years 1 to 5 sums to 12.416. Treating year 5 as steady enough for terminal growth is a simplification, since a stricter model would extend the forecast until reinvestment matches 3.0% growth. The year 6 cash flow is 4.00 x 1.03 = 4.12, so the terminal value is 4.12 / (0.1125 – 0.030) = 49.94. Its present value is 49.94 x 0.58681 = 29.305. Enterprise value is 12.416 + 29.305 = 41.721, shown as 41.72, and equity value is 41.721 – 5.00 = 36.721, shown as 36.72. Terminal value supplies 29.305 / 41.721 = 70.2% of the total. Year 1 earnings before interest, tax, depreciation and amortisation (EBITDA) are 4.40 + 1.10 = 5.50, so the implied multiple of enterprise value to forward EBITDA is 41.721 / 5.50 = 7.6 times. Market multiples used for comparison must be on the same forward basis.
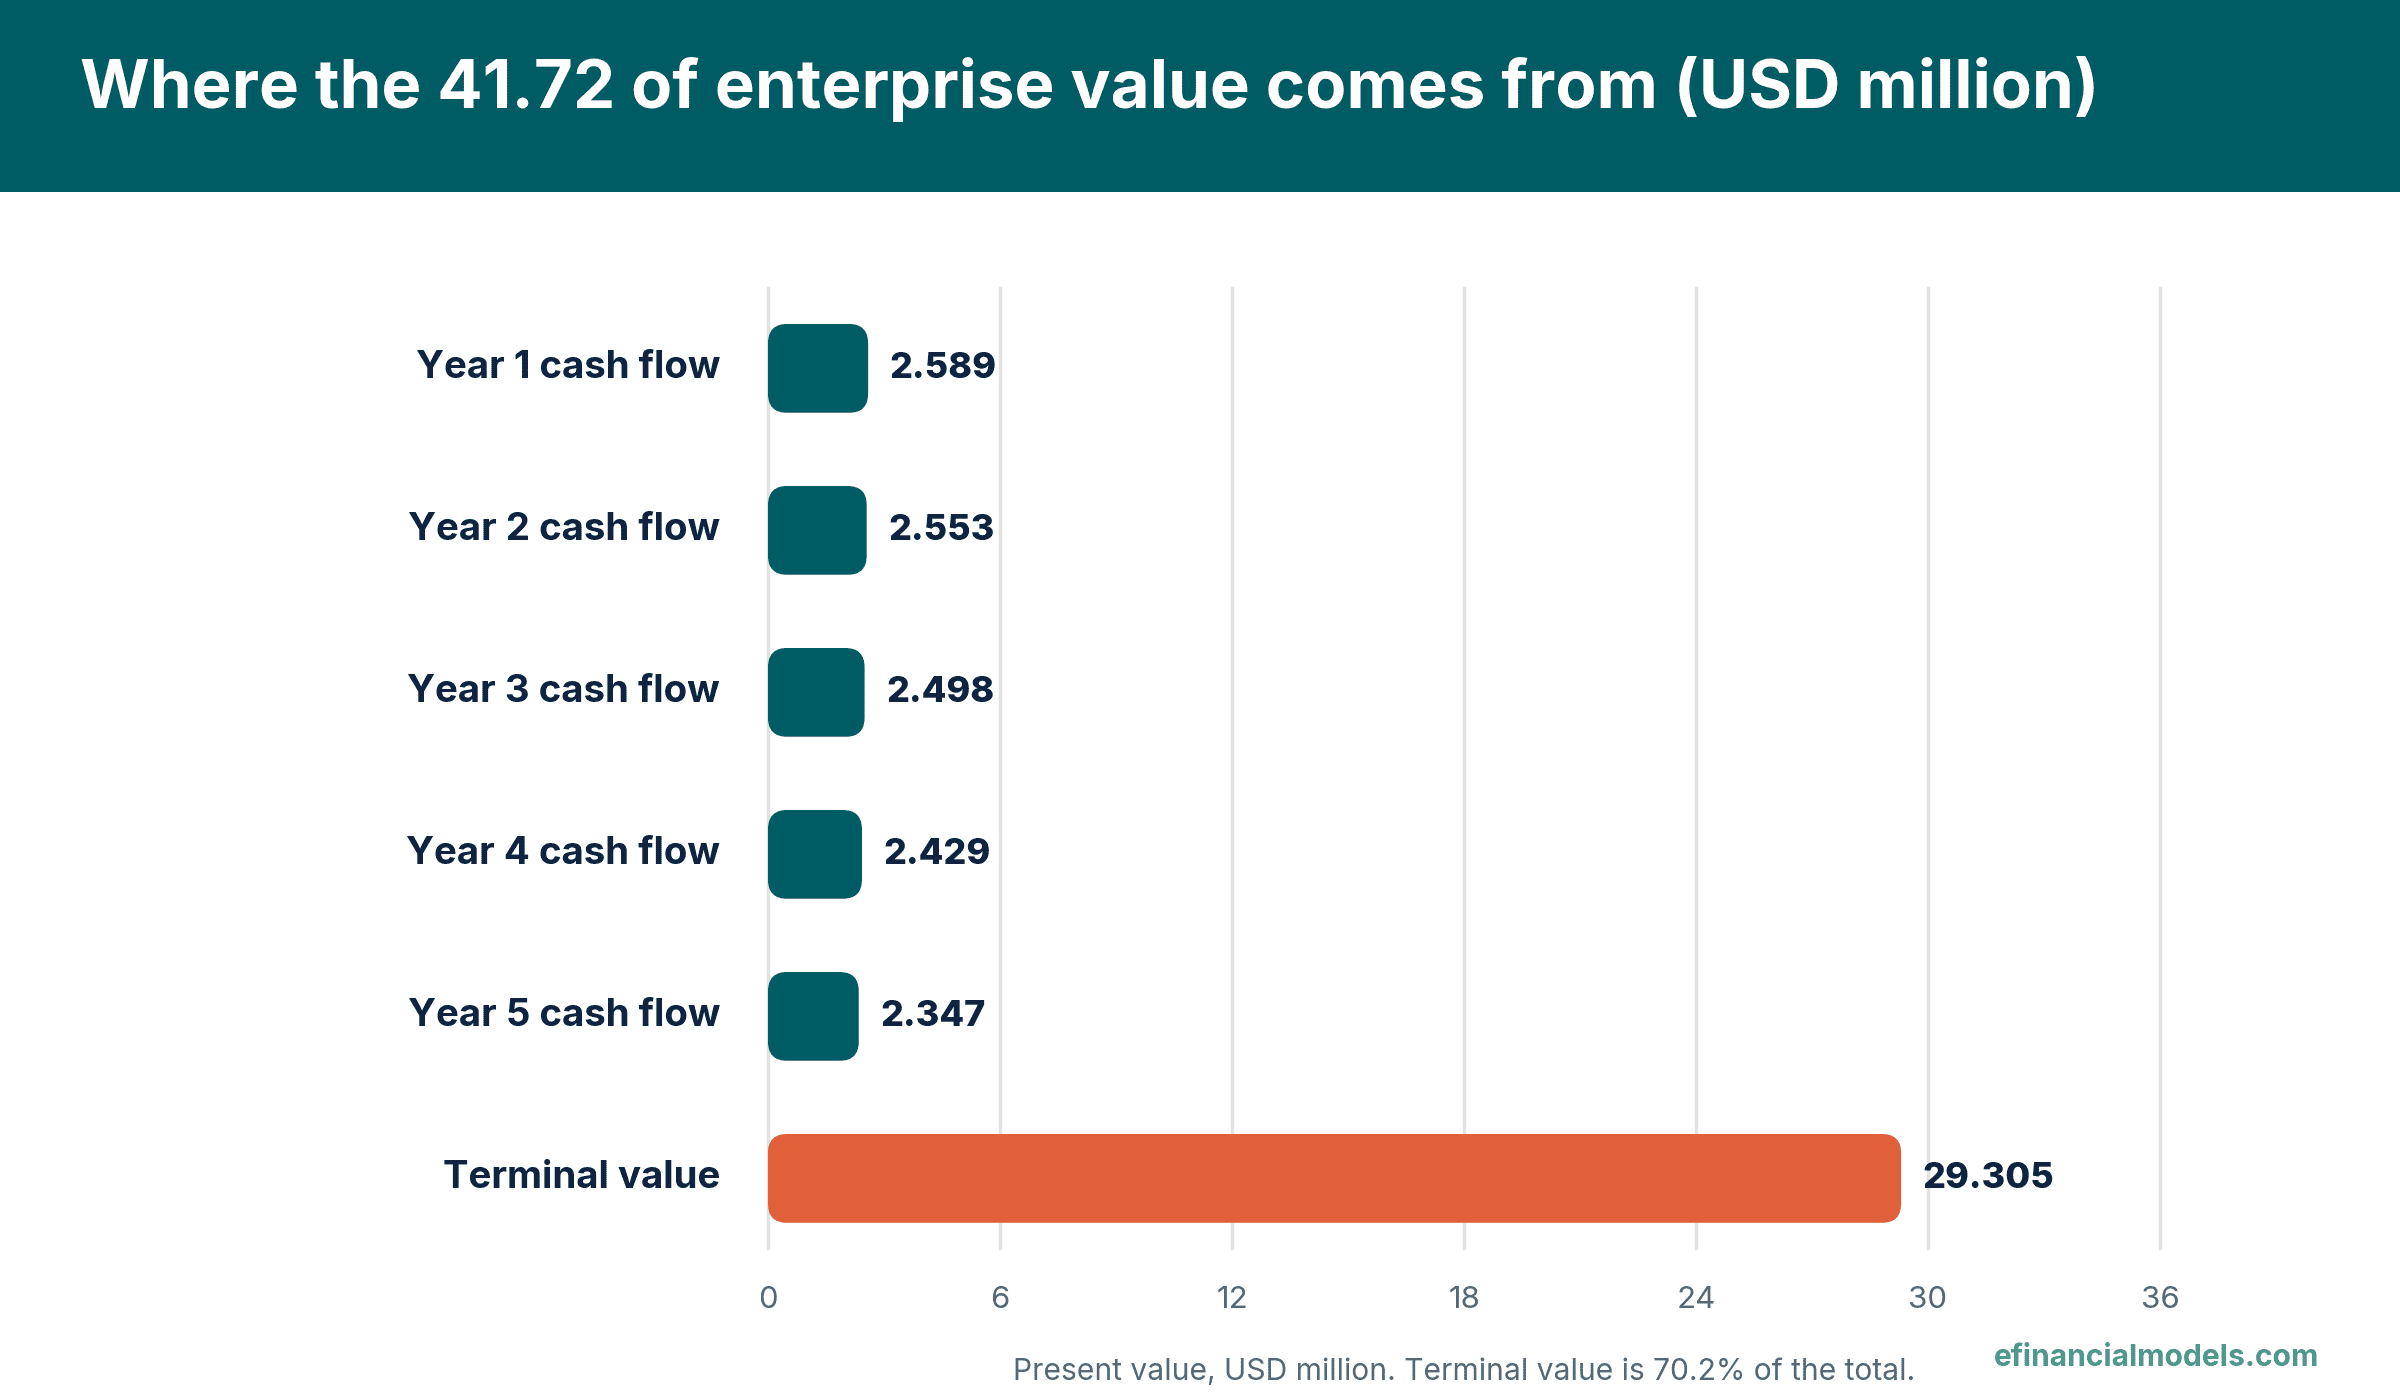
Present value of each component of the 41.72 enterprise value in USD million, drawn from the worked example table. Source: eFinancialModels Analysis
The sensitivity grid shows enterprise value in USD million, to two decimals, when the discount rate and terminal growth move around the base case.
| Discount rate | Growth 2.0% | Growth 3.0% | Growth 4.0% |
|---|---|---|---|
| 10.25% | 43.11 | 47.64 | 53.61 |
| 11.25% | 38.30 | 41.72 | 46.09 |
| 12.25% | 34.43 | 37.09 | 40.39 |
The range runs from 34.43 to 53.61 although every cell uses reasonable inputs. A CFO who presents the single figure of 41.72 without this grid hides most of the uncertainty.
When a DCF is actually useful for a founder-led company
A DCF is useful when free cash flow is positive and can be forecast from observable drivers: a profitable founder-led business preparing for a sale, a subscription or contract business with predictable renewals, or an internal decision on where to invest capital. It is a weaker tool for a company with no earnings and little history. In his work on young companies, Damodaran describes cash flows from existing assets as nonexistent or negative, with limited historical data that makes risk difficult to assess (Damodaran, the dark side of valuation).
For an early-stage company, the CFO treats the DCF as one scenario-based view and anchors the price on market evidence such as recent funding rounds and comparable companies. Negative early cash flows are modelled as negative, and the terminal year is normalised to a steady state. When breakeven lies far out, almost all the value rests on the terminal value, which is the signal to lean on other methods.
Some parts of a founder’s situation lie outside what a DCF can settle. Fairness between founders and investors, the difference between tax value and price, and the pricing of share options for tax purposes follow legal and tax standards. A tax adviser, a lawyer and an independent valuer should confirm those points before any figure is used.
Conclusion
A DCF is only as reliable as its inputs, so a CFO should document each driver, show the sensitivity grid and cross-check the result against market multiples. Finance teams that want a ready structure can start from the eFinancialModels Free Discounted Cash Flow (DCF) Valuation Model Template, a free template for valuing a business with discounted cash flow.
Frequently Asked Questions
How long should the forecast period be?
The forecast should end only when the business has reached a steady state, meaning growth, margins and reinvestment are no longer changing from year to year. A mature, slow-growing company can be forecast over a short horizon, while a fast-growing company needs more years so that the terminal value does not carry an unfinished growth story. Adding years without evidence only creates false precision, so each extra year needs a driver the CFO can defend.
Should cash flows be discounted at year end or mid-year?
Year-end discounting assumes all cash arrives on the last day of each year, which is simple but conservative. The mid-year convention assumes cash arrives evenly through the year and discounts each flow by half a year less, which raises the value slightly. Either is acceptable if applied consistently to the forecast years and the terminal value. The worked example uses year-end discounting so every figure can be recomputed by hand.
Is a DCF better than market multiples?
They answer different questions. A DCF values the company’s own plan and shows which assumptions matter, while multiples show what buyers and investors currently pay for similar businesses. A CFO usually runs both and then explains the gap. A large difference means either the plan is more optimistic than the market, or the comparable companies differ from the target in growth, risk or size.
What if free cash flow is negative in the early years?
Negative years enter the sum as negative present values and reduce enterprise value, so nothing is skipped. The difficulty is that the terminal value then supplies most or all of the result, and small changes in the discount rate or growth rate swing it. Building two or three scenarios with explicit probabilities, and checking each against market evidence, gives a more honest range than one base case.
Should the weights in WACC use book or market values?
Market values are the better choice because the weights describe what investors would require today, not what was recorded in the past. Damodaran states that the weights used to compute the cost of capital should be market value weights for debt and equity (Damodaran, estimating discount rates). For a private company with no traded shares, the CFO uses a target capital structure drawn from comparable companies and states the choice.