0 ITEMS

Valuing a Pre-Revenue Startup: Methods That Actually Hold Up
Pre-revenue startups are valued by triangulating the Berkus, Scorecard and venture capital methods against market medians, because a forecast has no operating history to rest on. In a seed round, the investor’s target return and required ownership turn that range into one negotiated price, as the worked example below shows.
Key Takeaways
- No single method values a pre-revenue startup; use three methods and compare each result with seed market medians.
- Post-money valuation equals pre-money valuation plus the amount invested, and investor ownership equals the amount invested divided by post-money valuation.
- The venture capital method works backward: post-money valuation = expected exit value × retention ÷ target multiple.
- In the worked example, USD 1.5 million at USD 6.0 million pre-money buys 20% and leaves founders 70%, with no prior investors or SAFEs.
- The option pool sits in the pre-closing capitalization, so it dilutes founders and earlier holders, not the new investor.
Seed investors set the price from ownership and return
Pre-money valuation is the value of a company before a financing, and post-money valuation is the pre-money valuation plus the amount invested (Cooley). Investor ownership therefore equals the investment divided by the post-money valuation. A venture capital valuation, according to Cooley, “is established through negotiations between investors and founders” (Cooley).
A forecast cannot anchor that negotiation. Aswath Damodaran of New York University’s Stern School of Business lists nonexistent or negative cash flows from existing assets and limited historical data among the problems of valuing young companies (Damodaran, Stern School). Discounted cash flow (DCF) valuation, which converts forecast cash flows into today’s value at a discount rate, the annual return an investor requires, depends on exactly that history.
Seed medians and valuation caps set the market range
Gunderson Dettmer reported a median pre-money valuation of USD 22.0 million for Series Seed financings in 2025, up 10% from the year before (Gunderson Dettmer, 2025 report).
Wilson Sonsini’s deal data show median seed valuations easing to USD 23.0 million in the second quarter of 2026, after a high of USD 35.0 million in the prior quarter (Wilson Sonsini, Q2 2026).
The two medians come from different firms and periods (2025 and the second quarter of 2026), cover all seed financings each firm handled, with or without revenue, and state no geography, so they are an upper reference, not a pre-revenue benchmark. Wilson Sonsini does not say whether its figure is pre-money.
A simple agreement for future equity (SAFE) is a contract that converts into shares at a later priced round, at a price set by a valuation cap, the ceiling on the valuation used for conversion.
The median SAFE valuation cap was USD 15.0 million in the first half of 2026, and 89% of capped SAFEs used a post-money structure, according to Wilson Sonsini’s Q2 2026 report (Wilson Sonsini, Q2 2026).
In a post-money SAFE, ownership equals the SAFE amount divided by the valuation cap, counting all converting SAFEs but before the priced round’s new money dilutes it (Legal 500, 2026). A valuation cap is a conversion ceiling, usually post-money, so it is not comparable with a pre-money median.
Three methods turn a pre-revenue startup into a number
Berkus method: a checklist with a ceiling
The Berkus method adds up to USD 0.5 million for each of five milestones: a sound idea, a prototype, a quality management team, strategic relationships, and product rollout or sales. Dave Berkus states that these maximums allow a pre-revenue valuation of up to USD 2 million before rollout, or up to USD 2.5 million after rollout (Berkus, 2024).
Scorecard method: a regional median adjusted by weights
Bill Payne’s Scorecard method starts with the median pre-money valuation of pre-revenue companies in the target’s region and business sector. It then scores the startup against comparable deals on seven weighted factors, led by management team (up to 30%) and size of the opportunity (up to 25%) (Angel Capital Association, 2019). The sum of weighted scores multiplies the median, which a founder can source from local angel groups or deal databases.
Venture capital method: start from the exit
The venture capital (VC) method values a startup from the investor’s required return: post-money valuation = expected exit value × retention ÷ target multiple. Retention equals one minus the dilution from future funding rounds, and the target multiple is the cash the investor requires back per dollar invested. A university lecture version discounts a USD 100 million exit at 50% for five years to a USD 13.2 million post-money valuation, with discount rates ranging from 25% to 80% (Massachusetts Institute of Technology, 2011).
Worked example: a USD 1.5 million seed round
The inputs below are illustrative assumptions for a hypothetical startup with a prototype, a strong founding team and no revenue. The assumed USD 5.0 million median sits far below the USD 22.0 to 23.0 million seed medians above, so founders should compare results with a median from their own market.
- Investment sought: USD 1.5 million.
- Median pre-money valuation of comparable pre-revenue deals in its region and sector: USD 5.0 million (assumed).
- Expected exit value in year 5: USD 125 million, with 40% dilution from later rounds, so retention is 60%.
- Target return: 10 times the money invested, and a 10% option pool, equal to 10% of post-closing shares and counted in the pre-money valuation.
Berkus. Sound idea USD 0.4 million, prototype USD 0.4 million, management team USD 0.5 million, strategic relationships USD 0.1 million and rollout USD 0 give USD 1.4 million, below the USD 2.0 million pre-rollout ceiling.
Scorecard. The weights come from the Angel Capital Association list.
| Factor | Weight | Comparison with median | Weighted score |
|---|---|---|---|
| Management team | 30% | 125% | 0.375 |
| Size of the opportunity | 25% | 100% | 0.250 |
| Product or technology | 15% | 90% | 0.135 |
| Competitive environment | 10% | 80% | 0.080 |
| Marketing, sales, partnerships | 10% | 100% | 0.100 |
| Need for additional investment | 5% | 100% | 0.050 |
| Other factors | 5% | 100% | 0.050 |
| Sum | 100% | 1.040 |
The Scorecard pre-money valuation is 1.040 × USD 5.0 million = USD 5.2 million.
Venture capital method. Post-money valuation = USD 125 million × 0.60 ÷ 10 = USD 7.5 million. Pre-money valuation = 7.5 − 1.5 = USD 6.0 million. The ownership formula gives the investor 1.5 ÷ 7.5 = 20% at closing. At exit the investor still holds 20% × 0.60 = 12%, because retention is 60%, and 12% of USD 125 million is USD 15 million, 10 times the investment. Ten times the money in five years is a compound annual return of about 58.5% (10 to the power 0.2, minus 1), inside the 25% to 80% range above.
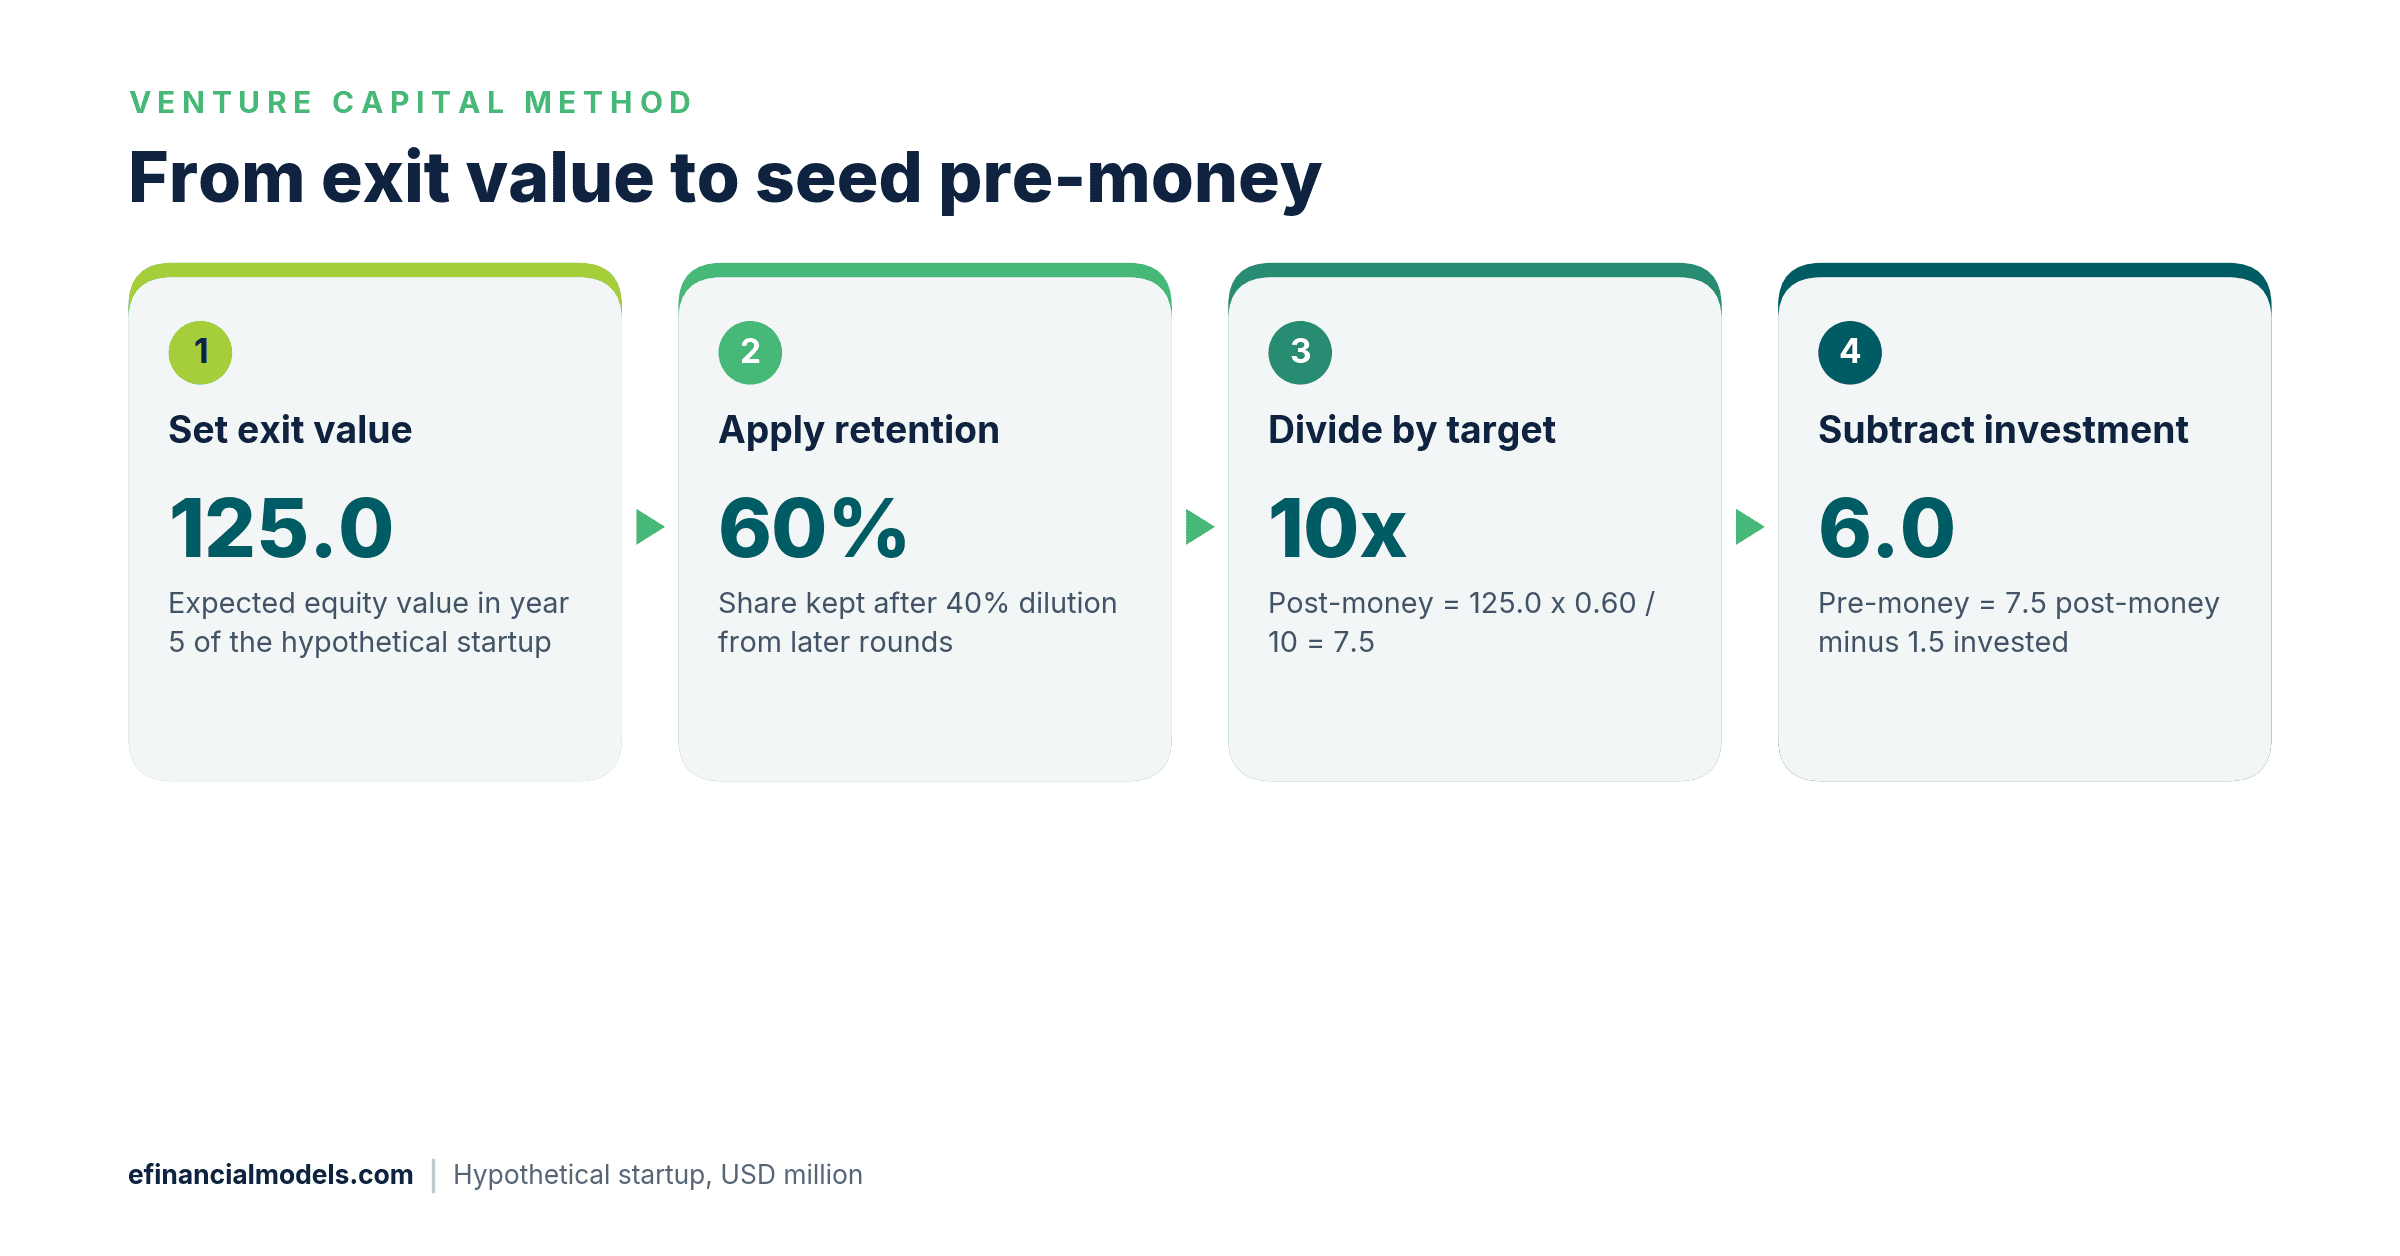
The venture capital method for the hypothetical startup, computed from the worked example assumptions (USD million, illustrative).
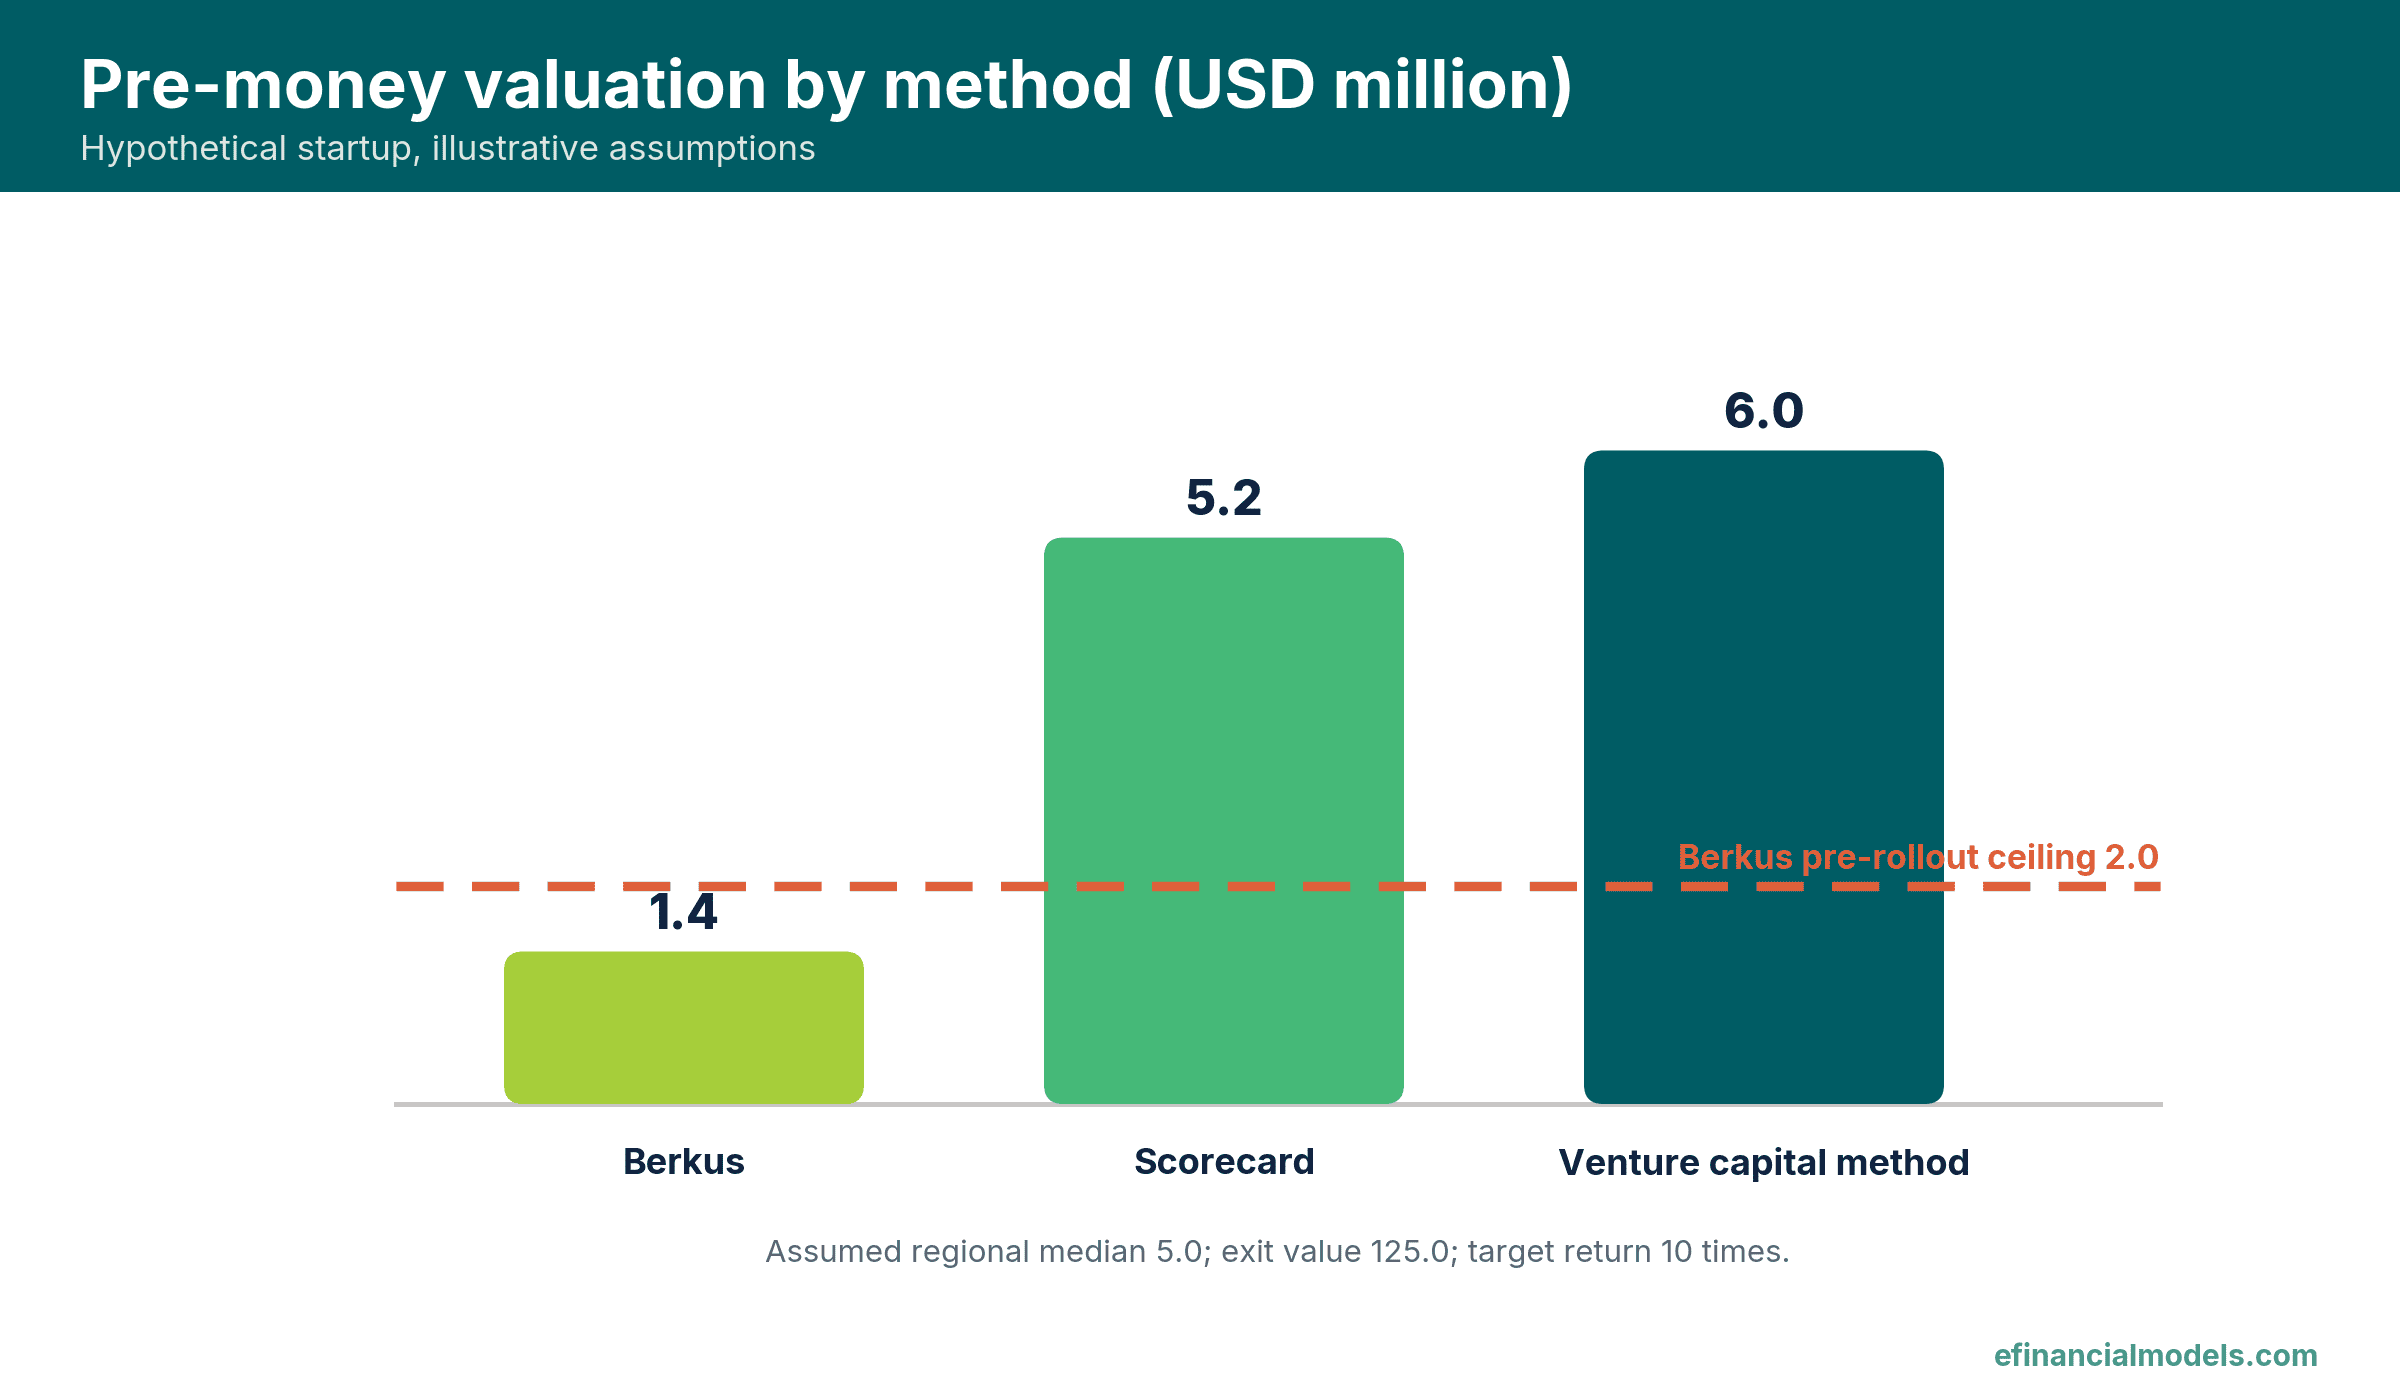
Pre-money results of the three methods in the worked example; the Berkus bar stays under its USD 2.0 million ceiling (illustrative assumptions).
The Berkus result values milestones only, capped at USD 2.0 million before rollout, so the gap shows how much of a USD 6.0 million ask rests on market and return expectations. The Scorecard and VC results differ by USD 0.8 million, which marks the negotiating range.
The option pool changes the founders’ share. Cooley explains that investors usually count the pool in the pre-closing capitalization, so it dilutes existing holders and not the new shares (Cooley). With 10,000,000 fully diluted shares after closing, the price is USD 7.5 million ÷ 10,000,000 = USD 0.75 per share.
| Holder | Shares | Share of post-money | Value (USD million) |
|---|---|---|---|
| Founders | 7,000,000 | 70% | 5.25 |
| Option pool | 1,000,000 | 10% | 0.75 |
| Investor | 2,000,000 | 20% | 1.50 |
| Total | 10,000,000 | 100% | 7.50 |
Pre-money valuation = founders 5.25 + pool 0.75 = USD 6.0 million, so the pool sits inside the pre-money valuation. Post-money valuation = 6.0 + 1.5 = USD 7.5 million.
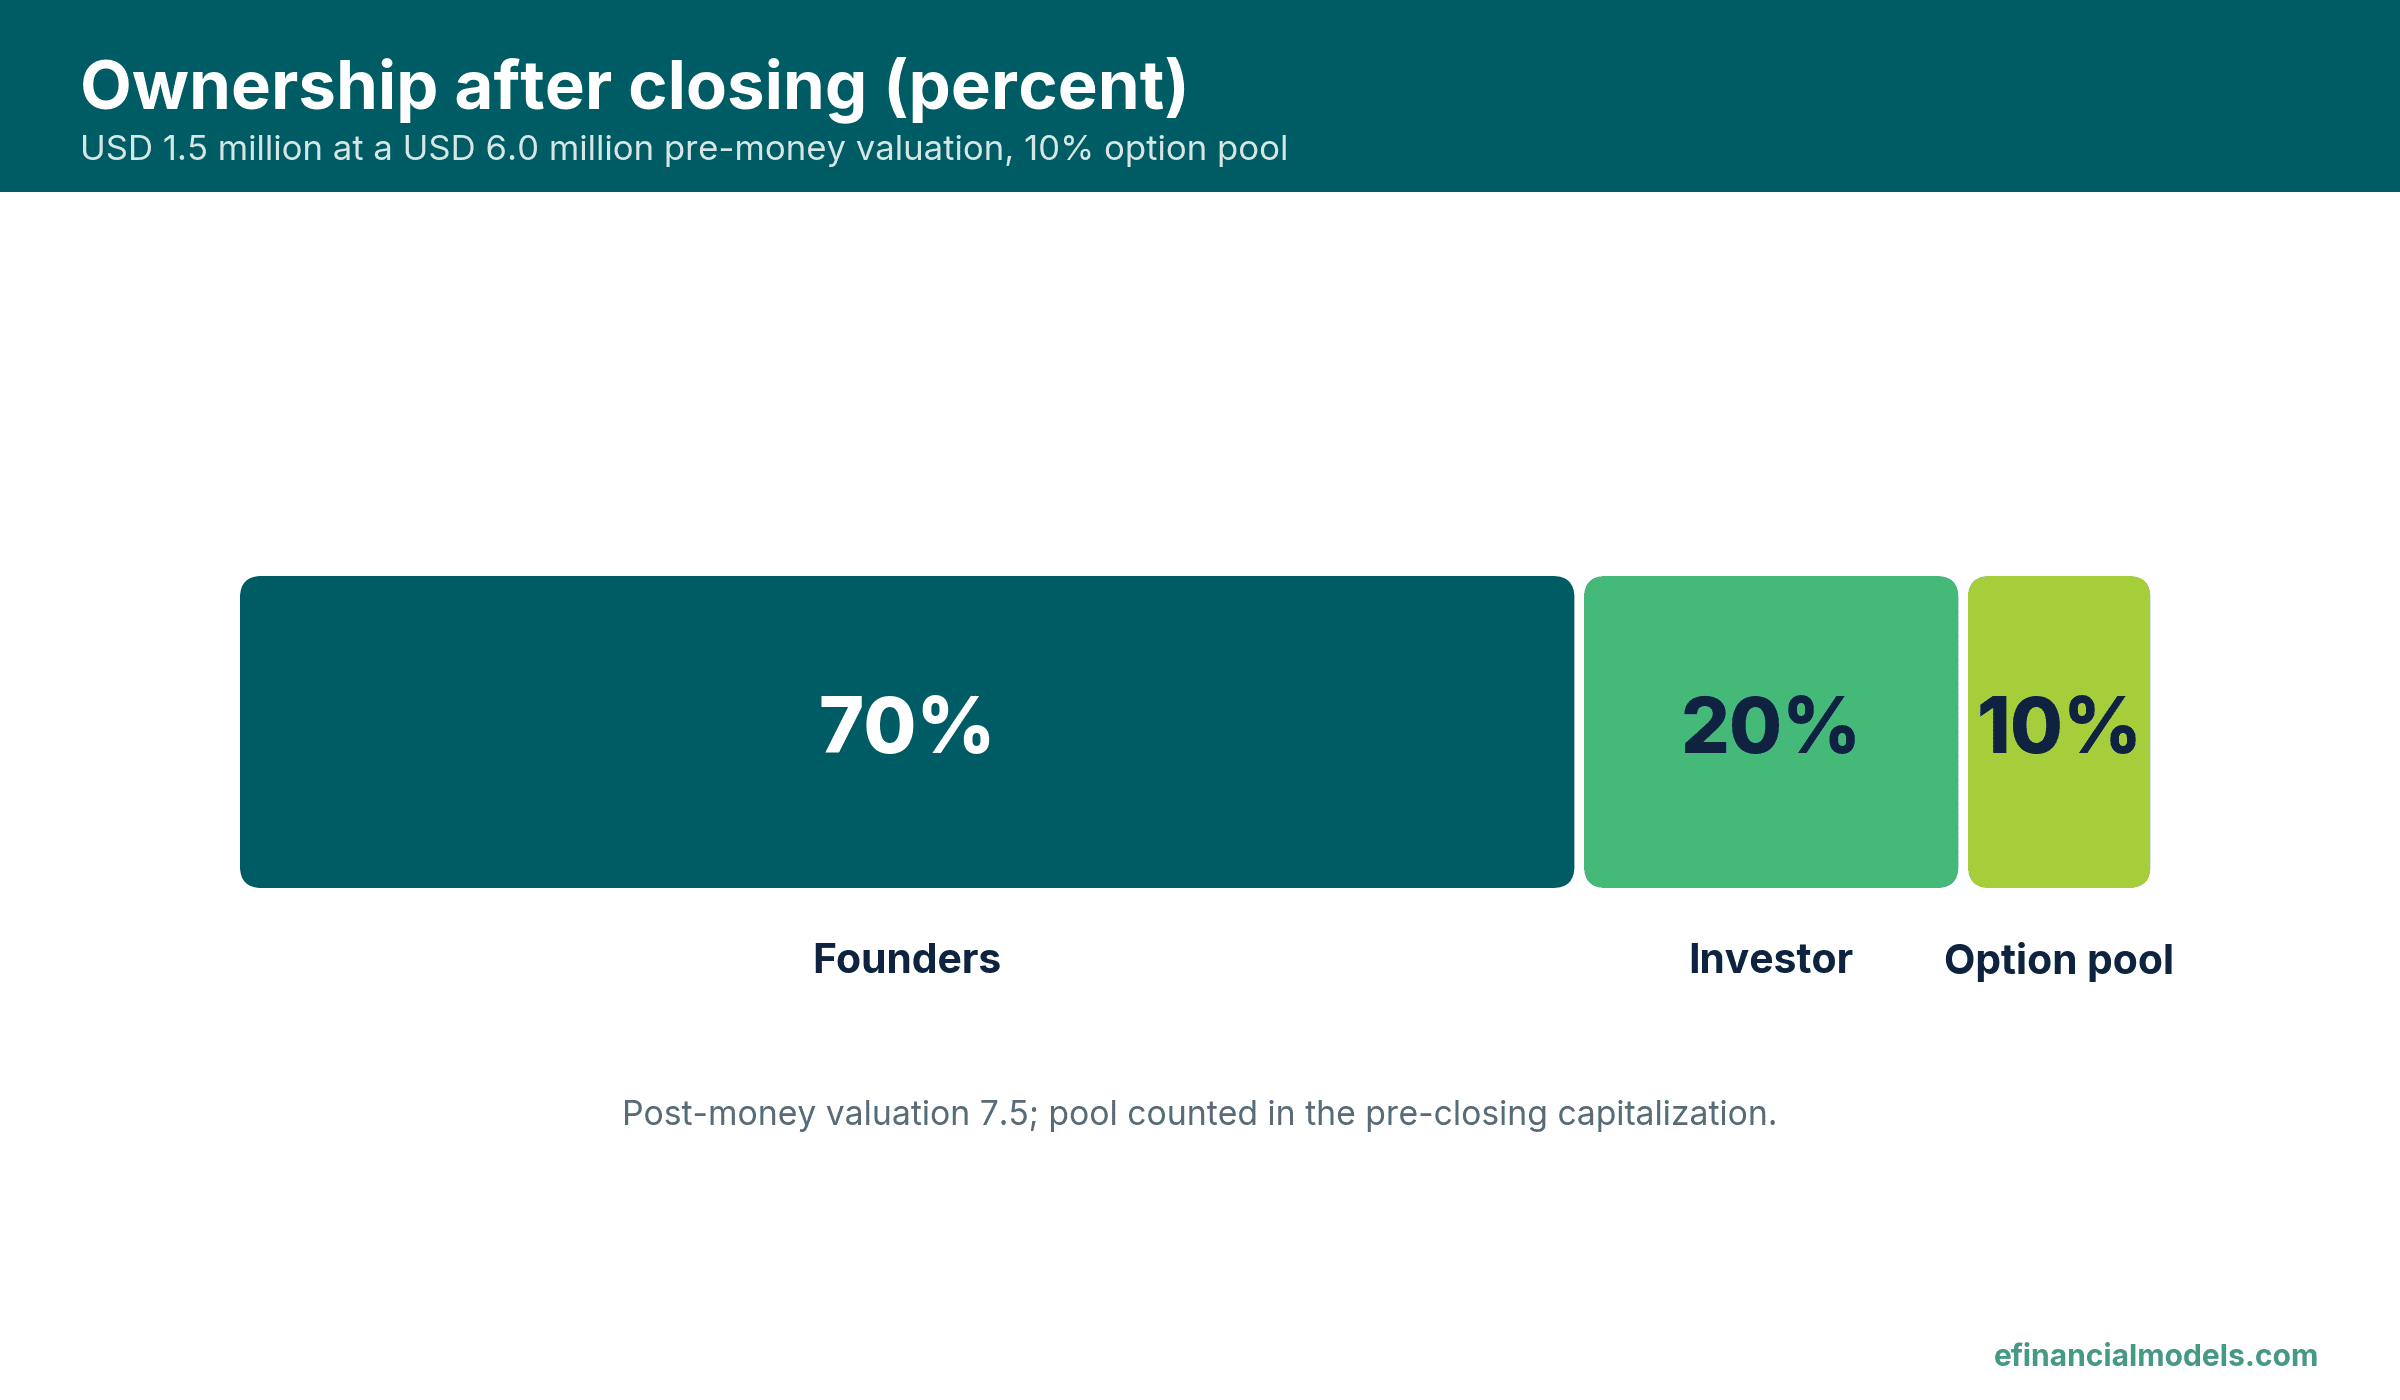
Ownership after the USD 1.5 million seed round, with the 10% option pool counted in the pre-money valuation (illustrative worked example).
The eFinancialModels Simple VC Valuation Template projects investor cash flows and the cash-on-cash multiple, the total cash returned divided by the cash invested. More startup financial models cover the forecasts behind each input.
Check the cap table, 409A value and adviser scope before signing
A first-time founder or in-house CFO faces three questions beyond the arithmetic.
Shared capitalization. Both sides should model the same share count, pool size and every converting SAFE.
Price versus 409A value. In the United States, a 409A valuation, named for Section 409A of the Internal Revenue Code, is an estimate of the fair market value of the company’s common stock by an independent third party (Cooley).
Out of scope. This guide does not cover equity-grant taxation, securities-law compliance or price fairness for minority holders. A tax adviser, a securities lawyer and an independent valuer answer those questions.
Conclusion
A pre-revenue seed valuation is a negotiated number inside a range built from three methods. The Berkus method holds up before a prototype, the Scorecard when a regional median exists, and the venture capital method when an exit and dilution can be defended. Founders and CFOs can test each term sheet in the eFinancialModels Simple Cap Table Template, which models pre-money and post-money valuation and an option pool.
Frequently Asked Questions
Which method should a first-time founder use first?
Start with the venture capital method, because it shows the investor’s side of the table: the return needed and the ownership that follows. Then run the Scorecard against a median for the same region and sector, and use the Berkus checklist to see which milestones lack evidence. A wide gap between results points to the assumption needing the most support before any investor meeting.
Does a higher valuation always help the founder?
No. A higher price lowers dilution today, but it raises the bar for the next round, because later investors still need a return from the higher base. If growth lags, the company may face a flat or down round, tougher terms or a bridge on worse conditions. Founders should weigh price against the terms attached and the milestones the money must fund.
How does a post-money SAFE differ from a pre-money SAFE?
In a post-money SAFE, the cap is measured after all converting SAFEs, so each holder’s stake is fixed at amount divided by cap, and later SAFEs dilute the founders alone. In a pre-money SAFE, the cap leaves out the other converting SAFEs, so every holder and the founders share the dilution of each new SAFE, and final stakes stay uncertain until the priced round.
What should an in-house CFO prepare to support a seed valuation?
Prepare a cap table that lists every share, option and SAFE, a cash plan covering the runway the round buys, the milestones the money funds, and a list of comparable rounds with dates and sources, so every figure can be traced. A one-page bridge from the exit assumption to the asking price lets investors challenge each input instead of the whole number, which keeps the discussion on evidence.