
0 ITEMS

Solar PV Project Financial Model with Real 2025 Hourly Prices and Solar Profiles – 8 European Markets
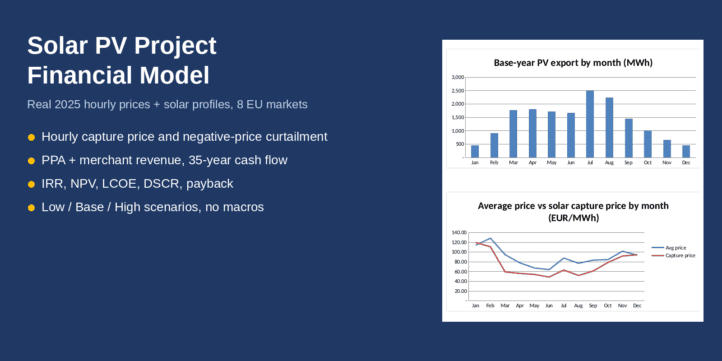
A solar PV project financial model built on real 2025 hourly day-ahead prices and solar generation profiles for eight European markets (DE-LU, NL, BE, FR, AT, PL, CZ, IT-North). It values every hour of output at the real market price to calculate the solar capture price, negative-price hours and curtailment losses, then runs PPA and merchant revenues, debt with DSCR, tax, project and equity IRR, NPV and LCOE.
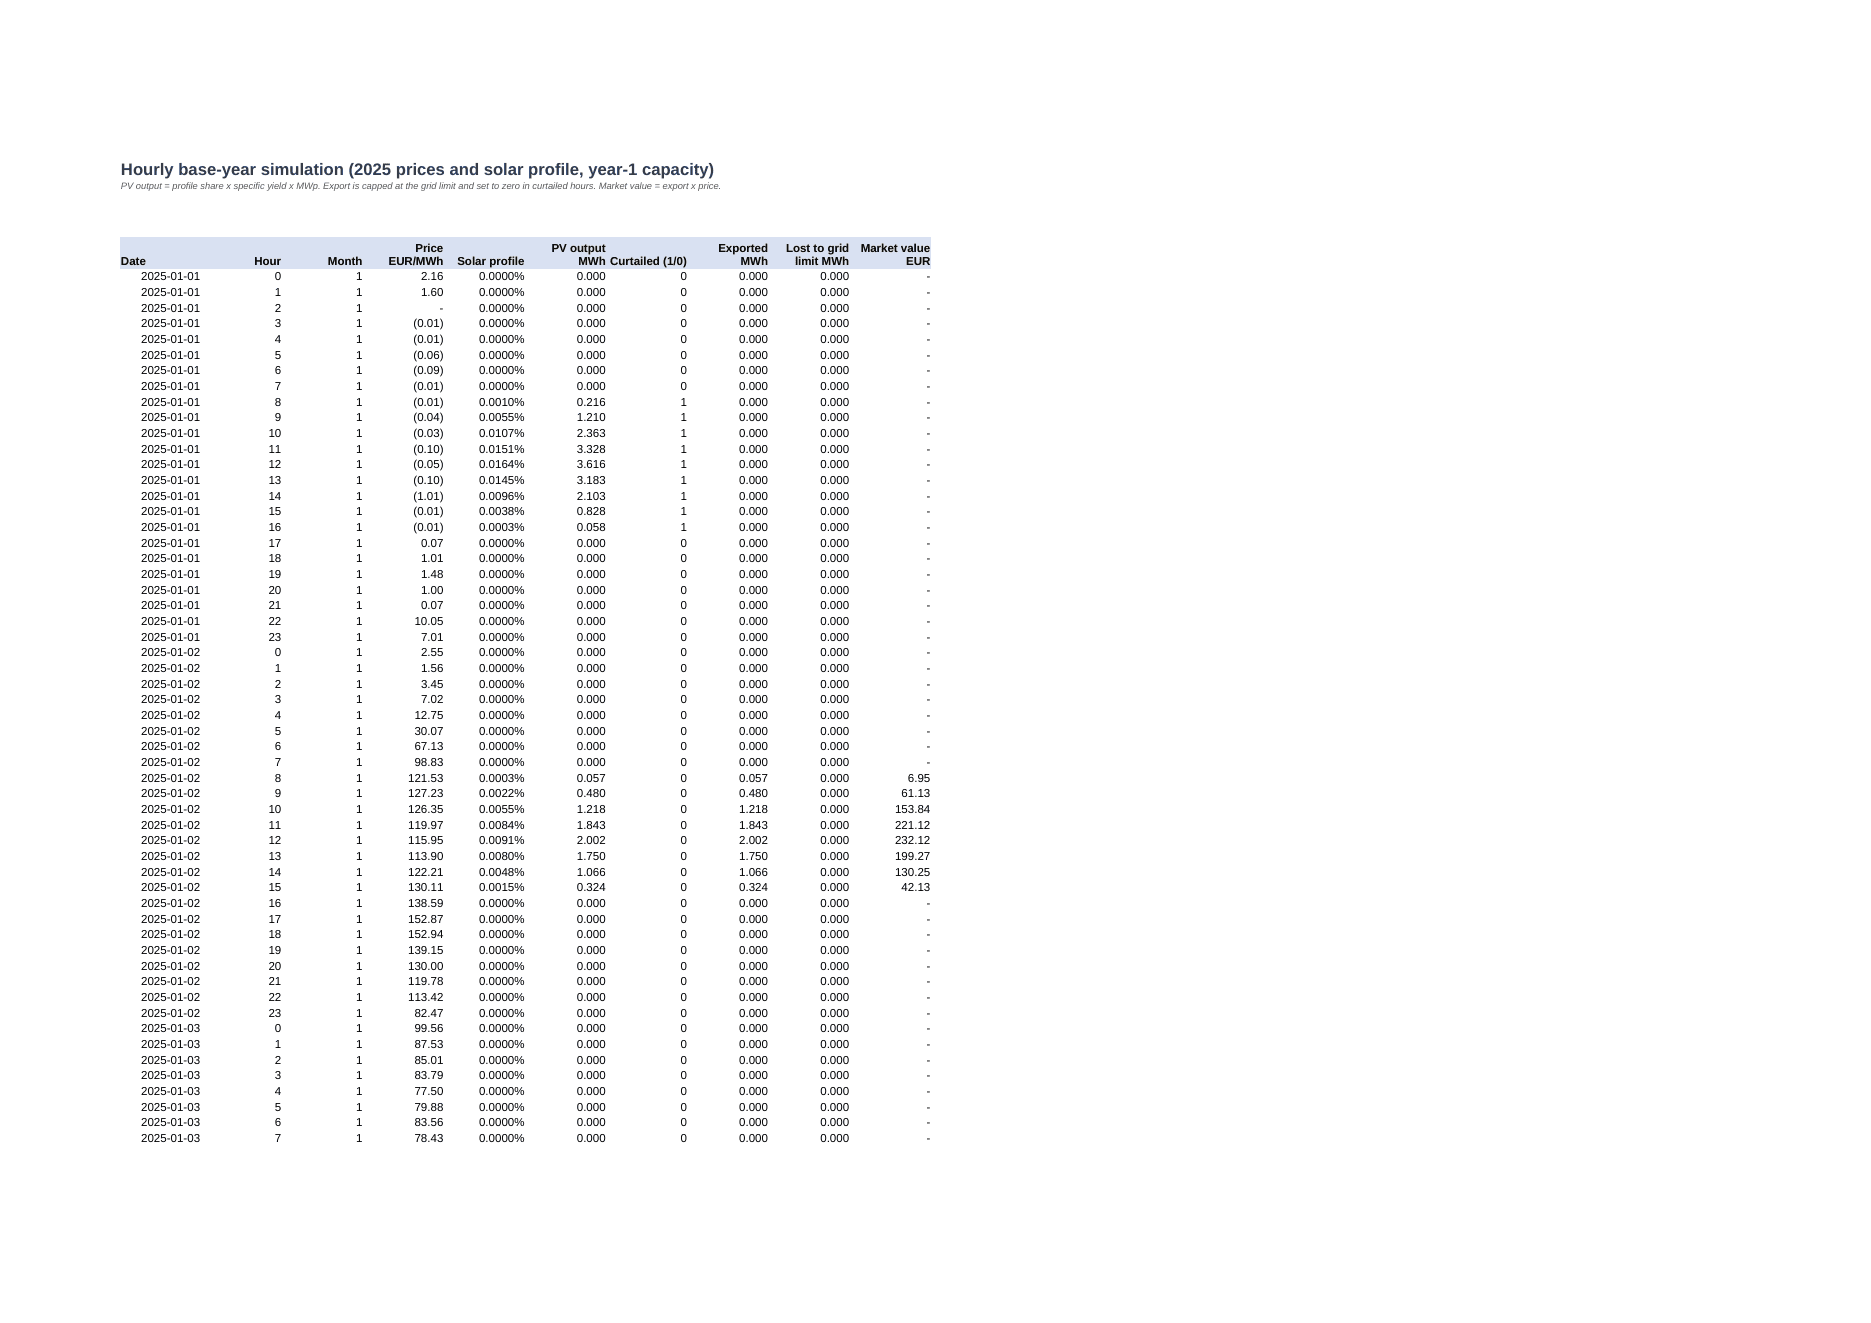
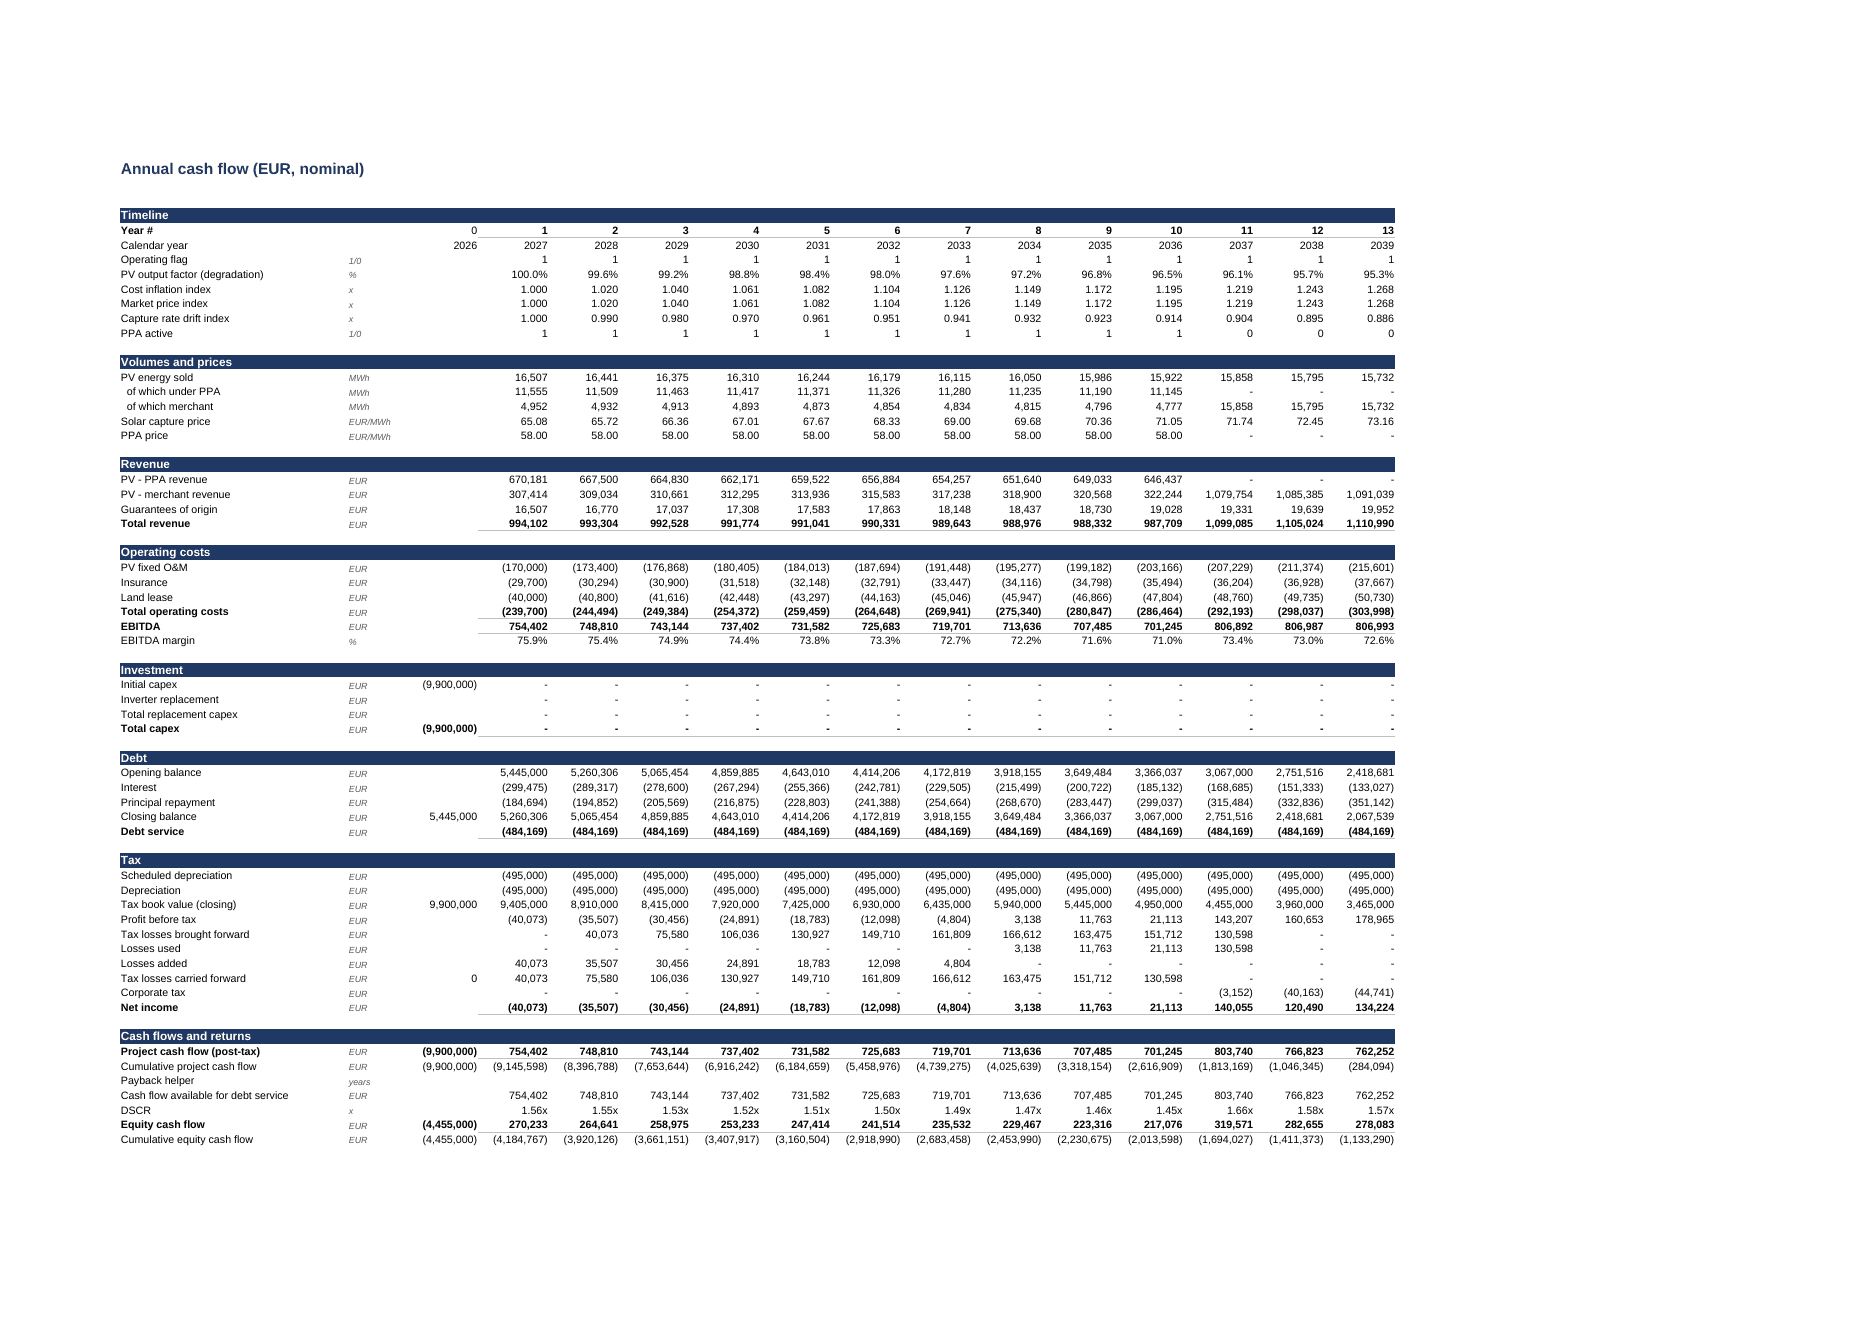
Most solar models ask you to guess the capture price. This one calculates it hour by hour.
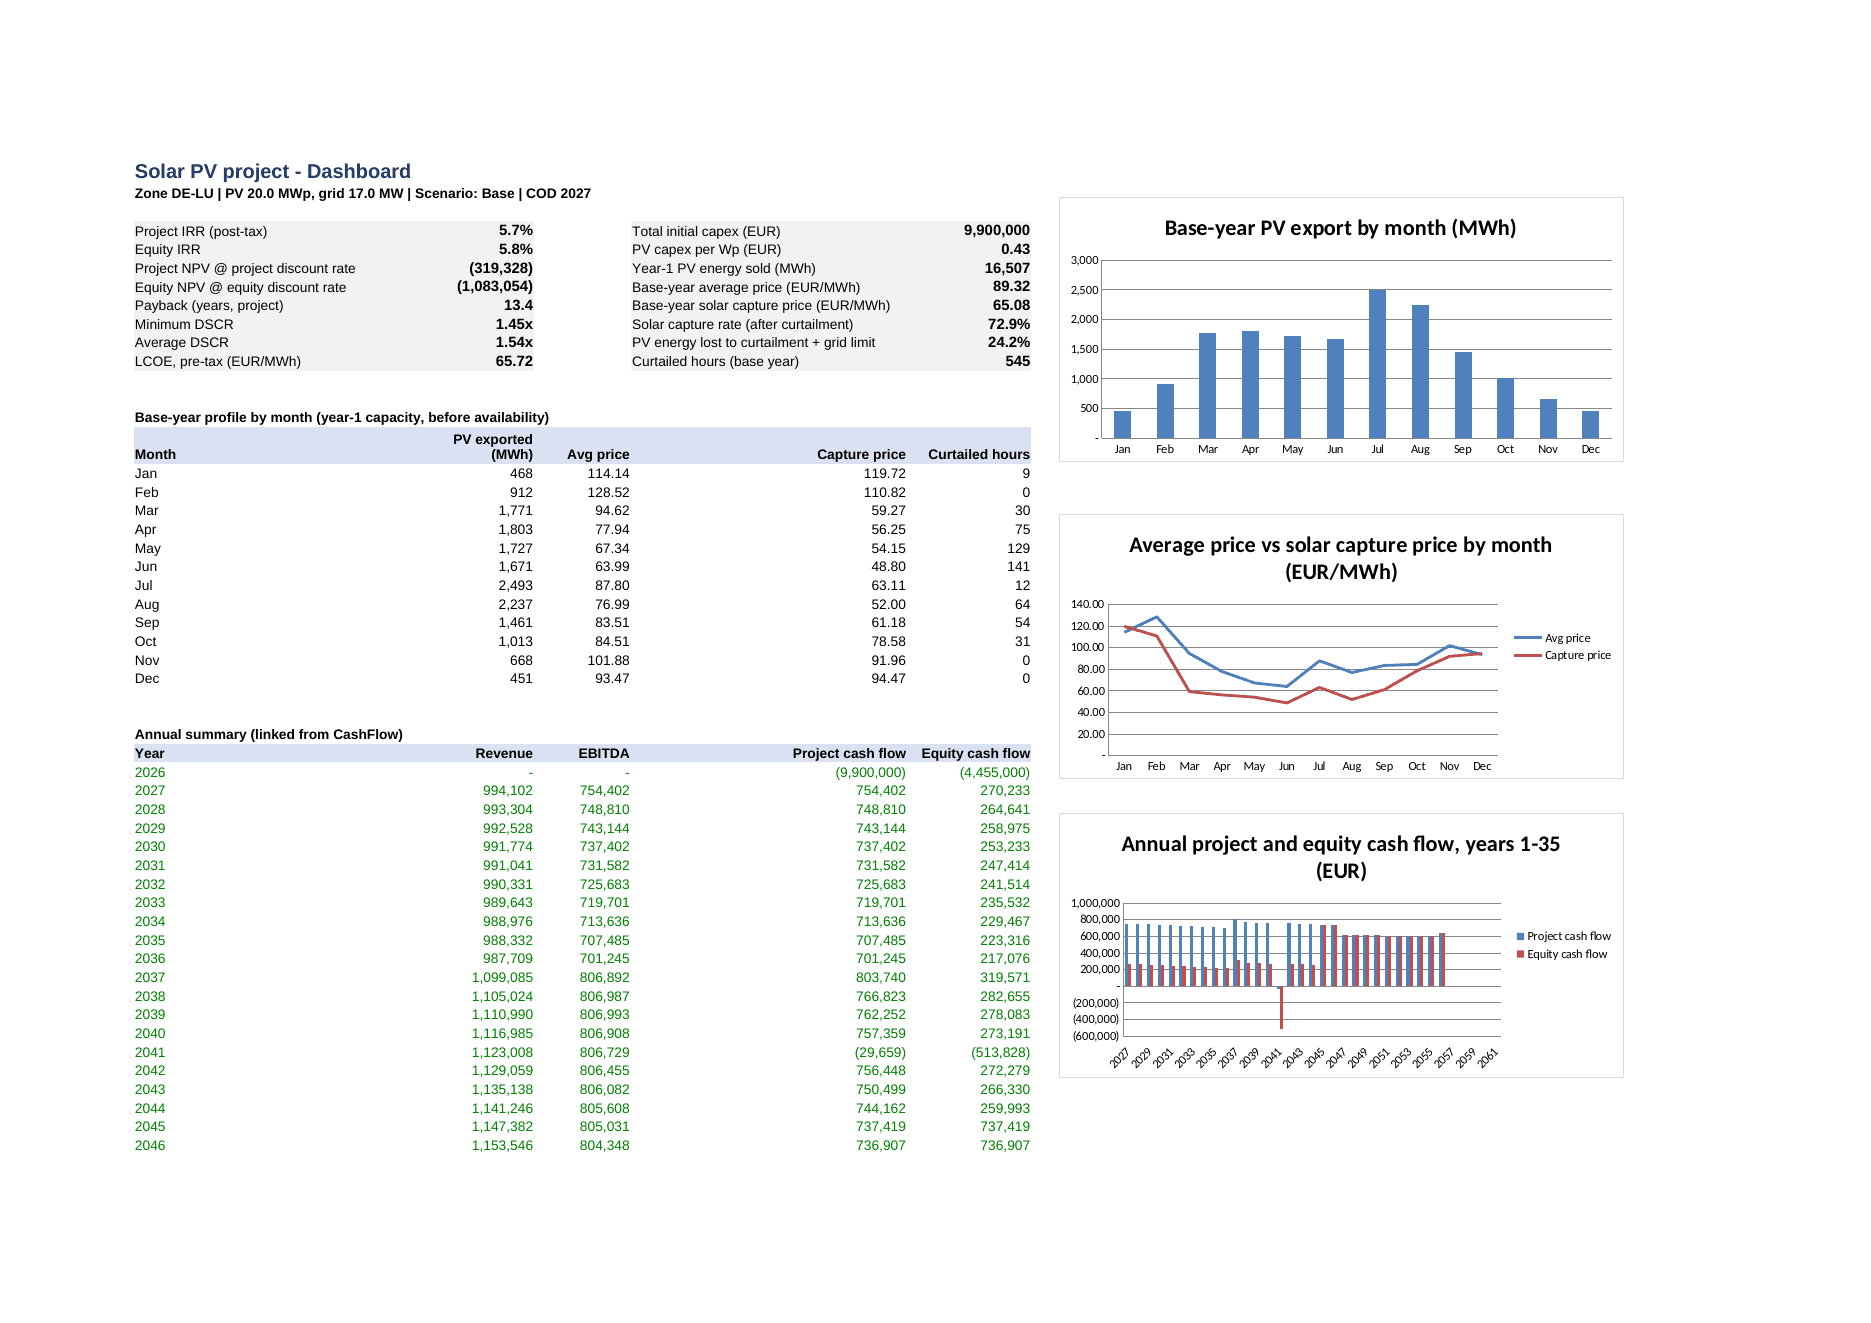
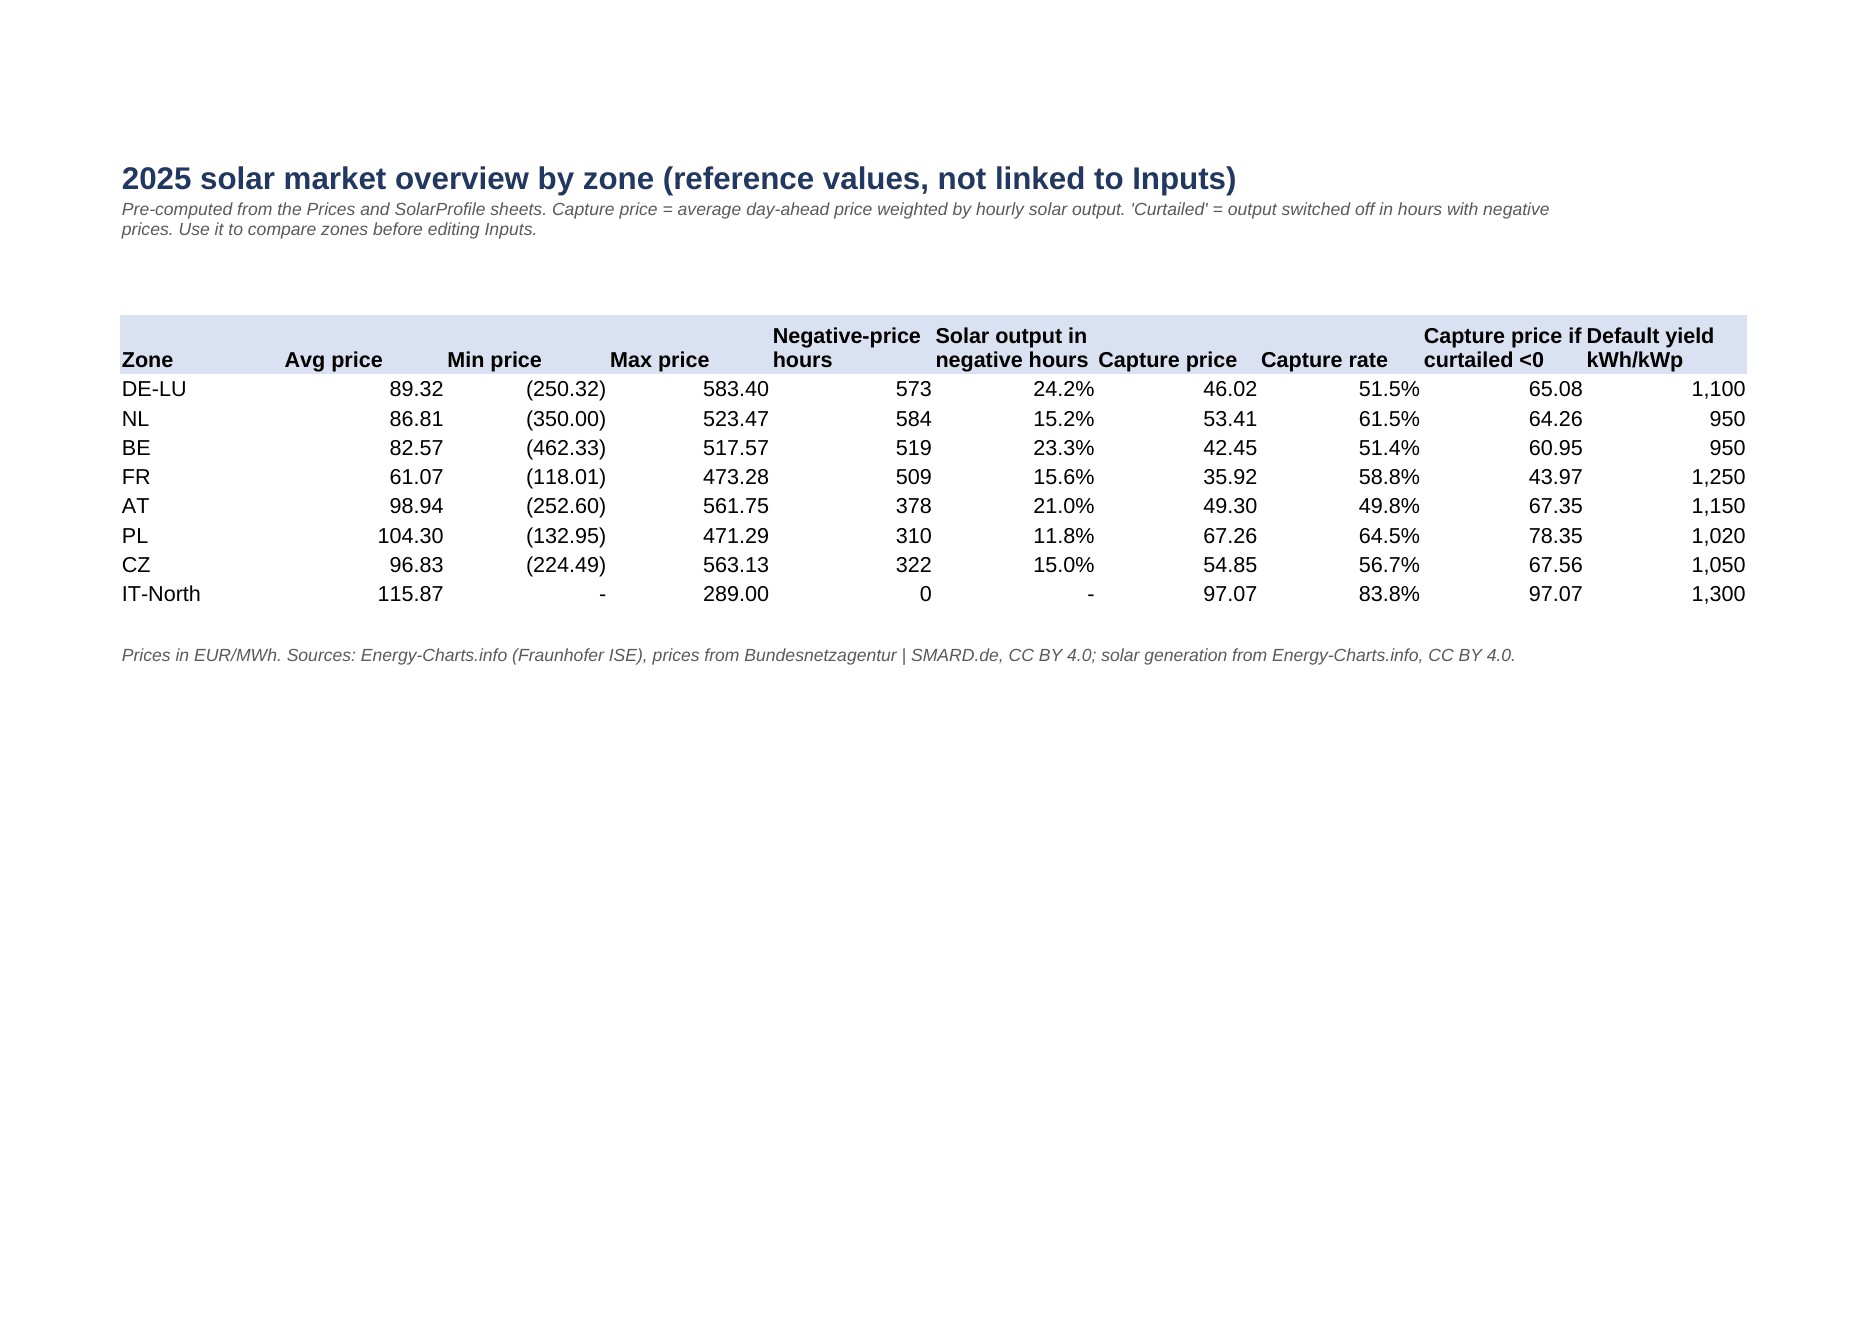
The model includes the full year of 2025 hourly day-ahead prices and the hourly shape of actual solar generation for eight European bidding zones (Germany-Luxembourg, Netherlands, Belgium, France, Austria, Poland, Czech Republic and Northern Italy). Pick a zone, enter the plant size and specific yield, and the model values every one of the 8,760 hours of output at the real market price. You see immediately how much of the average power price a solar plant really earns, how many hours fall below zero, and how much energy is lost when the plant switches off at negative prices. In Germany in 2025, for example, solar earned only about 52% of the average price and almost a quarter of solar output was produced in negative-price hours.
What you get
- 8,760-hour simulation: solar output, grid export limit, curtailment below a price threshold you set, market value per hour
- Solar capture price and capture rate, with and without curtailment
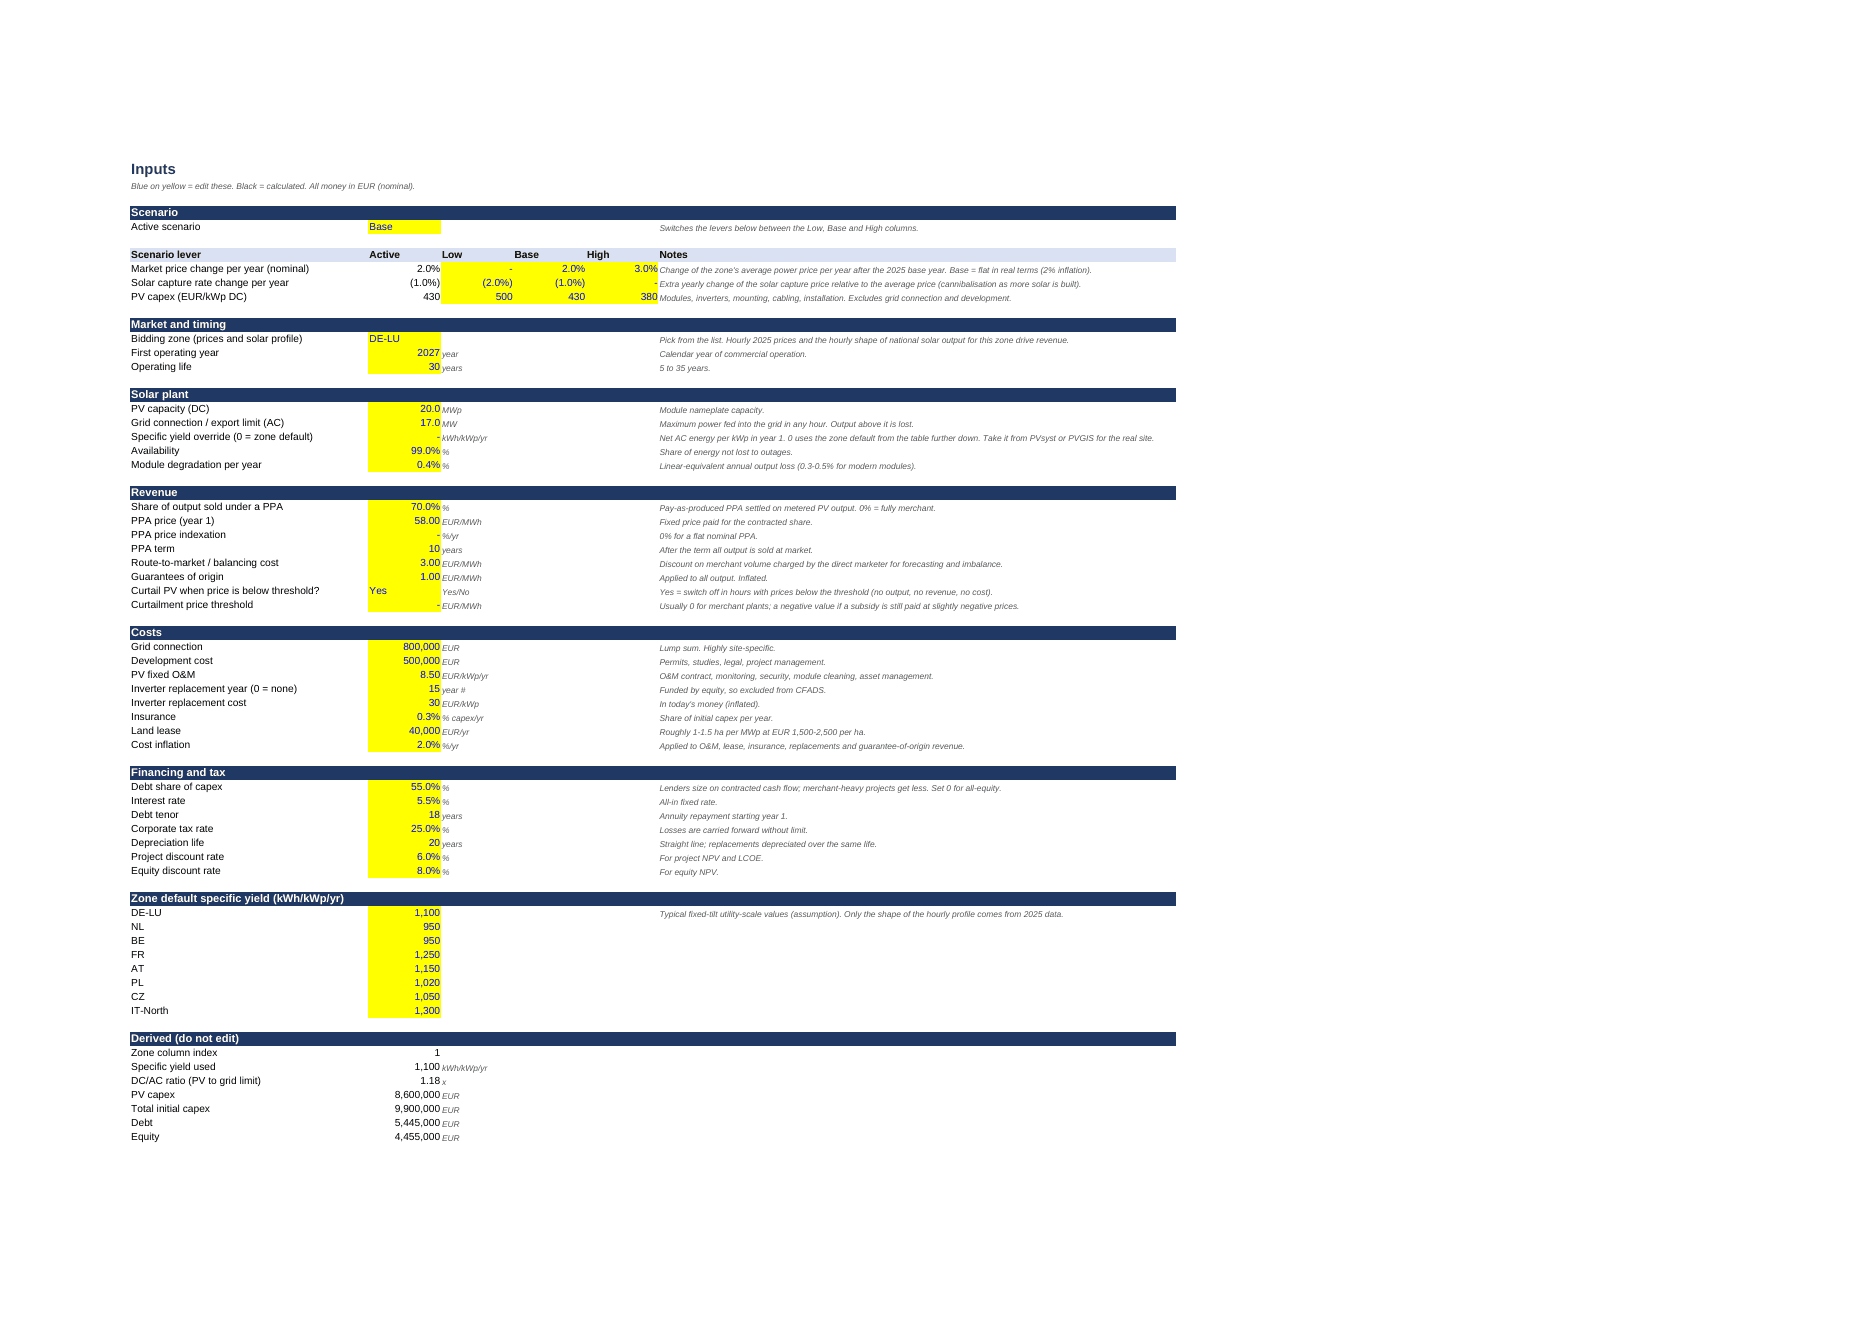
- Pay-as-produced PPA (share, price, indexation, term) plus merchant tail with route-to-market cost and guarantees of origin
- Low / Base / High scenarios (market price trend, capture-rate drift, PV capex)
- Module degradation, availability, inverter replacement
- Capex build-up (PV, grid connection, development), O&M, insurance, land lease, inflation
- Annuity debt with DSCR, corporate tax with loss carry-forward, straight-line depreciation
- Project and equity IRR, NPV, payback, minimum and average DSCR, and LCOE
- Dashboard with KPIs and charts: monthly output, monthly average price vs capture price, 35-year cash flows
- Market comparison of all eight zones: average price, negative hours, solar capture price and capture rate
Who it is for: solar developers screening sites and PPA offers, investors and lenders testing merchant assumptions, consultants, and students learning how negative prices and cannibalisation change solar economics.
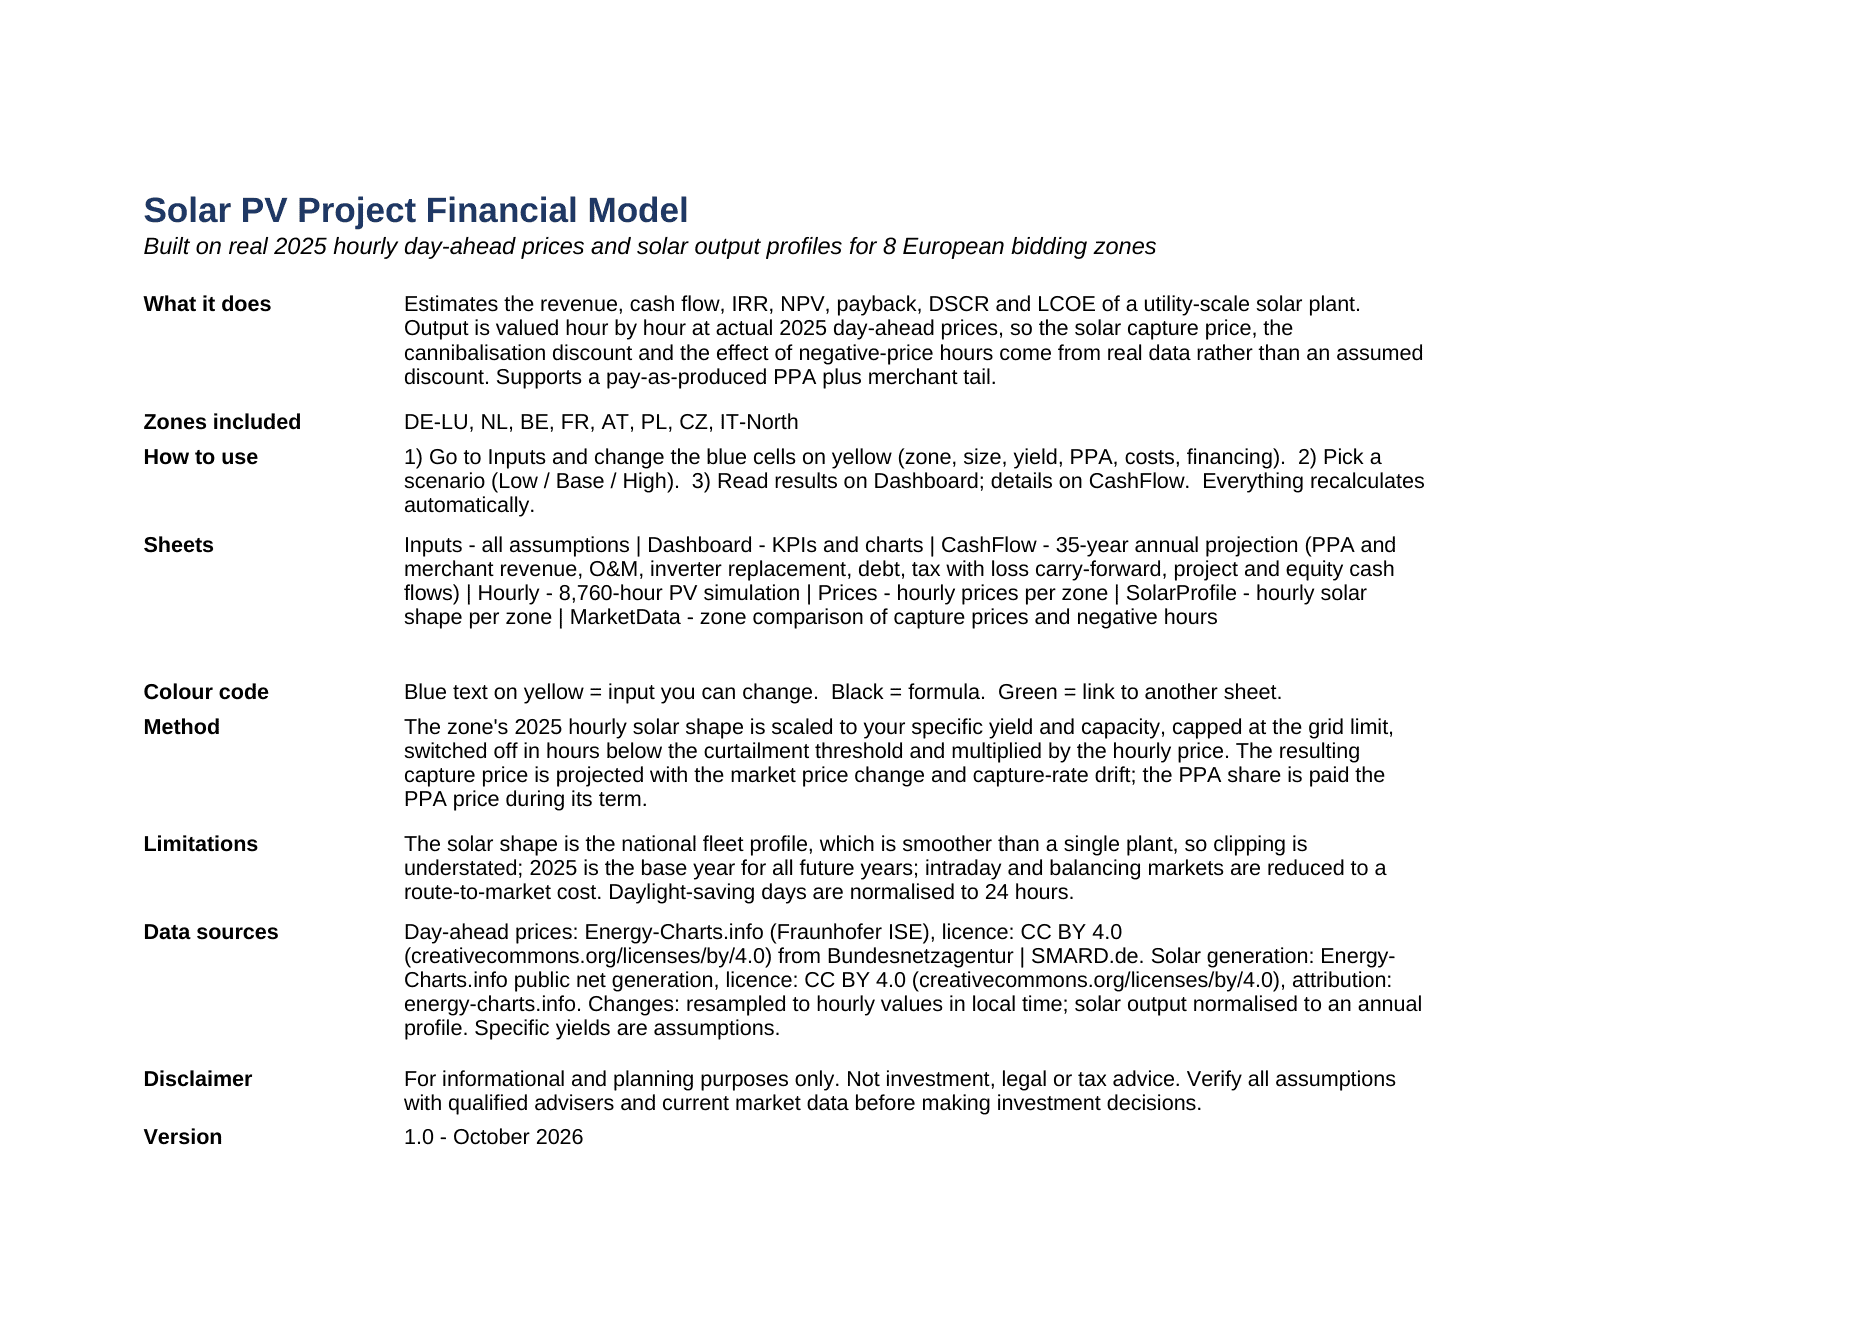
Format: Excel (.xlsx), no macros, fully unlocked formulas, colour-coded inputs (blue on yellow). Works in Microsoft Excel and LibreOffice.
Data sources: Energy-Charts.info (Fraunhofer ISE): day-ahead prices (Bundesnetzagentur | SMARD.de) and public net solar generation, both CC BY 4.0.
Limitations: the hourly solar shape is the national fleet profile, which is smoother than a single plant; 2025 is used as the base year for all future years; intraday and balancing markets are reduced to a route-to-market cost. For planning purposes only, not investment advice.
Similar ProductsOther customers were also interested in...



 eFinancialModels
Electric Vehicle (EV) Charging Station Financial M...
With this comprehensive 5- or 10-year monthly tool, investors can assess the viability of setting up... Read more

Financial Model for Mobile App | Mobile App Busine...
The Mobile App Financial Plan Template in Excel allows you to develop financial projections when lau... Read more

 HenrySheykin
Food Truck Financial Model Excel Template
The Food Truck Financial Model helps entrepreneurs, founders, business owners, consultants, and anal... Read more

Green Hydrogen Production from Wind Energy Financi...
The Green Hydrogen from Wind Financial Model aims to comprehensively forecast a horizon of 40 years ... Read more

Simple Mutual Non-Disclosure Agreement Template
Protect your business secrets with ease using our Simple Mutual Non-Disclosure Agreement Template. S... Read more

Solar Energy Financial Model
The Solar Energy Financial Model Spreadsheet Template in Excel assists you in preparing a sophistica... Read more

 Peter Graf
The Customer-Centric Financial Model for Restauran...
Starting a restaurant without a financial plan is like driving a car blindfolded. You wouldn´t do i... Read more
You must log in to submit a review.