
0 ITEMS

Advanced DCF Business Valuation Model Excel – 10-Year Forecast, WACC, 3 Statements & Sensitivity Analysis
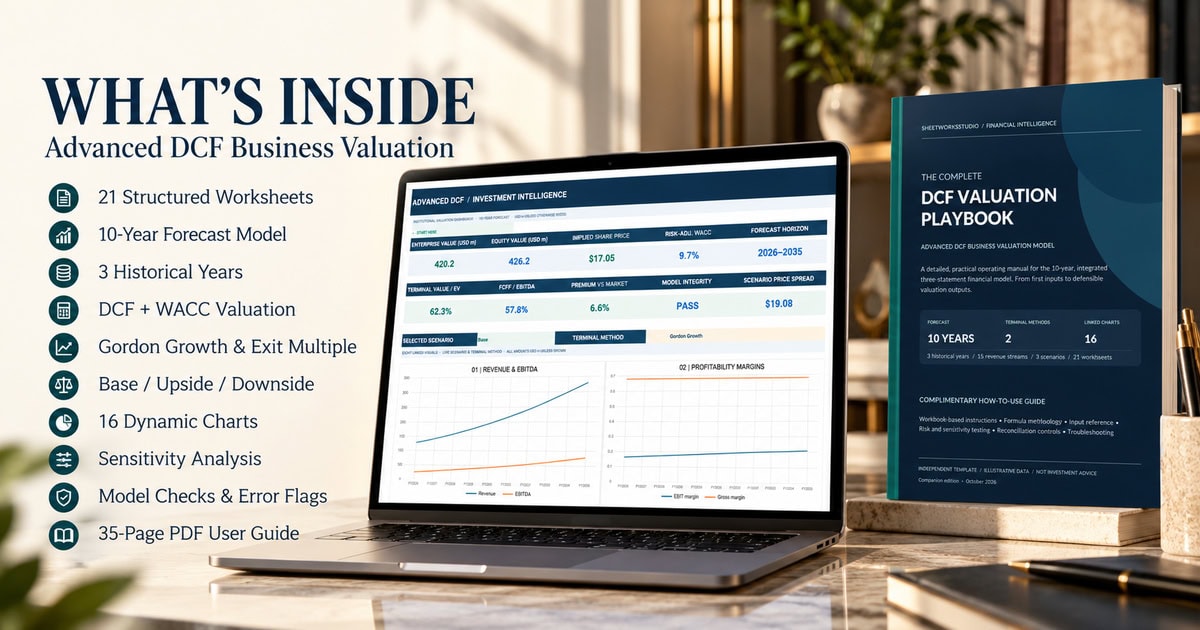
An integrated 10-year Excel DCF valuation model with three years of historical financials, 15 illustrative revenue streams, linked income statement, balance sheet and cash flow, CAPM-based WACC, Gordon Growth and EBITDA Exit Multiple valuation, Base/Upside/Downside scenario analysis, two formula-driven sensitivity matrices, 21 model controls and 16 native charts. Includes a detailed 35-page English PDF guide.
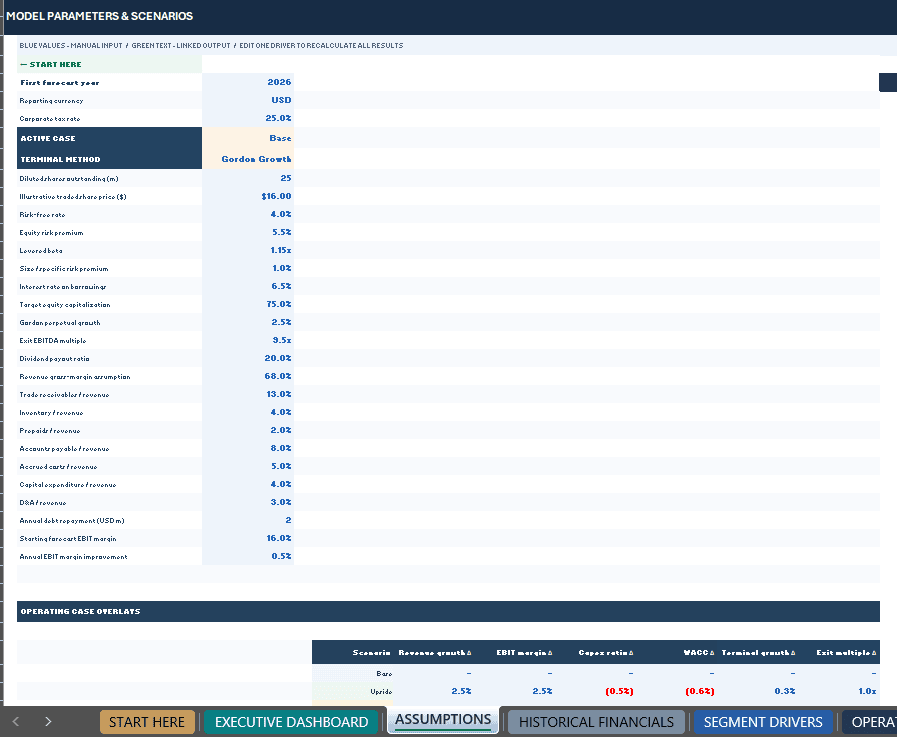
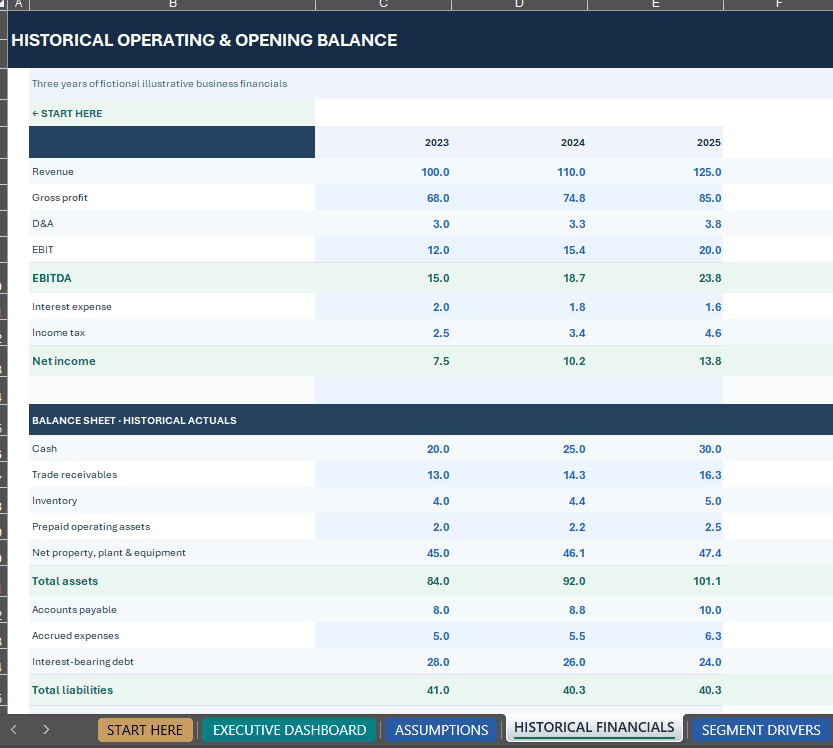
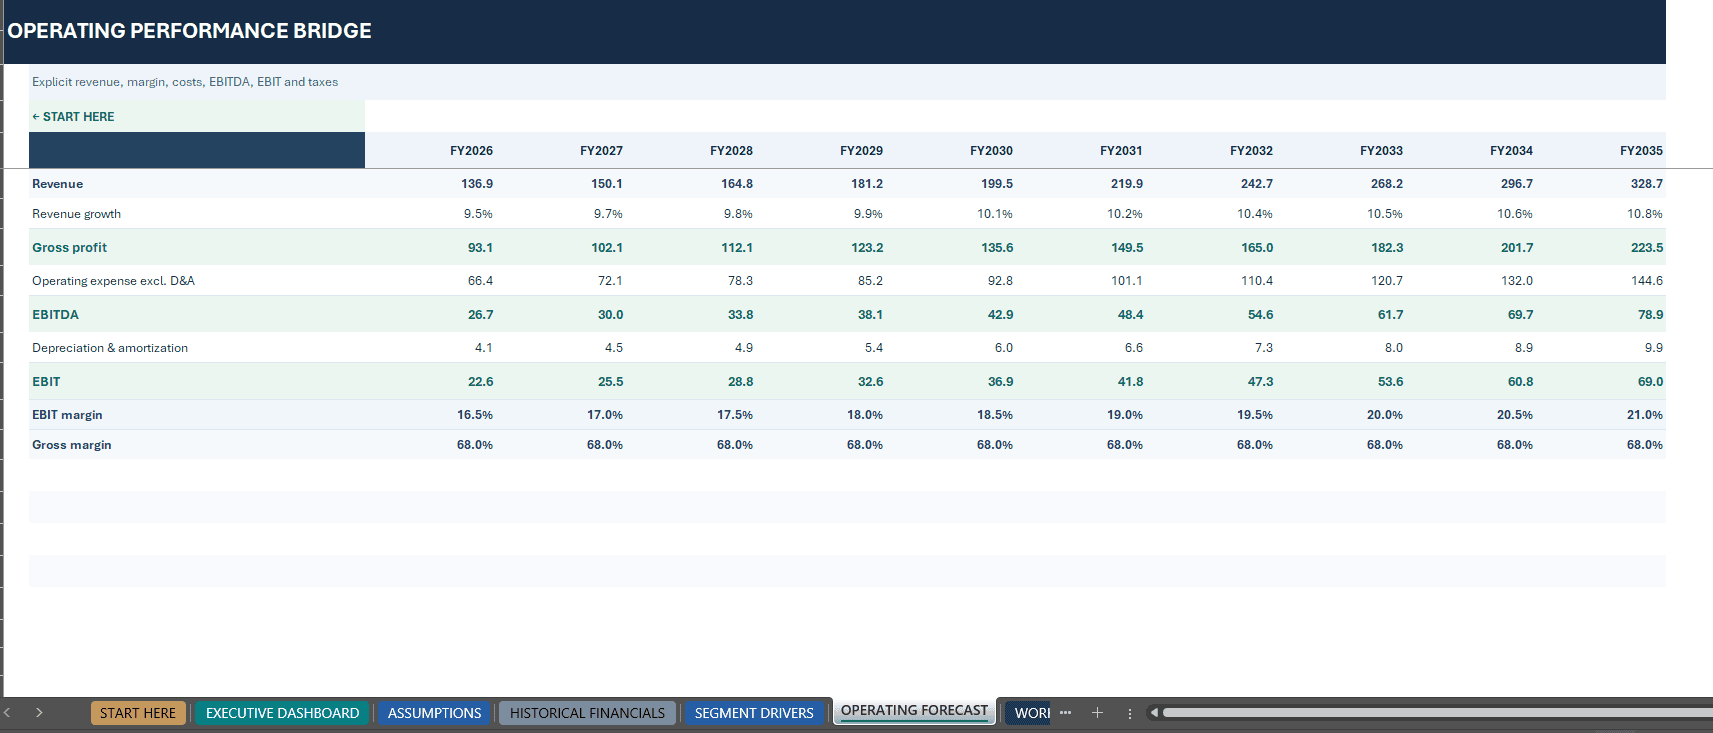
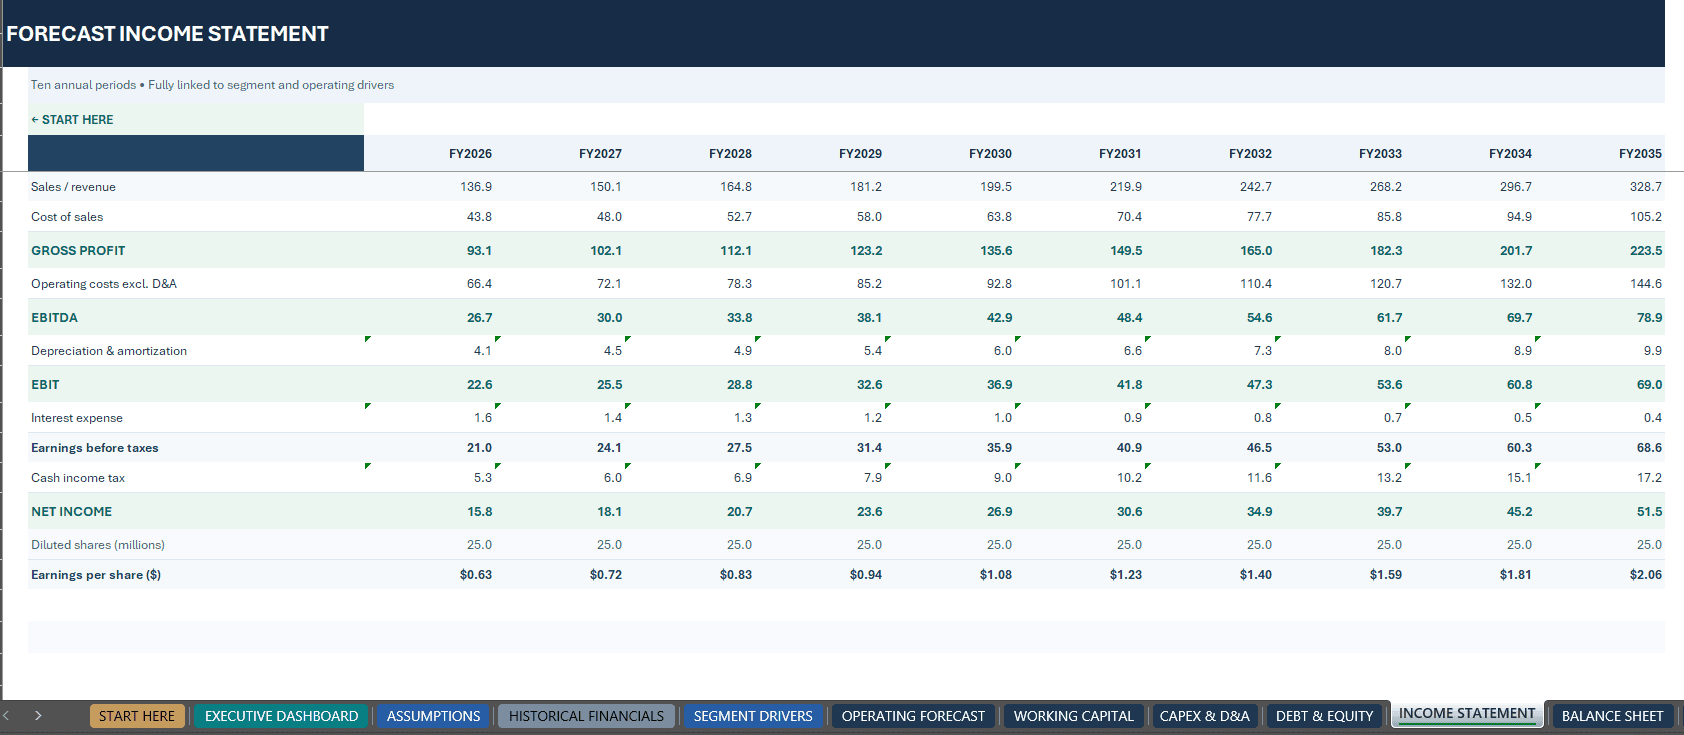

ADVANCED DCF BUSINESS VALUATION MODEL – LUXURY FINAL EDITION
Understand what drives business value — from operating assumptions and forecast cash flows to the cost of capital, terminal value and implied equity value per share.
The Advanced DCF Business Valuation Model by SheetworksStudio is a comprehensive, editable Excel financial modeling solution designed for investment analysts, corporate finance teams, founders, business owners and valuation advisers.
Unlike a standalone DCF calculator, this model integrates three years of historical financial information, 15 illustrative revenue streams, a 10-year operating forecast, three financial statements, CAPM-based WACC, two independent terminal valuation methods and scenario analysis.
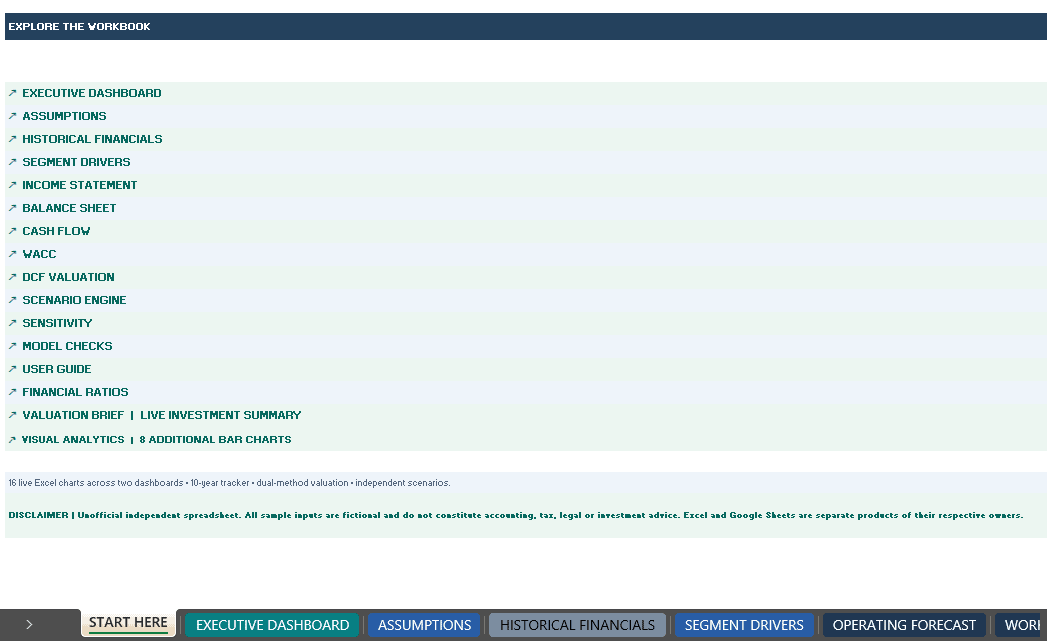
The package includes 21 interconnected Excel worksheets, 16 native financial charts, 21 model integrity controls and a comprehensive 35-page English user guide.
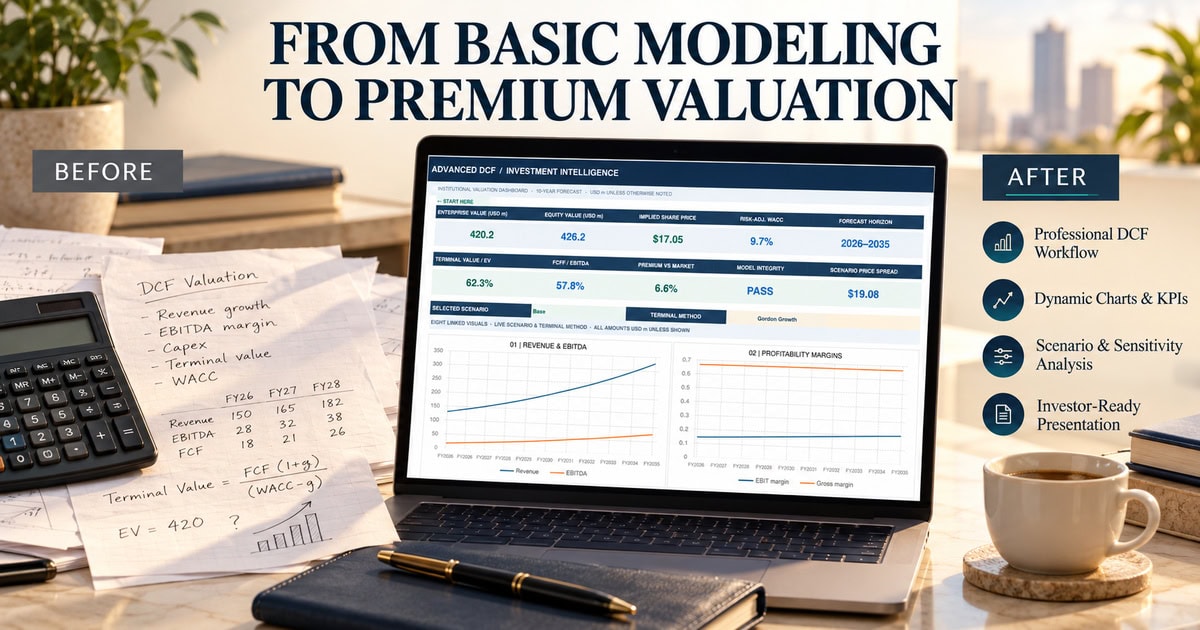
📊 1. EXECUTIVE DASHBOARD & VISUAL ANALYTICS
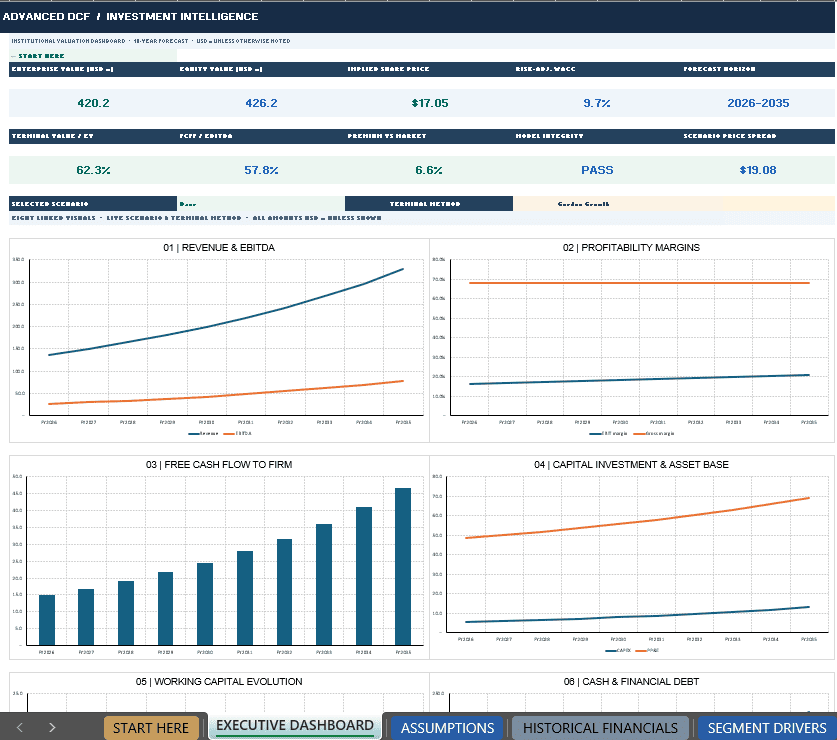
Present critical financial and valuation results through two complementary professional reporting worksheets.
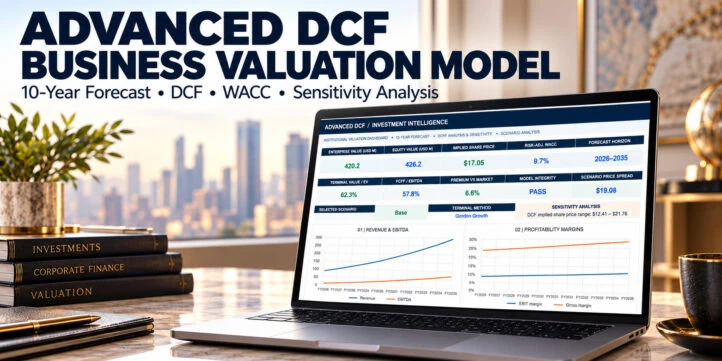
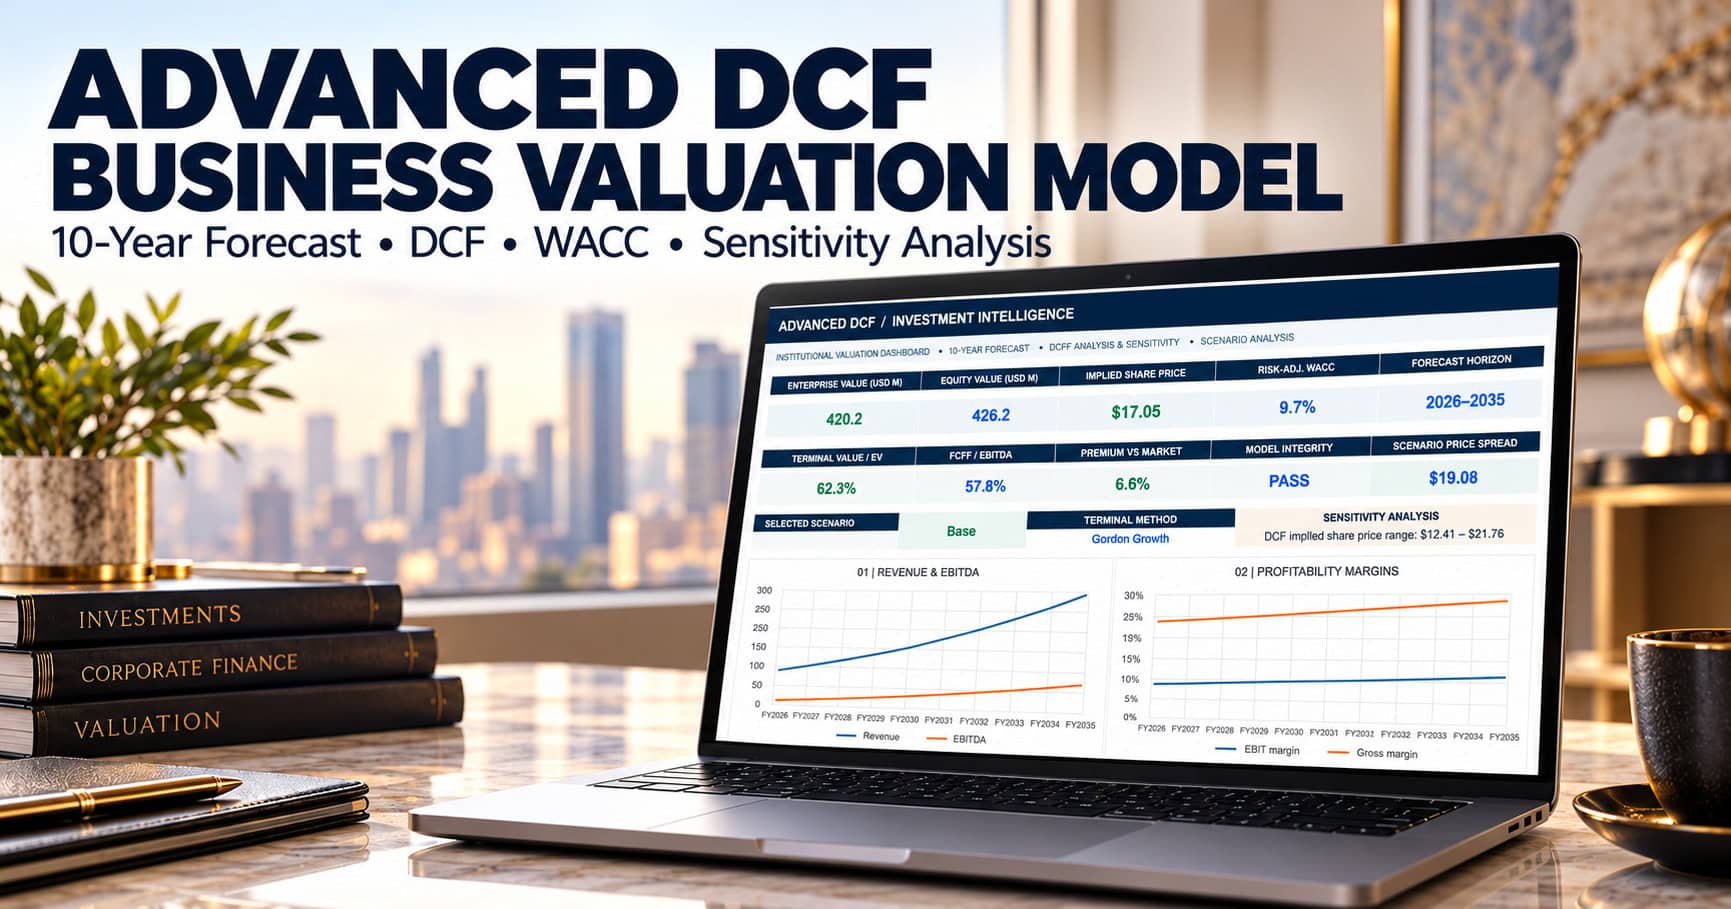
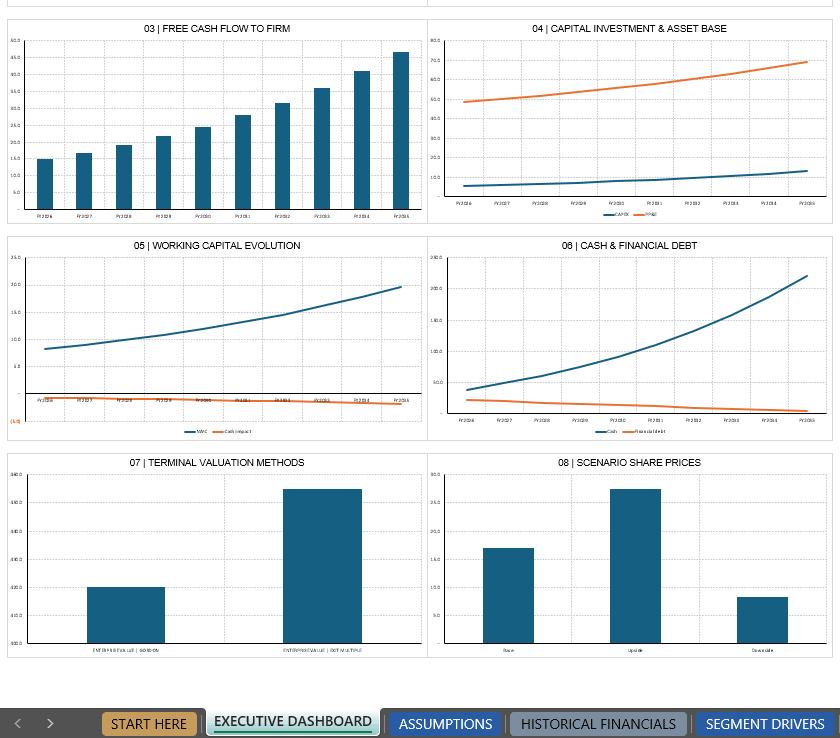
The Executive Dashboard provides eight native, data-linked charts covering:
• Revenue and EBITDA performance
• Operating profitability and margins
• Free Cash Flow to Firm
• Capital expenditure and asset development
• Working capital requirements
• Cash balances and financial debt
• Gordon Growth versus EBITDA Exit Multiple valuation
• Scenario-based share prices
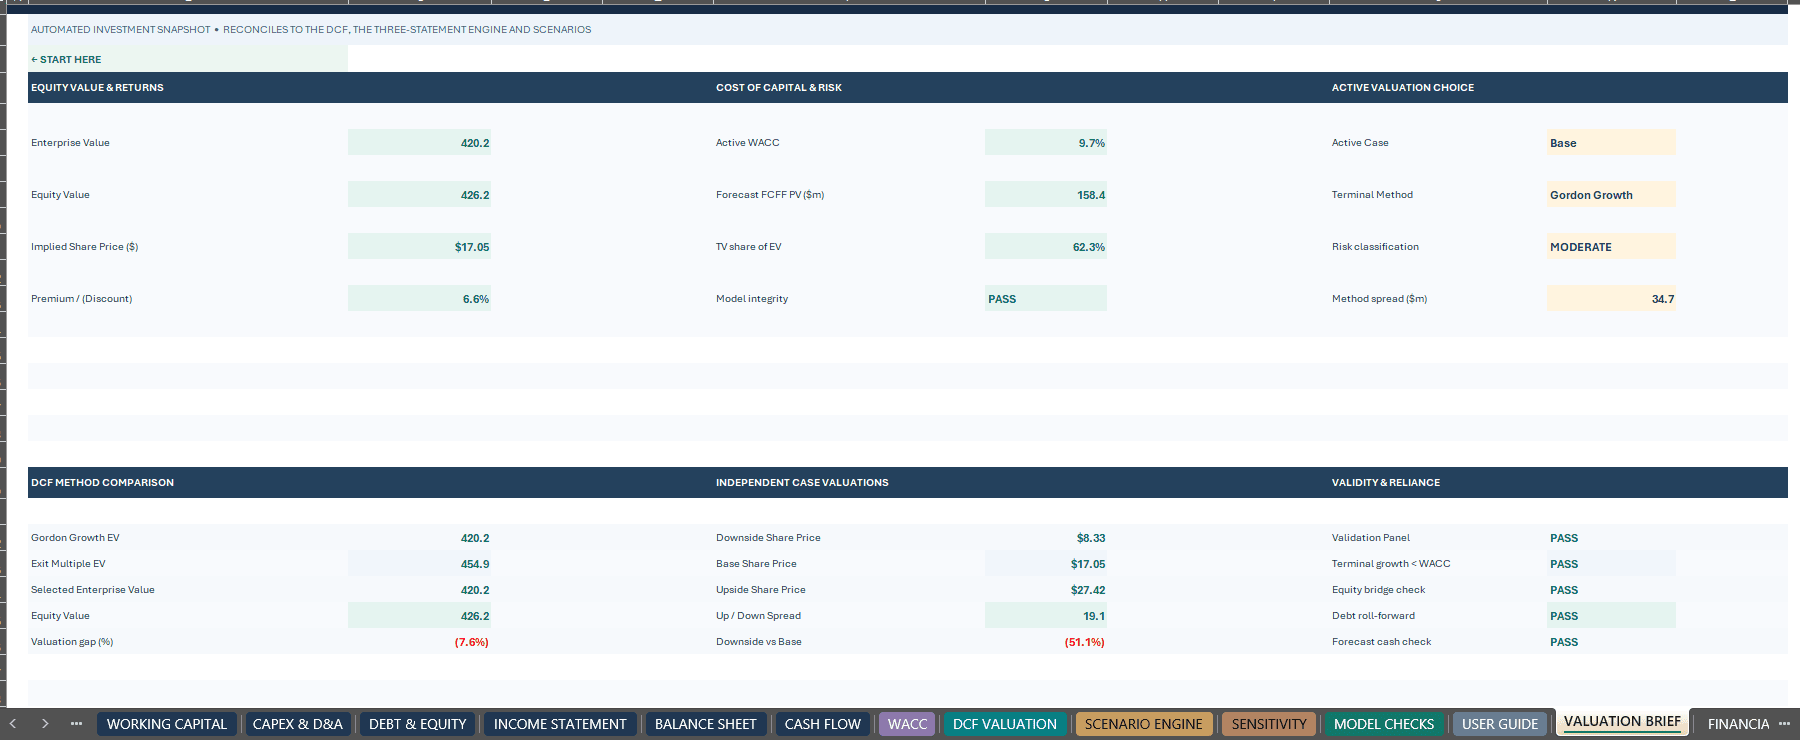
Key metrics include Enterprise Value, Equity Value, implied share price, active WACC, terminal-value contribution, cash-flow conversion and model validation status.
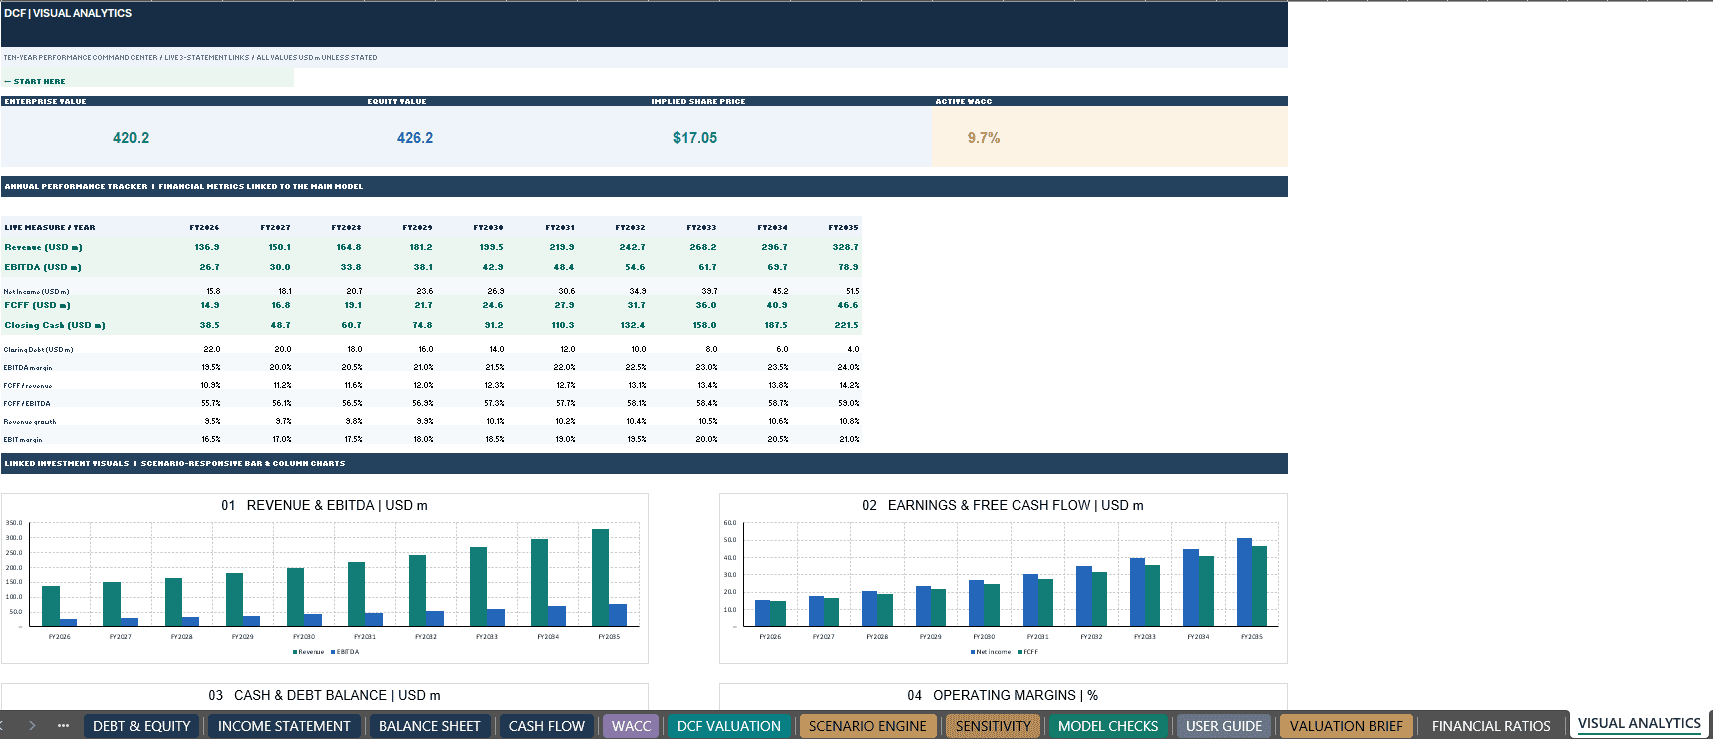
The separate VISUAL ANALYTICS worksheet offers a 10-year performance tracker and eight additional bar and column charts covering earnings, financial performance, cash generation, leverage and valuation comparisons.
A dedicated VALUATION BRIEF provides a consolidated investment-analysis summary.
📈 2. INTEGRATED 10-YEAR THREE-STATEMENT FORECAST
Build a connected operating-company forecast using three years of historical financial information.
The model supports 15 illustrative revenue streams with editable growth and operating assumptions.
Integrated schedules include:
• Segment revenue forecasting
• Gross profit and operating margins
• EBITDA and EBIT projections
• Net working capital requirements
• Capital expenditure
• Depreciation and amortization
• Financial debt and equity
• Interest and corporate income taxes
• Income Statement
• Balance Sheet
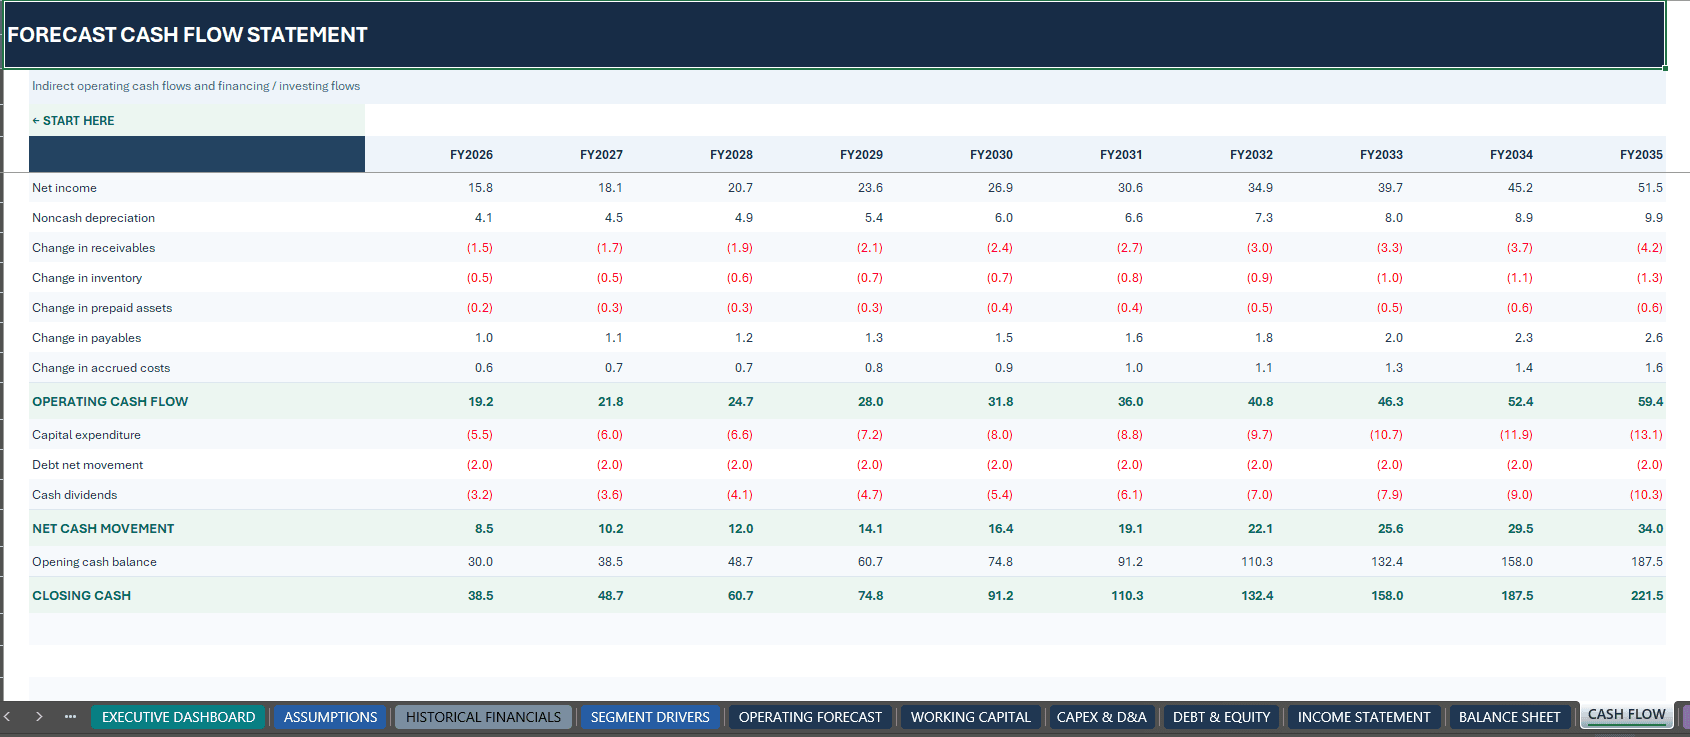
• Cash Flow Statement
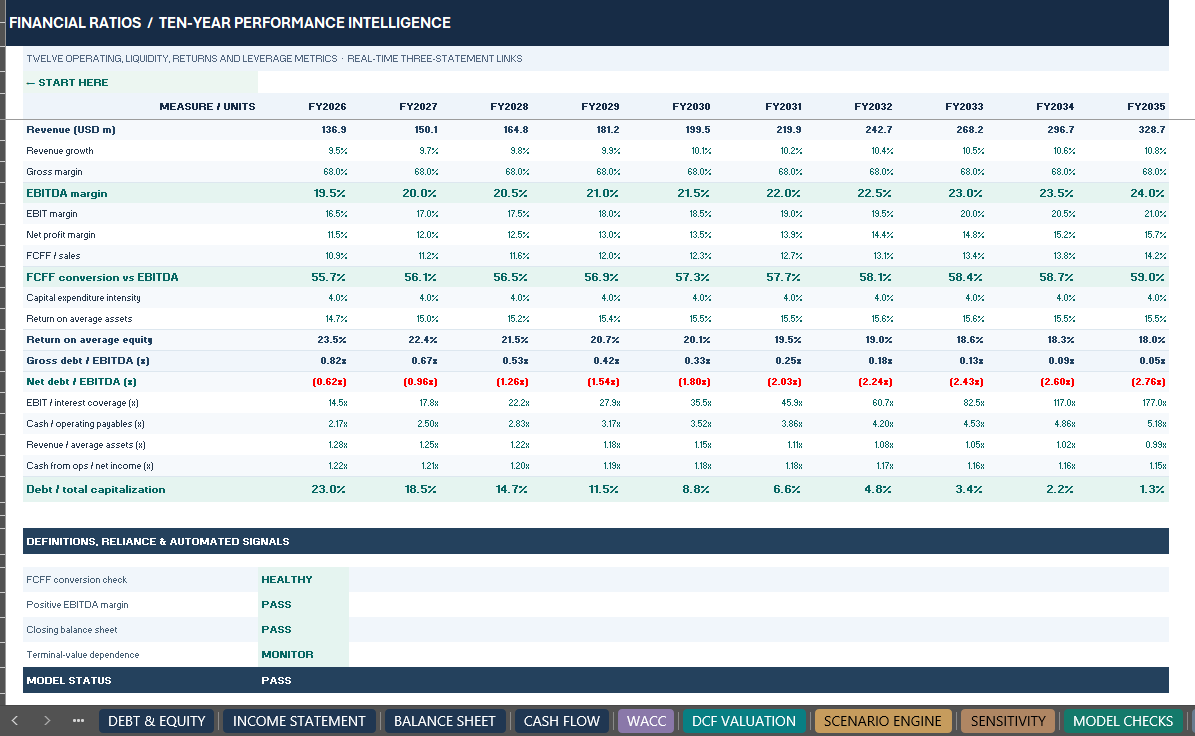
• Financial Ratios
All ten annual forecast periods are connected through the financial calculation structure.
The first forecast year is editable. The fictional example currently covers 2026–2035 and uses USD millions except for per-share figures, percentages and other specifically labeled metrics.
⚖️ 3. TRANSPARENT DISCOUNTED CASH FLOW VALUATION
Follow the complete calculation from operating profitability to discounted free cash flow and intrinsic equity value.
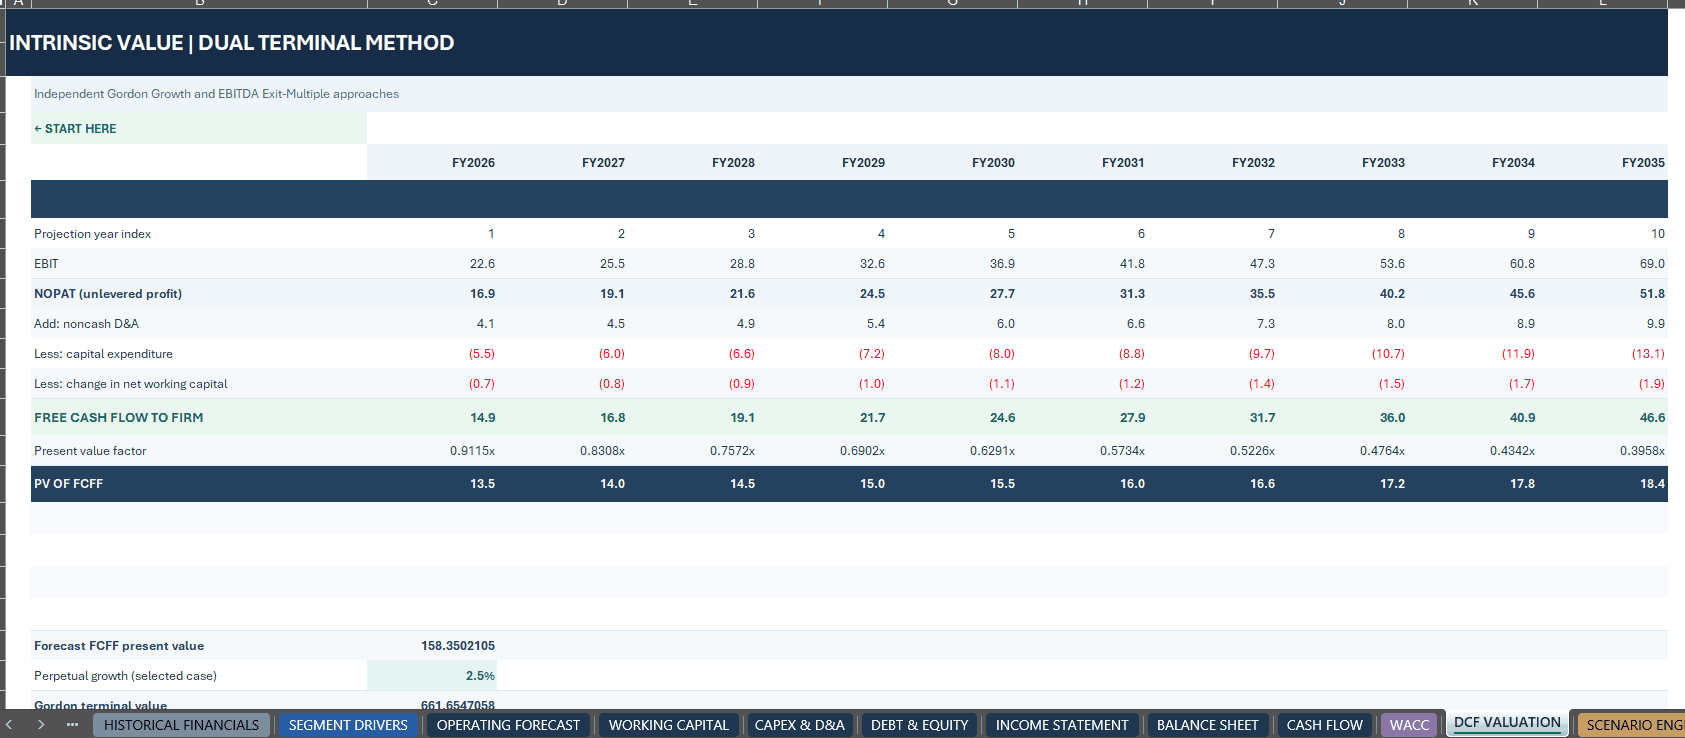
The DCF framework includes:
• Earnings Before Interest and Taxes
• Net Operating Profit After Tax
• Depreciation and Amortization
• Capital Expenditure
• Changes in Net Working Capital
• Free Cash Flow to Firm
• Annual Discount Factors
• Present Value of Forecast Cash Flows
• Terminal Value
• Enterprise Value
• Valuation-Date Cash and Debt Adjustments
• Equity Value
• Implied Value per Diluted Share
The model uses end-of-year discounting with the valuation date immediately before the first forecast year.
TWO INDEPENDENT TERMINAL VALUE METHODS
Gordon Growth Method
Estimate terminal value using normalized terminal-year free cash flow, perpetual growth and the selected discount rate.
EBITDA Exit Multiple Method
Estimate terminal value using terminal-year EBITDA and an editable valuation multiple.
Both valuation methods are calculated independently and displayed for comparison.
The selected terminal method determines the principal valuation outputs. The workbook does not average the two approaches.
💼 4. CAPM & WEIGHTED AVERAGE COST OF CAPITAL
Build the discount rate from transparent, editable assumptions.
The dedicated WACC worksheet includes:
• Risk-Free Rate
• Equity Risk Premium
• Levered Equity Beta
• Size and Company-Specific Risk Premium
• Cost of Equity
• Pre-Tax Cost of Debt
• Corporate Tax Rate
• After-Tax Cost of Debt
• Target Equity Weight
• Target Debt Weight
• Scenario-Related WACC Adjustments
The discount rate connects directly to forecast cash-flow discounting and terminal-value calculations.
Users can review how individual cost-of-capital assumptions influence the estimated valuation.
🔀 5. THREE INDEPENDENT VALUATION SCENARIOS
Evaluate alternative operating and financial assumptions through three independently calculated scenarios.
BASE
Central operating, capital investment and valuation assumptions.
UPSIDE
More favorable revenue growth, operating profitability or valuation conditions.
DOWNSIDE
Less favorable commercial performance, cash generation or valuation assumptions.
Scenario adjustments can cover:
• Revenue Growth
• EBIT Margins
• Capital Expenditure Intensity
• Weighted Average Cost of Capital
• Perpetual Growth
• Exit EBITDA Multiple
The SCENARIO ENGINE recalculates forecast operations, free cash flow and valuation for each case.
Compare enterprise value, equity value and implied share price without maintaining separate valuation workbooks.
🔎 6. DYNAMIC VALUATION SENSITIVITY ANALYSIS
Explore how changing discount rates and terminal-value assumptions influences estimated share value.
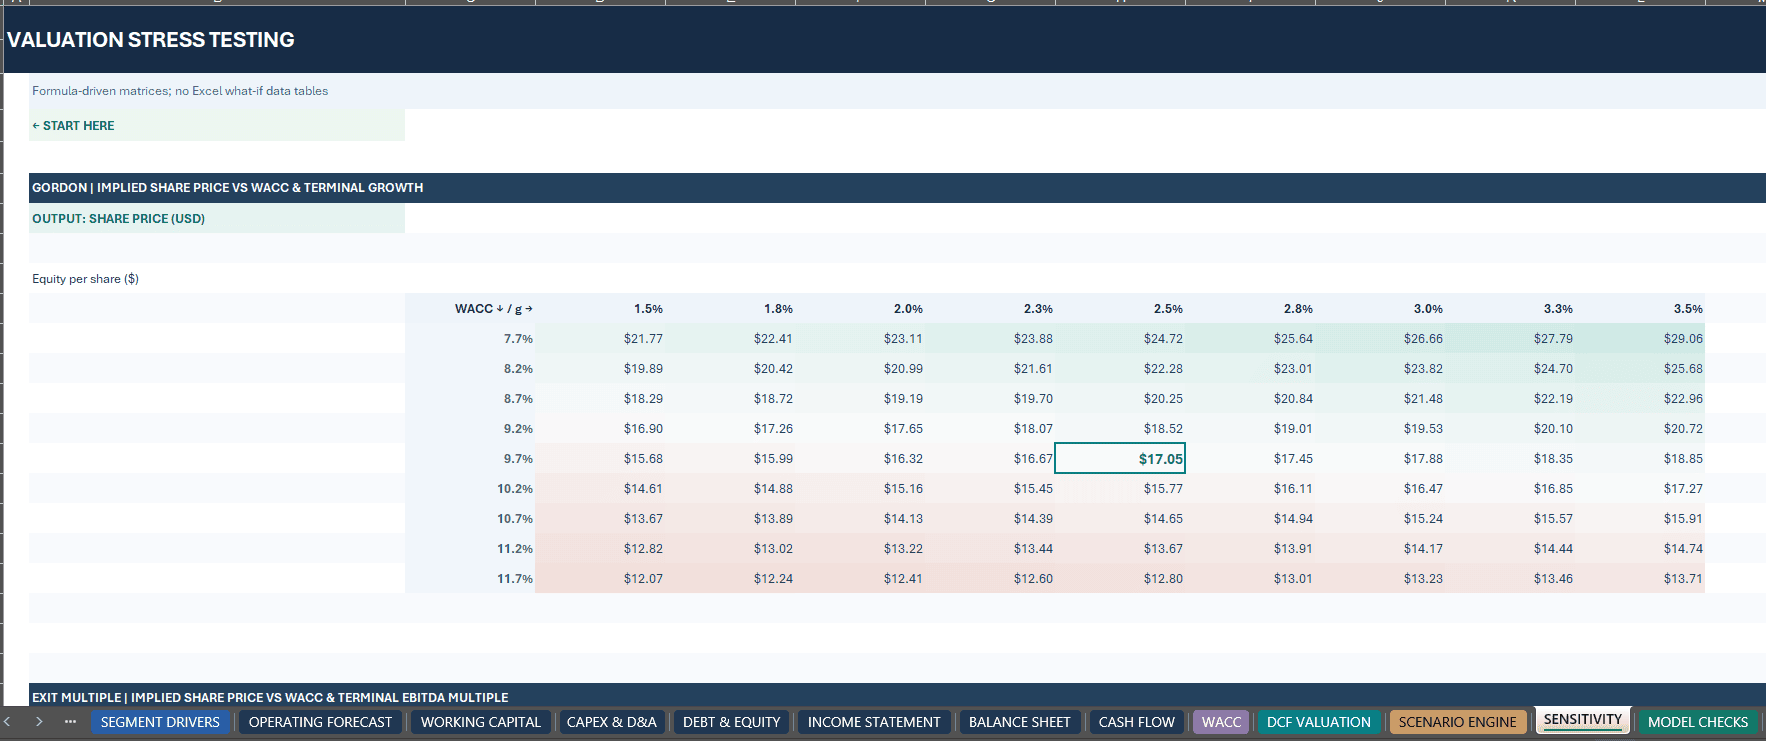
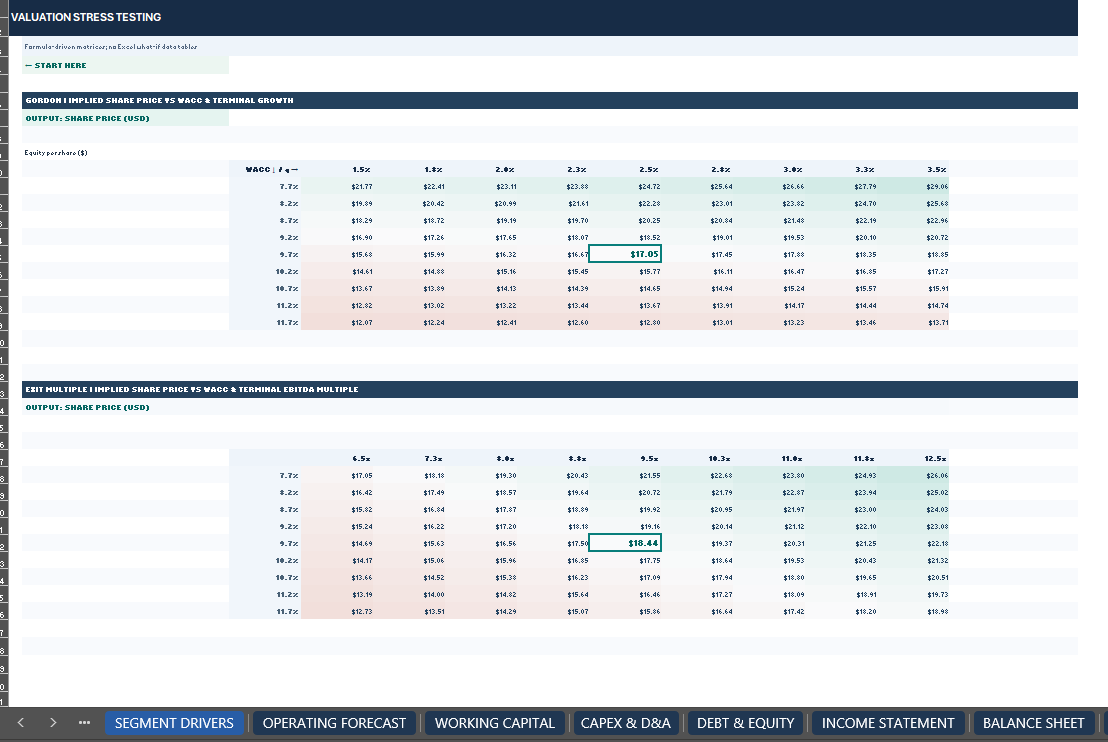
TWO FORMULA-DRIVEN SENSITIVITY MATRICES
WACC vs. Perpetual Growth
Analyze implied value per share across different discount-rate and long-term growth assumptions.
WACC vs. EBITDA Exit Multiple
Explore implied share prices under alternative discount rates and terminal valuation multiples.
Both sensitivity matrices use standard worksheet formulas rather than Excel-exclusive What-If Data Tables.
The model also checks that selected central sensitivity outcomes reconcile with the corresponding valuation methods.
✅ 7. FINANCIAL MODEL CHECKS & RECONCILIATION
The dedicated MODEL CHECKS worksheet includes 21 automated financial integrity controls.
Controls cover:
• Historical Balance Sheet Reconciliation
• Forecast Balance Sheet Reconciliation
• Opening and Closing Cash Continuity
• Segment Revenue Consistency
• Free Cash Flow Reconciliation
• Independent Scenario Calculations
• Sensitivity Center Alignment
• Financial Debt Movements
• Working Capital and Asset Relationships
• WACC Calculation
• Enterprise-to-Equity Value Bridge
• Positive Diluted Share Count
• Gordon Growth and WACC Validity
• Additional Historical and Forecast Financial Relationships
The supplied fictional Base example passes all 21 individual controls.
A PASS result confirms that the relevant programmed relationships reconcile. It does not independently validate the commercial assumptions, forecast accuracy or appropriateness of a valuation.
📦 8. WHAT YOU RECEIVE
FILE 1 — ADVANCED DCF BUSINESS VALUATION MODEL (.XLSX)
One fully editable Excel workbook containing:
• 21 Integrated Worksheets
• Three Years of Historical Financial Information
• 10-Year Annual Financial Forecast
• 15 Illustrative Revenue Streams
• Three Integrated Financial Statements
• Financial Ratios and Operational Analysis
• CAPM and WACC
• Gordon Growth Terminal Valuation
• EBITDA Exit Multiple Valuation
• Enterprise and Equity Value Calculations
• Base, Upside and Downside Scenarios
• Two Valuation Sensitivity Matrices
• 16 Native Excel Charts
• Executive Dashboard
• Visual Analytics
• Valuation Brief
• 21 Model Integrity Controls
FILE 2 — COMPLETE HOW-TO-USE GUIDE (.PDF)
A comprehensive 35-page English user manual covering:
• Initial Workbook Setup
• Worksheet Navigation
• Editable Input References
• Historical Financial Information
• Revenue Segments and Forecast Drivers
• Integrated Financial Statements
• CAPM and WACC Calculations
• Discounted Cash Flow Methodology
• Gordon Growth Valuation
• EBITDA Exit Multiple Valuation
• Scenario Analysis
• Sensitivity Matrices
• Dashboard and KPI Interpretation
• Financial Model Checks
• Troubleshooting
• Financial Modeling Conventions and Limitations
Both purchased files are delivered together in one ZIP package.
The complete 35-page PDF guide may also be offered as a complimentary reference document. The free guide does not include the functional Excel model.
👥 9. WHO IS THIS FINANCIAL MODEL FOR?
Designed for investment analysts, corporate finance teams, financial advisers, business owners, company founders, private investors, business valuation professionals, consultants and advanced financial modeling students.
The workbook is especially suitable for users who want a transparent framework for developing operating-company valuations and explaining the underlying financial assumptions.
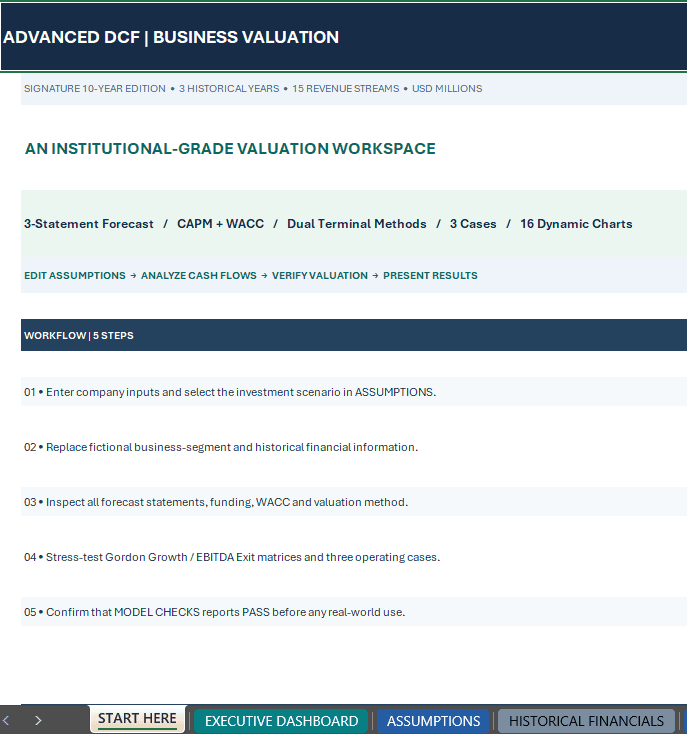
🧭 10. HOW TO USE
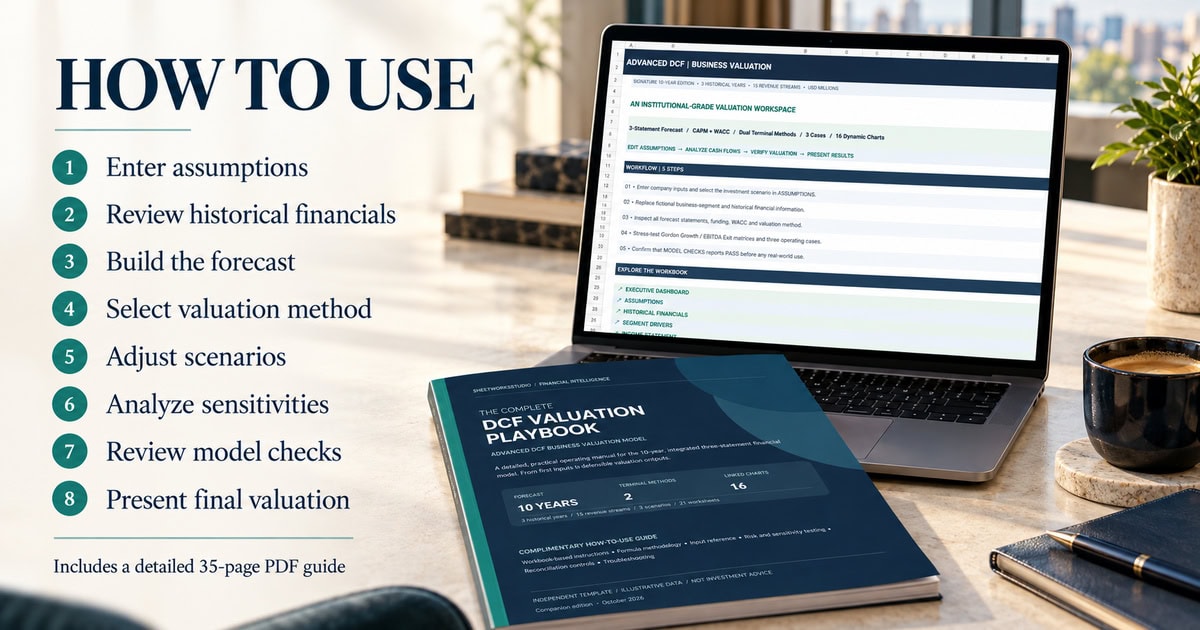
STEP 1 — CONFIGURE THE MODEL
Review START HERE and select the forecast start year, currency, scenario and valuation method.
STEP 2 — CUSTOMIZE HISTORICAL FINANCIALS
Replace the fictional historical financial statements and revenue segment assumptions with company-specific information.
STEP 3 — REVIEW THE FINANCIAL FORECAST
Analyze the connected operating forecast, working capital, CAPEX, debt and three financial statements.
STEP 4 — CONFIGURE WACC & VALUATION
Adjust capital-market assumptions, diluted shares, perpetual growth or the EBITDA Exit Multiple.
STEP 5 — ANALYZE SCENARIOS
Compare the three valuation cases and review both sensitivity matrices.
STEP 6 — VERIFY RESULTS
Review MODEL CHECKS, the Executive Dashboard, Visual Analytics and the Valuation Brief before relying on the outputs.
⚙️ 11. TECHNICAL SPECIFICATIONS
Product: Advanced DCF Business Valuation Model
Forecast Horizon: 10 Annual Periods
Historical Data: Three Annual Periods
Worksheets: 21
Native Excel Charts: 16
Revenue Segments: 15 Illustrative Streams
Scenarios: Base, Upside, Downside
Valuation: Discounted Cash Flow
Terminal Methods: Gordon Growth and EBITDA Exit Multiple
Cost of Capital: CAPM-Based WACC
Sensitivity: Two Formula-Driven Matrices
Financial Statements: Income Statement, Balance Sheet and Cash Flow
Model Controls: 21
Documentation: 35-Page English PDF Guide
Formats: XLSX + PDF
Recommended Software: Microsoft Excel Desktop
VBA / Macros: Not Required
External Workbook Links: Not Required
Delivery: Digital ZIP Download
Google Sheets import and functional compatibility have not been independently verified. Equivalent chart rendering, formatting, dropdown behavior and calculations are therefore not guaranteed.
🛡️ 12. IMPORTANT MODEL LIMITATIONS & DISCLAIMER
The workbook contains fictional historical financial information, operating assumptions, forecast values and valuation outputs for demonstration and educational purposes.
Actual company valuations depend on the quality of source information, forecast assumptions, discount rates, terminal-value methodology and relevant business conditions.
The model does not constitute a certified business valuation, independent fairness opinion, financial audit, investment recommendation, legal advice or tax advice.
Users should independently verify all relevant assumptions and seek appropriate professional advice before relying on results for financial or investment decisions.
This is an independent, unofficial SheetworksStudio template and is not affiliated with or endorsed by Microsoft, Google, stock exchanges or financial regulators.
No live market-data feeds, third-party financial integrations or automated external connections are included.
DEVELOP THE FORECAST. EVALUATE THE CASH FLOWS. TEST THE DISCOUNT RATE. EXPLAIN THE VALUE.
One Connected Excel Framework for Professional Business Valuation and Financial Analysis.
SheetworksStudio | Professional Financial Modeling Templates
Similar ProductsOther customers were also interested in...



 eFinancialModels
Electric Vehicle (EV) Charging Station Financial M...
With this comprehensive 5- or 10-year monthly tool, investors can assess the viability of setting up... Read more

Financial Model for Mobile App | Mobile App Busine...
The Mobile App Financial Plan Template in Excel allows you to develop financial projections when lau... Read more

 HenrySheykin
Food Truck Financial Model Excel Template
The Food Truck Financial Model helps entrepreneurs, founders, business owners, consultants, and anal... Read more

Green Hydrogen Production from Wind Energy Financi...
The Green Hydrogen from Wind Financial Model aims to comprehensively forecast a horizon of 40 years ... Read more

Simple Mutual Non-Disclosure Agreement Template
Protect your business secrets with ease using our Simple Mutual Non-Disclosure Agreement Template. S... Read more

Solar Energy Financial Model
The Solar Energy Financial Model Spreadsheet Template in Excel assists you in preparing a sophistica... Read more

 Peter Graf
The Customer-Centric Financial Model for Restauran...
Starting a restaurant without a financial plan is like driving a car blindfolded. You wouldn´t do i... Read more
You must log in to submit a review.