
0 ITEMS

Manufactured Housing Community (MHC) Acquisition Model — Lot Rent Mark-to-Market, Park-Owned Homes, Vacant-Pad Infill, MIN(LTV, DSCR, Debt Yield) Loan Sizing and Levered IRR
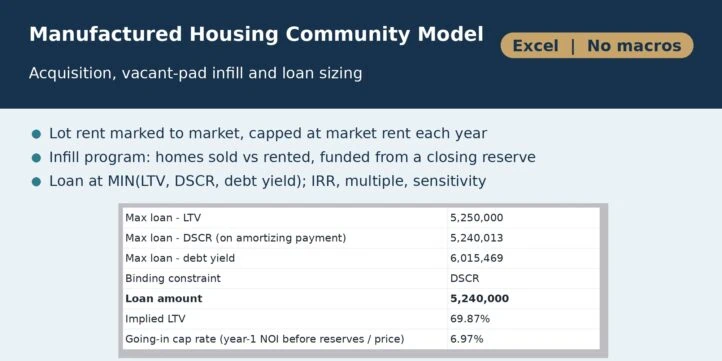
Underwrite a mobile home park purchase in one workbook: tenant-owned vs park-owned pads, lot rent marked to market and capped at market rent each year, a vacant-pad infill program (homes sold vs rented, funded from a closing reserve), 10-year cash flow, loan sized at the lowest of LTV, DSCR and debt yield, and levered and unlevered returns with an exit-cap x price sensitivity grid.
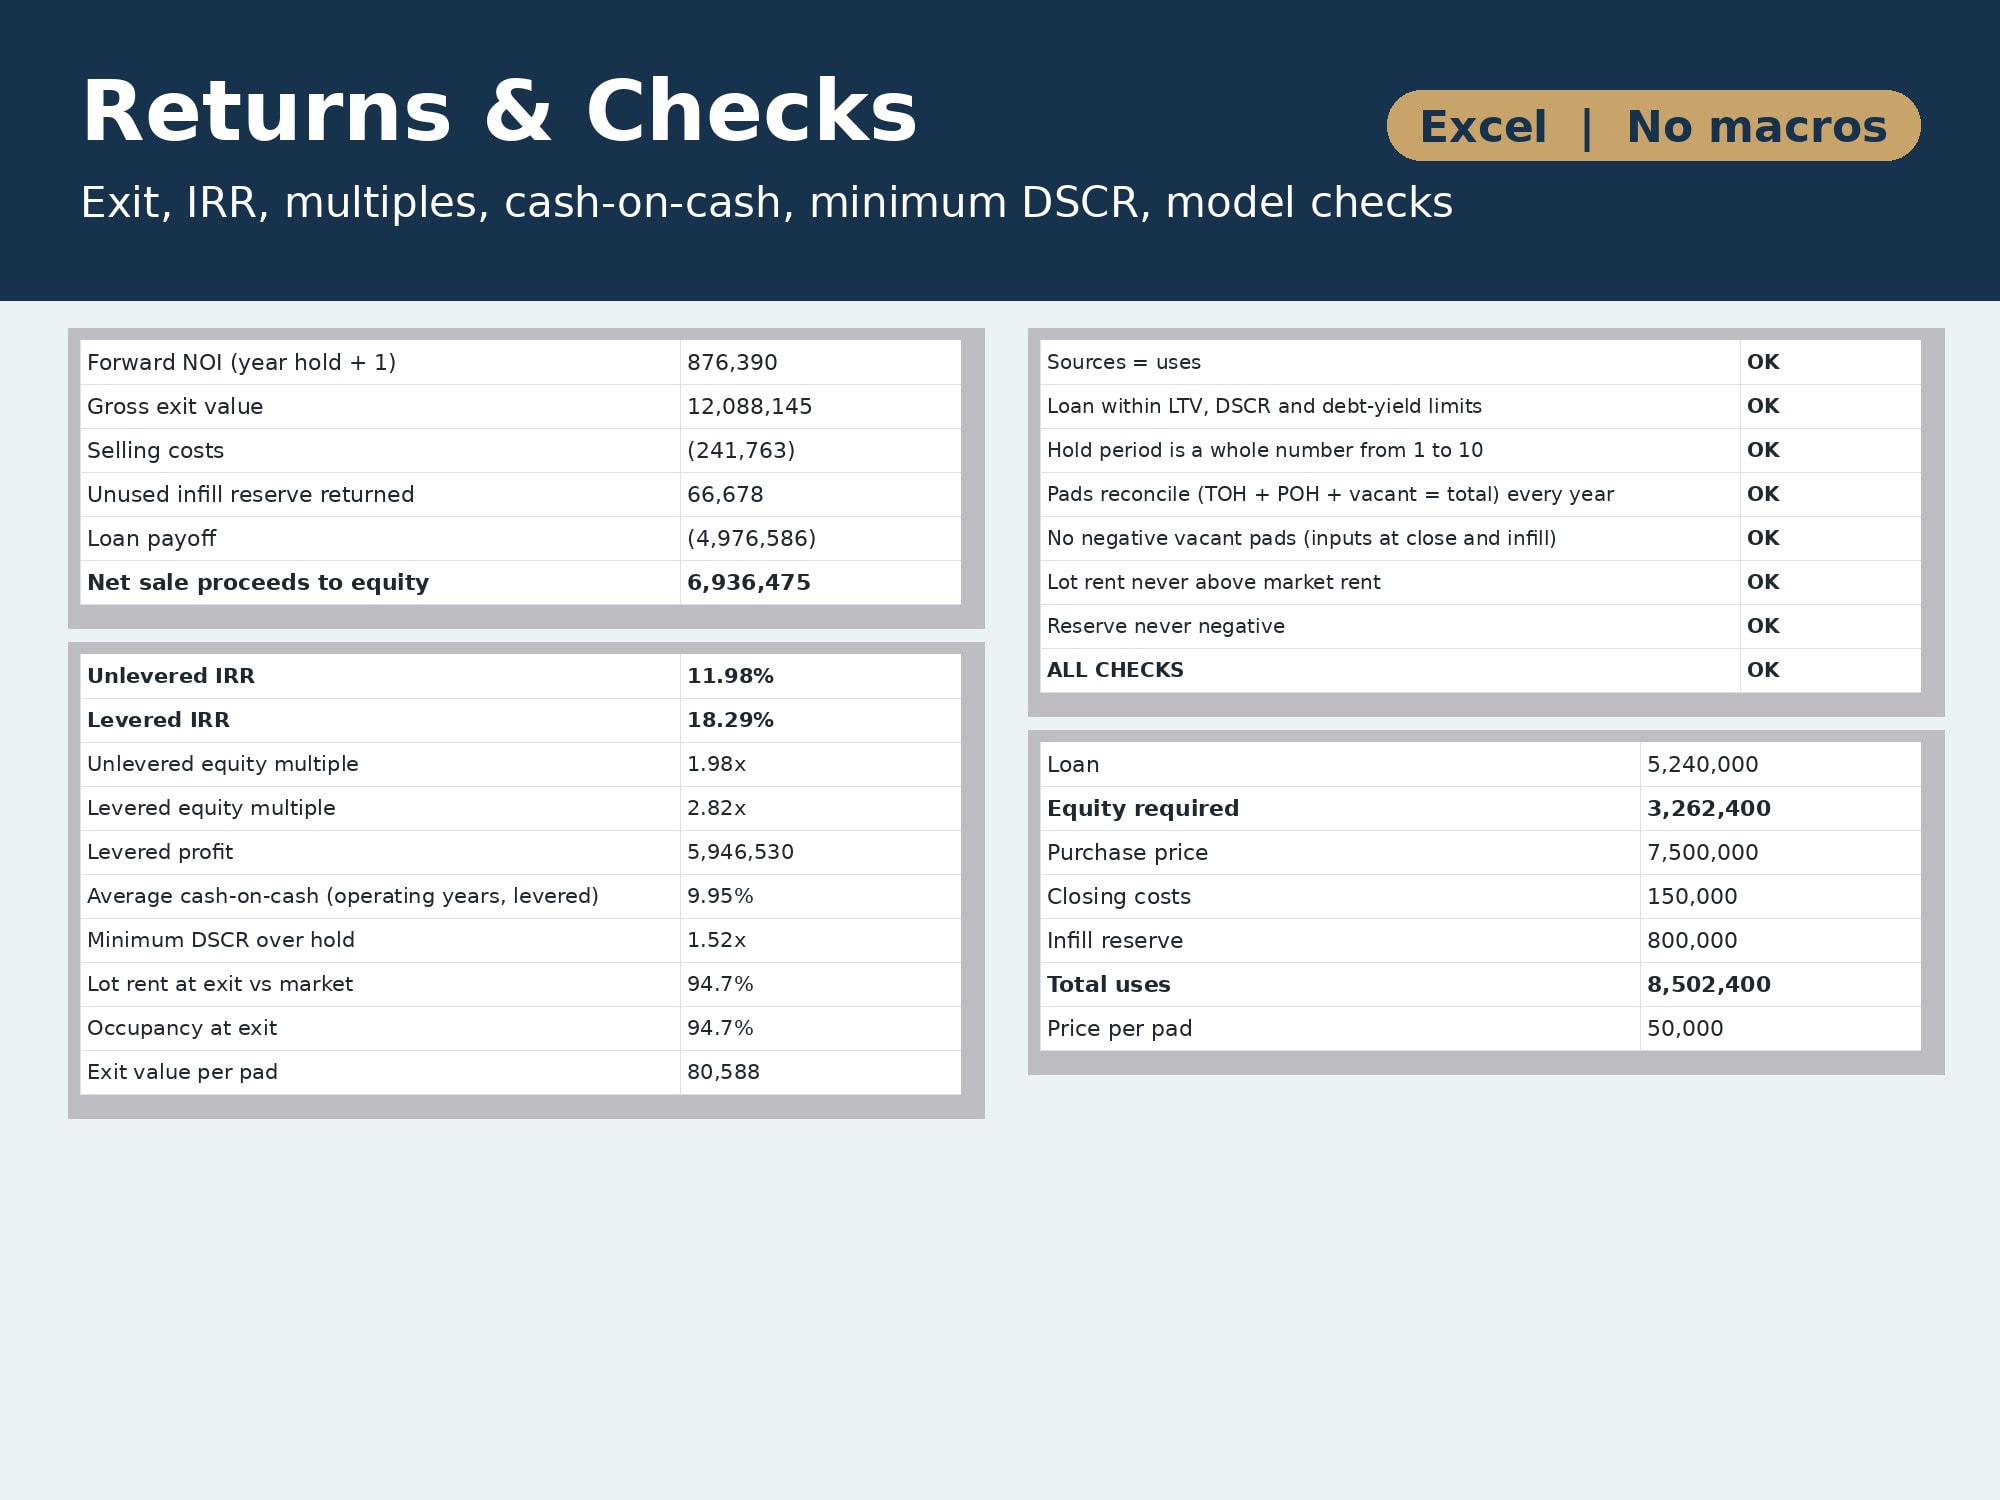
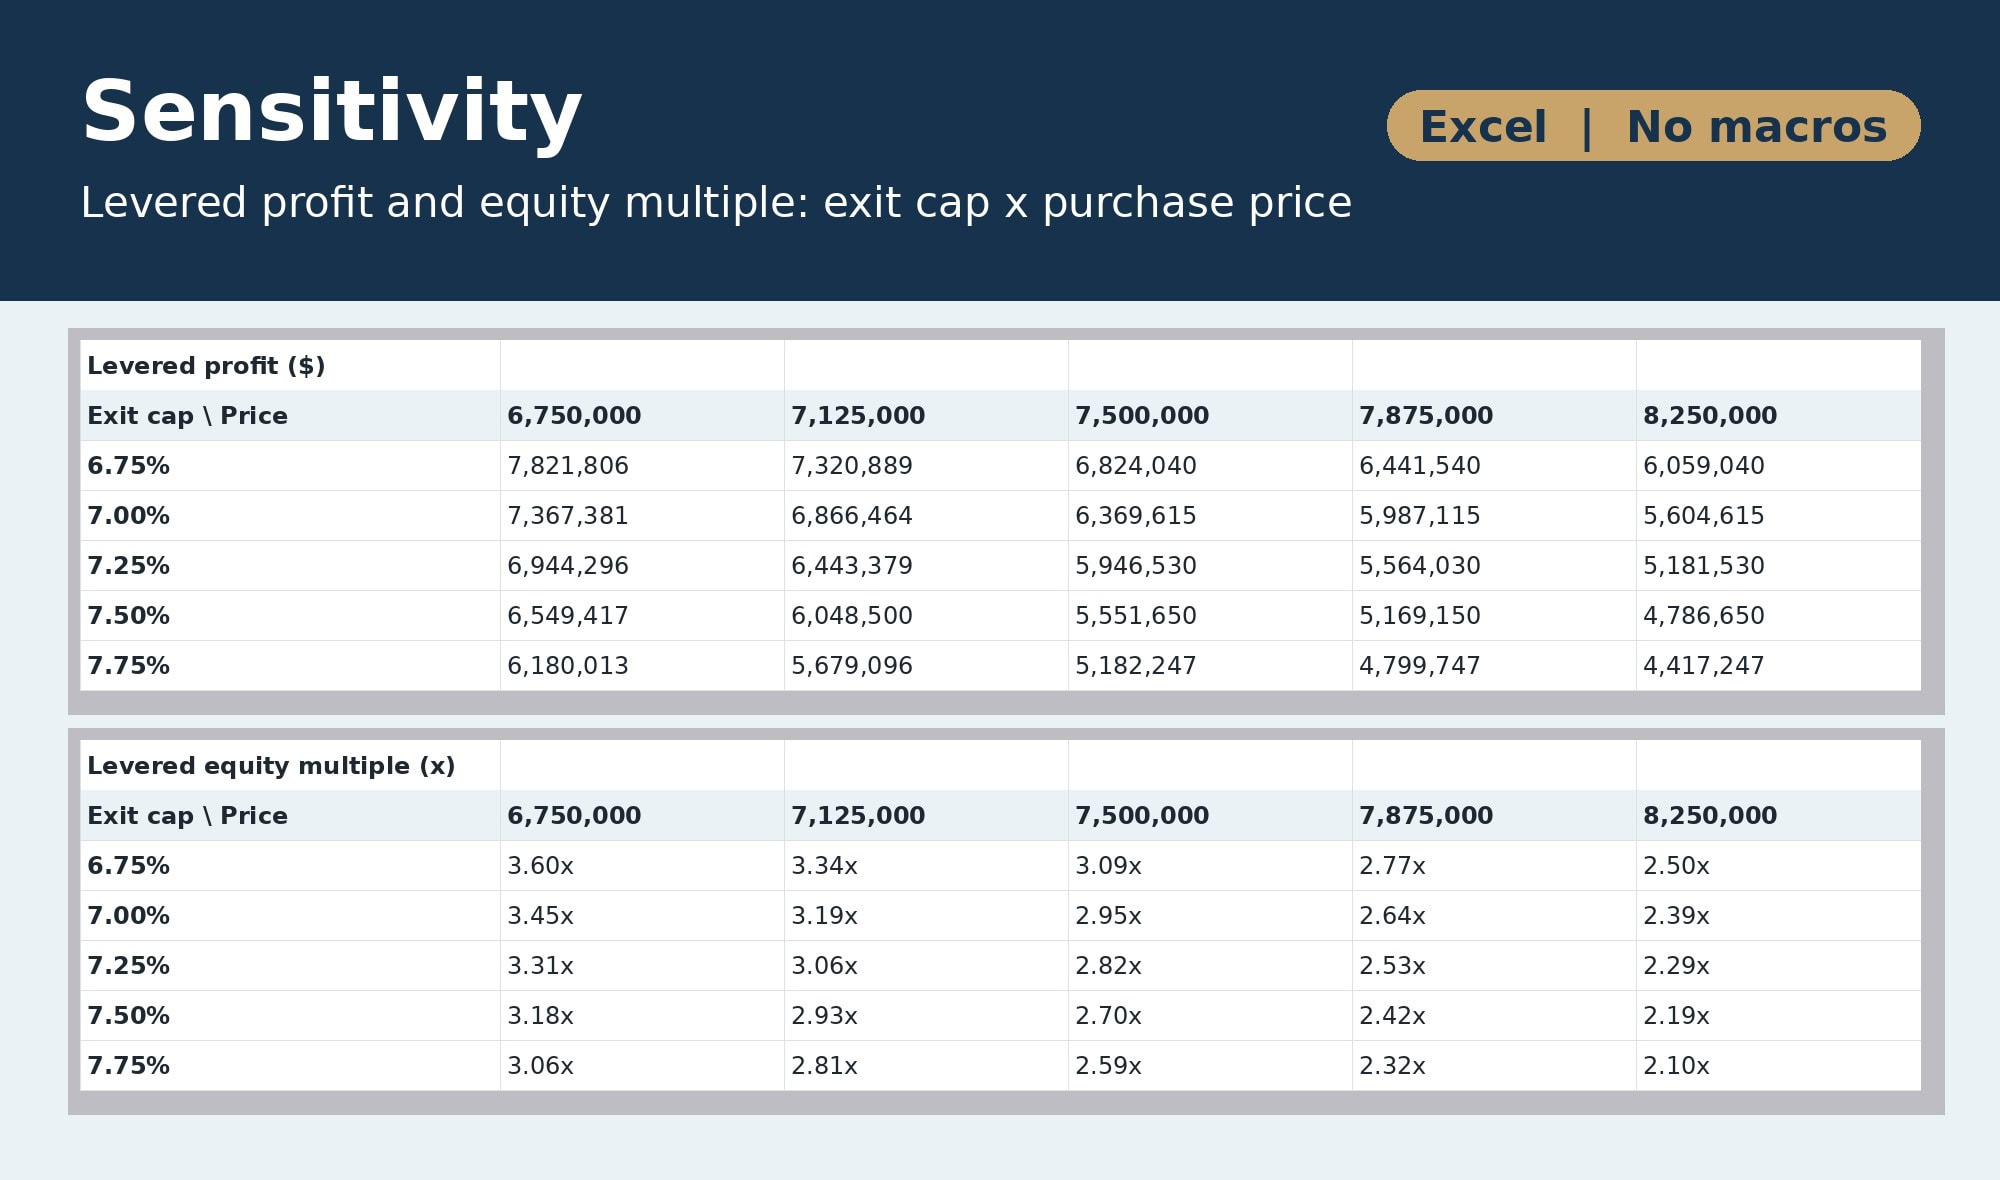
Built for buyers, brokers and lenders underwriting manufactured housing communities, from 50-pad mom-and-pop parks to institutional-size communities.
Inputs
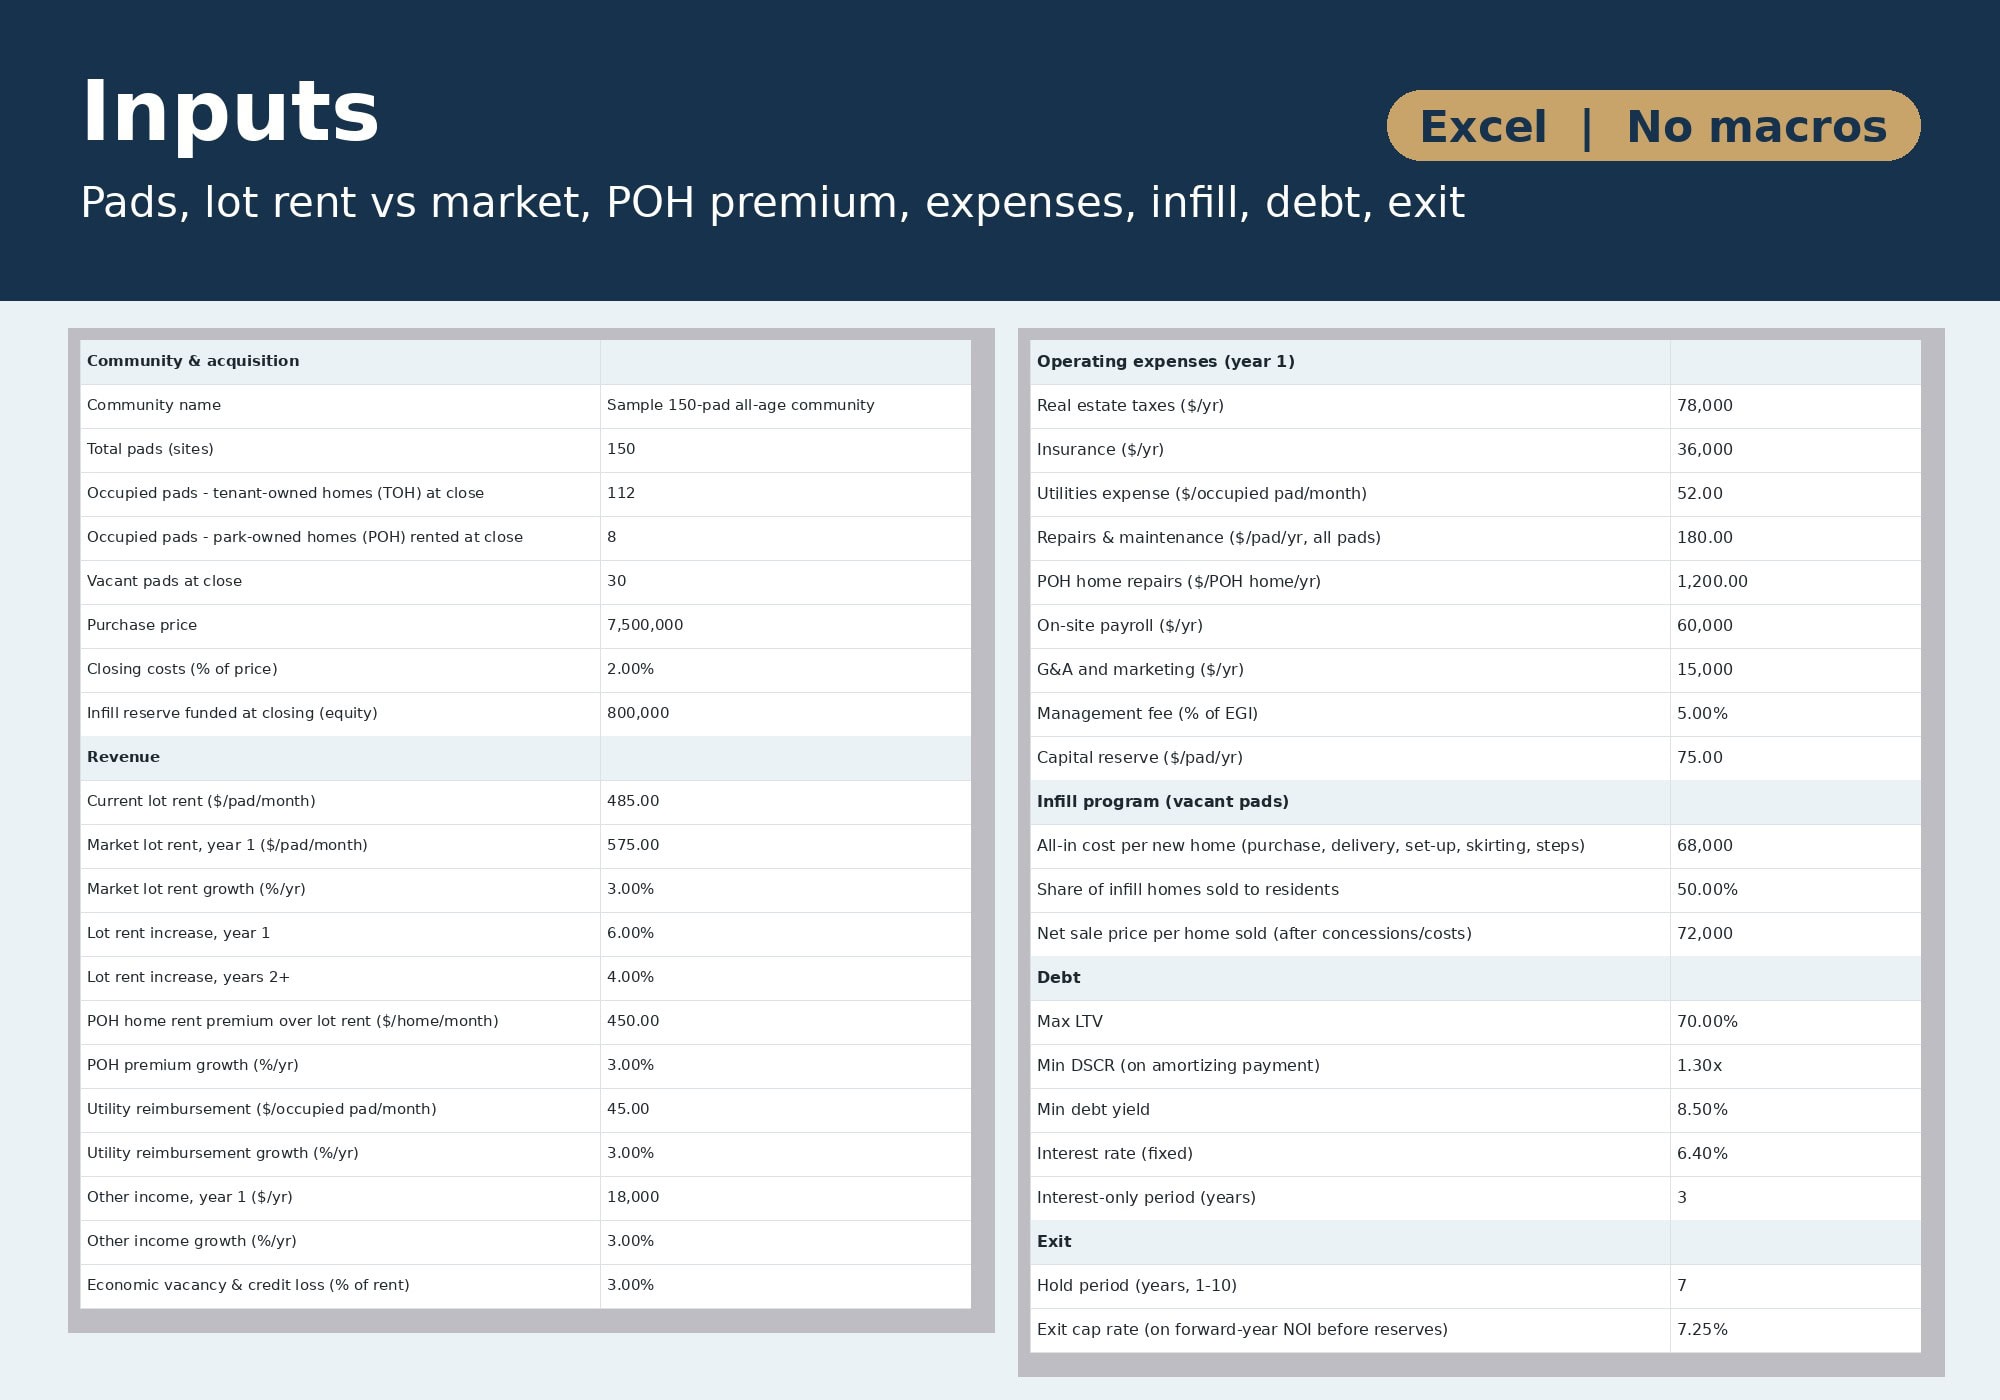
- Pad counts at close: tenant-owned homes (TOH), park-owned homes (POH) and vacant pads
- Purchase price, closing costs, infill reserve funded at closing
- Lot rent: current rent, market rent and growth, year-1 and ongoing increases (lot rent never exceeds market in any year)
- POH home rent premium, utility bill-back, other income, economic vacancy and credit loss
- Operating expenses line by line: taxes, insurance, utilities, R&M per pad, POH home repairs, payroll, G&A, management fee, capital reserve per pad
- Debt: max LTV, min DSCR, min debt yield, rate, amortization, interest-only years, origination fee
- Exit: hold period (1-10 years), exit cap on forward-year NOI, selling costs
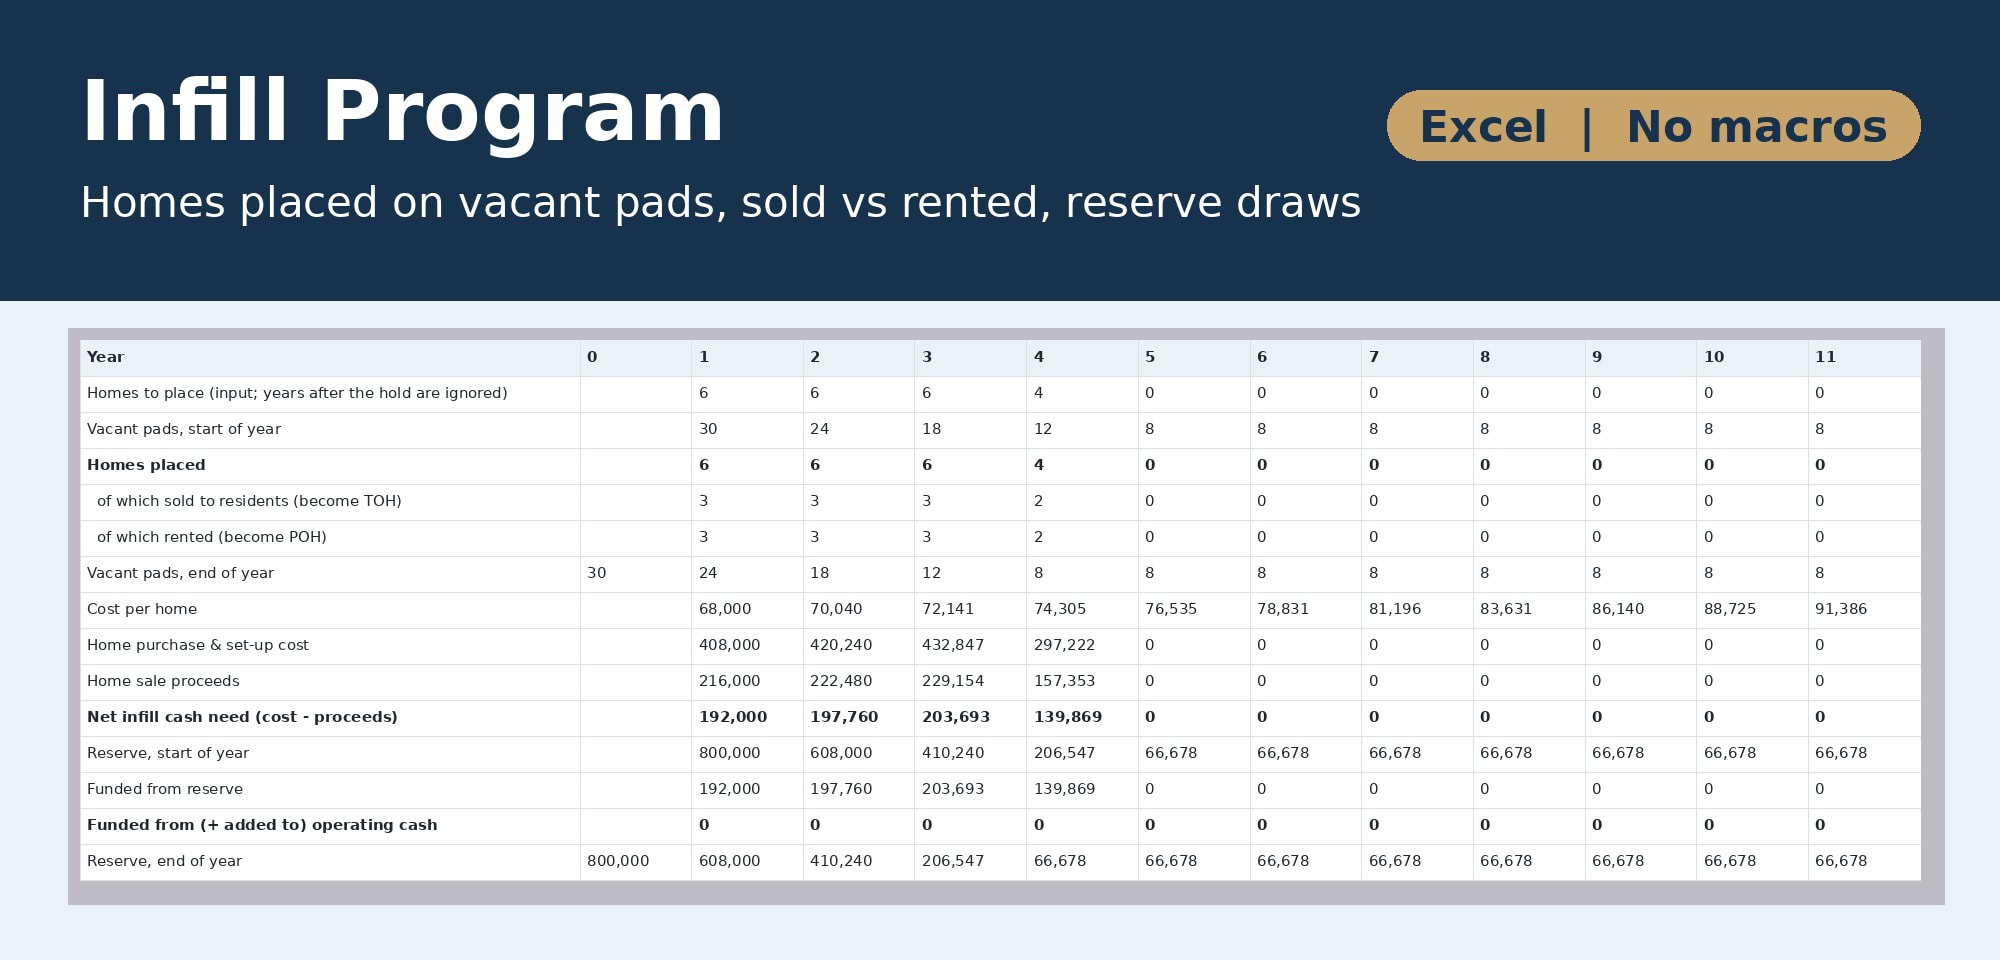
Infill program (the main MHC value-add lever)
- Homes placed per year on vacant pads, capped at the pads available and stopped after the hold year
- Split between homes sold to residents (become tenant-owned) and homes rented (become park-owned)
- Home cost and sale price with growth; net cash need funded first from the closing reserve, then from operating cash flow
- Unused reserve returned to equity at exit; half-year income convention for homes placed
Outputs
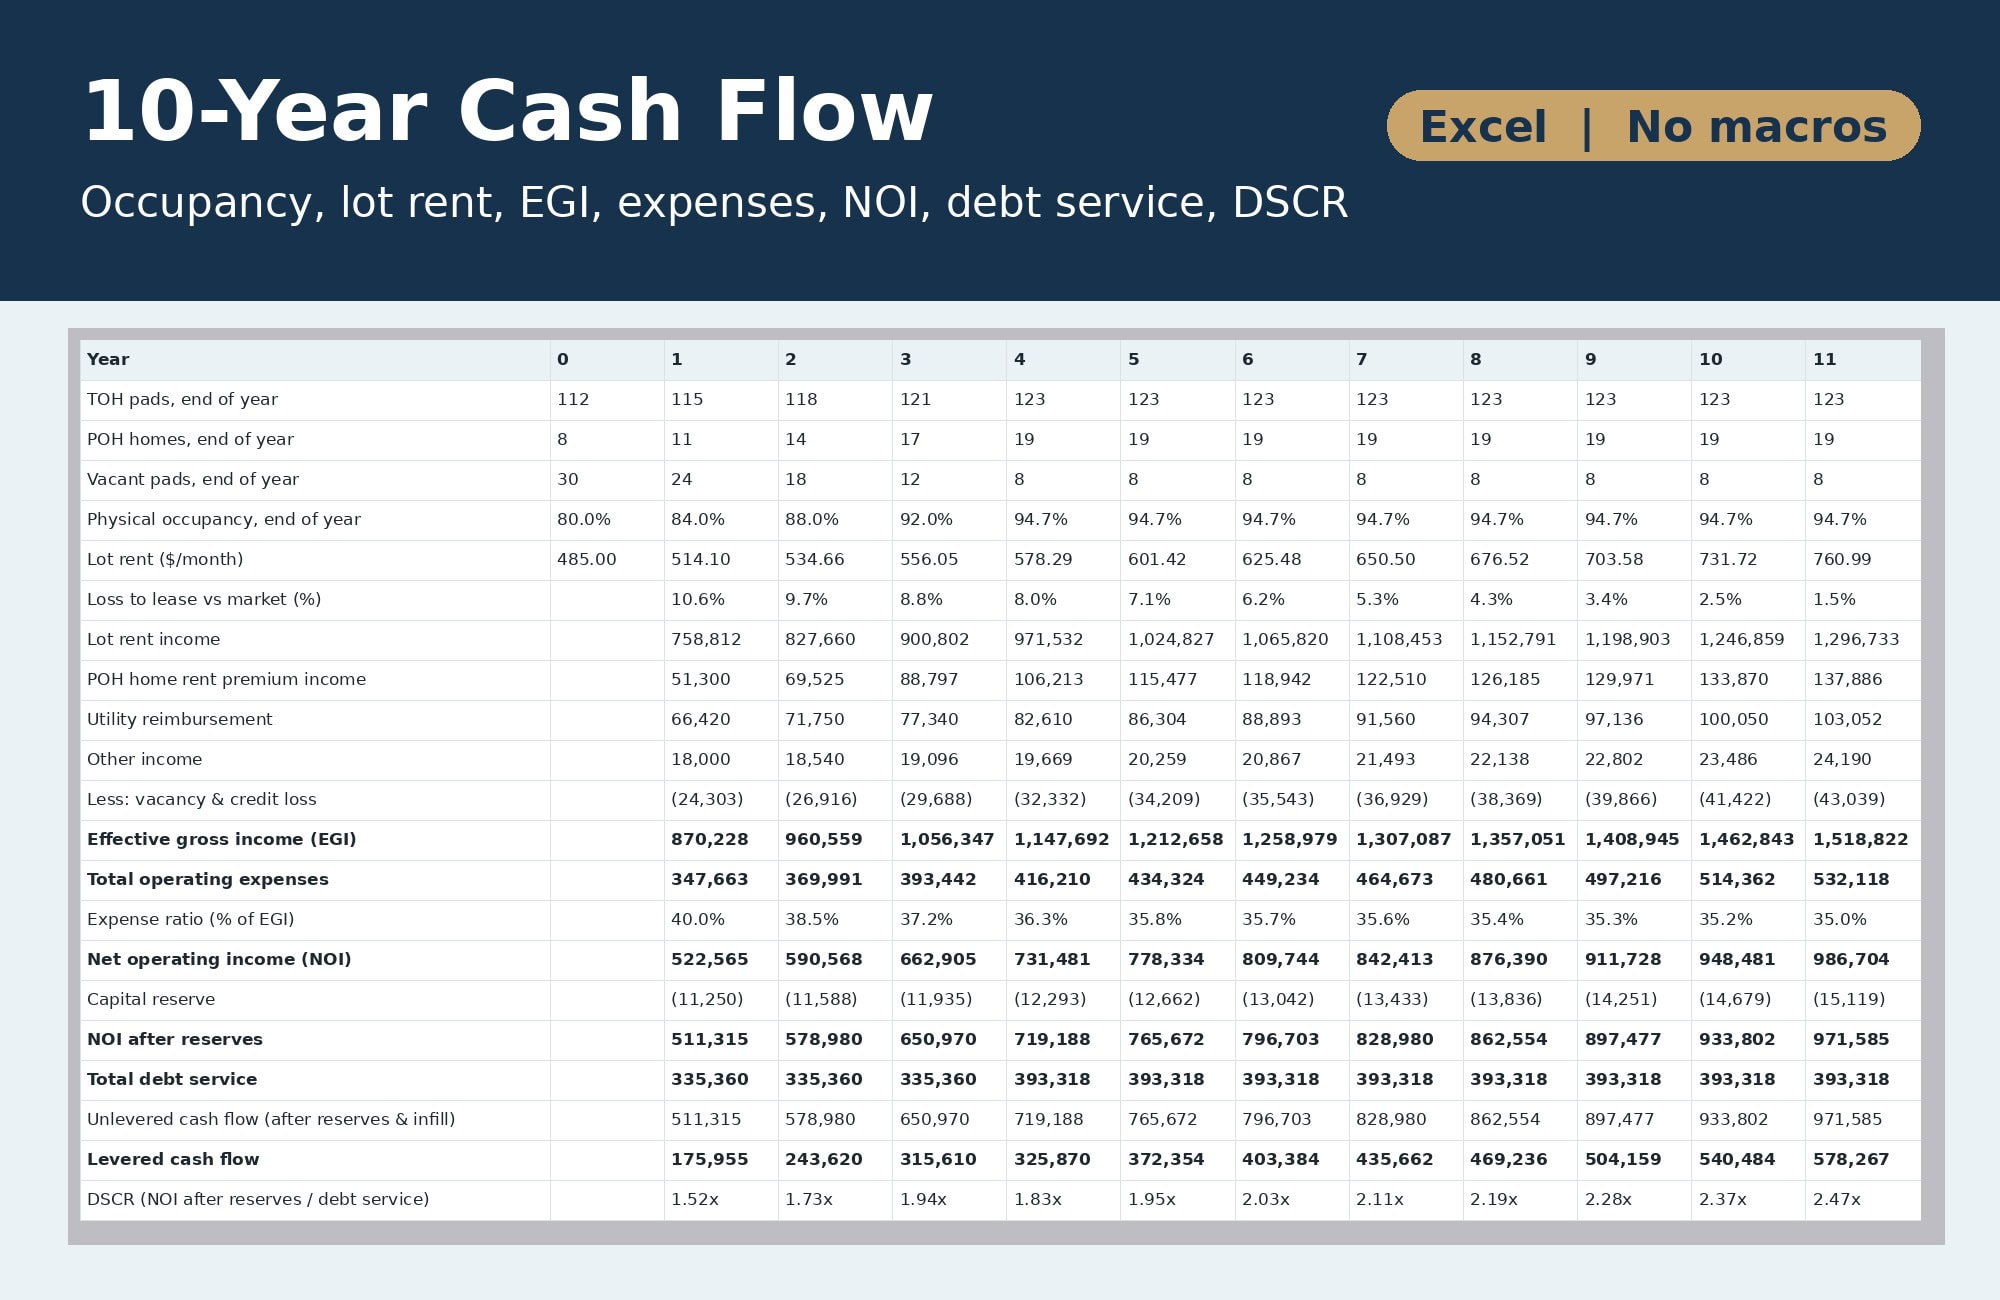
- 10-year annual cash flow: occupancy, lot rent vs market (loss to lease), lot rent and POH income, utility reimbursement, EGI, expenses and expense ratio, NOI, reserves, debt service, unlevered and levered cash flow, DSCR, debt yield, cash-on-cash
- Loan amount with the binding constraint named (LTV / DSCR / Debt yield), implied LTV, year-1 DSCR and debt yield
- Sources and uses, price per pad, going-in cap rate
- Unlevered and levered IRR, equity multiples, levered profit, average cash-on-cash, minimum DSCR over the hold, exit value per pad
- Sensitivity: levered profit and equity multiple across five exit cap rates and five purchase prices, with the loan re-sized per price
- Checks block (sources = uses, loan within limits, valid hold, pads reconcile, no negative vacancy, lot rent at or below market, reserve never negative) that must read OK
File: MHC_Acquisition_Infill_Loan_Sizing_Model.xlsx (Excel 2016+, no macros). Recalculated with zero formula errors and tested across ten scenarios (1- and 10-year holds, no interest-only, interest-only longer than the hold, infill larger than vacancy, no reserve, all homes sold, fully occupied at close, LTV-bound and debt-yield-bound loans). Sample inputs are illustrative, not market data. Rent increases are inputs: check state and local rent-increase limits before relying on them. Built with AI assistance and reviewed by Eastwich Advisors. Not investment advice.
Similar ProductsOther customers were also interested in...



 eFinancialModels
Electric Vehicle (EV) Charging Station Financial M...
With this comprehensive 5- or 10-year monthly tool, investors can assess the viability of setting up... Read more

Financial Model for Mobile App | Mobile App Busine...
The Mobile App Financial Plan Template in Excel allows you to develop financial projections when lau... Read more

 HenrySheykin
Food Truck Financial Model Excel Template
The Food Truck Financial Model helps entrepreneurs, founders, business owners, consultants, and anal... Read more

Green Hydrogen Production from Wind Energy Financi...
The Green Hydrogen from Wind Financial Model aims to comprehensively forecast a horizon of 40 years ... Read more

Simple Mutual Non-Disclosure Agreement Template
Protect your business secrets with ease using our Simple Mutual Non-Disclosure Agreement Template. S... Read more

Solar Energy Financial Model
The Solar Energy Financial Model Spreadsheet Template in Excel assists you in preparing a sophistica... Read more

 Peter Graf
The Customer-Centric Financial Model for Restauran...
Starting a restaurant without a financial plan is like driving a car blindfolded. You wouldn´t do i... Read more
You must log in to submit a review.