
0 ITEMS

Roller Skate Rink Business Plan Financial Model – 10-Year Forecast, Capacity, Parties, Memberships & Valuation
Build a decision-ready business plan for a roller skating rink with a fully linked 10-year monthly financial and operating model. This workbook is designed for buyers who need more than a simple revenue-and-expense forecast. It connects the operating calendar, session capacity, attendance, admission pricing, skate rentals, memberships, birthday parties, private events, lessons, concessions, arcade spend, merchandise, staffing, operating costs, capital expenditure, debt service and investor returns into one integrated Excel model. 🎯 What problem does this model solve?
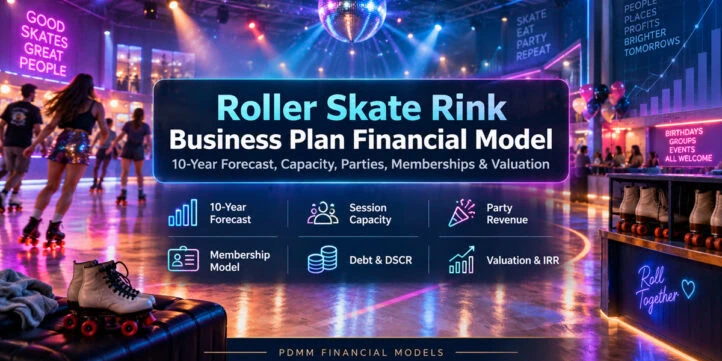


🛼 Roller Skate Rink Business Plan Financial Model
Build a decision-ready business plan for a roller skating rink with a fully linked 10-year monthly financial and operating model. This workbook is designed for buyers who need more than a simple revenue-and-expense forecast. It connects the operating calendar, session capacity, attendance, admission pricing, skate rentals, memberships, birthday parties, private events, lessons, concessions, arcade spend, merchandise, staffing, operating costs, capital expenditure, debt service and investor returns into one integrated Excel model.
🎯 What problem does this model solve?
A roller rink can look attractive on revenue alone while still failing because of weak session utilization, poor party-room economics, low rental attachment, excessive labor, insufficient cash reserves, poorly timed equipment replacement or an acquisition price that cannot support debt service. This model helps translate those operational questions into measurable financial outcomes.
You can use it to evaluate an acquisition, a startup, a renovation, a refinancing or an expansion plan. The model identifies how many visits and how much revenue are required to support the facility, how operating performance changes across Downside, Base and Upside cases, and how those operating results flow into cash, debt capacity, valuation and equity returns.
🧭 Model workflow
Start on the Scenario & Assumptions sheet, select the operating case and replace the blue-font assumptions with your own data. The model then flows through the weekly operating calendar, session-level capacity, pricing, rentals, memberships, events, ancillary revenue, staffing, operating expenses, capex, working capital and financing schedules. The monthly P&L, Balance Sheet and Cash Flow Statement update automatically, followed by annual summaries, unit economics, valuation, investor returns, scenario comparison and dashboards.
The default workbook contains fictional sample data so every calculation, chart and dashboard is immediately demonstrable and fully editable.
✏️ Key editable inputs
The assumptions cover transaction mode, forecast start, tax rate, WACC, terminal growth, exit EBITDA multiple, distribution payout, rink capacity, facility area, party rooms, skate fleet, lease economics, purchase price, renovation budget, debt terms, optional refinancing, optional expansion, capex cycles, working-capital days, rental attachment, membership economics, party packages, group pricing, lesson fees, private-event pricing, concession conversion and spend, arcade and retail economics, merchant fees, marketing, utilities, insurance, payroll burden, labor rates, staffing ratios, weekly sessions, session duration, capacity factors, base utilization, monthly seasonality and other operating drivers.
The model also supports leased versus owned occupancy, acquisition versus startup mode, optional refinancing and optional expansion.
📅 Operating model and capacity planning
The Facility & Operating Calendar and Session Capacity & Attendance schedules convert weekly sessions into monthly capacity and visits. Public sessions, weekend sessions, adult nights, family sessions, school/group activity, lessons, parties and private events are modeled separately.
Attendance reflects scenario selection, monthly seasonality, ramp assumptions and annual growth. Capacity controls prevent modeled occupancy from exceeding the rink limit. The model also distinguishes member visits from paid admissions and tracks peak occupancy, utilization and facility visits.
💵 Revenue build
Revenue is developed from operating drivers rather than a single top-line growth assumption. The workbook includes:
- Admission revenue by session/customer type
- Skate-rental attachment, pricing and fleet adequacy
- Membership additions, churn, recurring dues and usage
- Birthday-party bookings, guests, package price, add-ons and direct cost
- Private events and group/event activity
- Lessons and programs
- Concessions using buyer conversion and average spend
- Arcade revenue per facility visit
- Merchandise and pro-shop attachment and ticket size
The Revenue Build also calculates revenue per facility visit, ancillary revenue per visit, direct COGS as a percentage of revenue and gross margin.
👥 Labor, operating expenses and capital needs
Labor is linked to operating activity. The staffing schedule calculates hours and wages for front desk, floor guards, concessions, party hosts, cleaning/maintenance and DJ/security functions, with wage inflation, management salaries and payroll burden included.
Operating expenses include rent, CAM/NNN, property tax where applicable, utilities, insurance, marketing, repairs and maintenance, software, music/licensing, cleaning supplies, security/other fixed costs, G&A and merchant fees.
The Capex & Lifecycle schedule includes maintenance capex, skate replacement, floor resurfacing, arcade refresh, systems refresh, depreciation and optional expansion investment. Working capital models receivables, inventory, payables and party deposits.
🏦 Financing, statements and liquidity
The workbook includes acquisition/startup Sources & Uses and a monthly debt schedule with opening acquisition debt, scheduled amortization, interest, optional refinancing and covenant analytics.
Three statements are fully linked:
- Monthly Profit & Loss
- Balance Sheet
- Cash Flow Statement
Annual Financials summarize the full 10-year forecast, including revenue, margins, EBITDA, EBIT, net income, operating cash flow, capex, free cash flow, cash, debt, equity and operating KPIs.
📊 Decision analysis, valuation and returns
The Unit Economics sheet calculates contribution economics, fixed-cost base, break-even revenue, break-even facility visits, break-even visits per month, break-even visits per public session, revenue per visit, labor per visit, party contribution per booking, membership revenue per member, rental revenue per eligible visit and cash reserve coverage.
The Investor Returns schedule calculates initial equity, exit proceeds, equity IRR, equity MOIC, payback year, annual distributions and cash-on-cash yield.
The DCF & Exit Valuation sheet includes annual unlevered free cash flow, discount factors, explicit-period value, terminal value, DCF enterprise/equity value and exit-multiple enterprise/equity value.
🔀 Scenarios and sensitivities
The model includes Downside, Base and Upside scenarios for utilization, attendance growth, admission price growth, party utilization, new members, churn, ancillary-spend growth, wage inflation, opex inflation, group/private utilization and ramp timing.
Four dedicated sensitivity analyses test:
- Year-2 EBITDA: attendance versus admission price
- Year-2 EBITDA: party utilization versus package price
- Year-5 EBITDA: public utilization versus wage cost
- Equity MOIC: acquisition price versus exit multiple
A Scenario Comparison sheet provides normalized Downside/Base/Upside operating and value outcomes.
📈 Dashboards and KPIs
The Executive Dashboard presents equity invested, Year-1 revenue, Year-5 EBITDA, EBITDA margin, IRR, MOIC, minimum DSCR, DCF equity value, break-even visits, revenue per visit, facility visits and payback year, together with decision charts and an action panel.
The Operating KPI Dashboard focuses on attendance, utilization, members, party bookings, revenue per visit, labor per visit, rental attachment, skate-fleet buffer, party contribution, membership fee, break-even visits per session and peak occupancy.
The workbook also includes automatic integrity checks for sources/uses, balance-sheet balance, revenue and EBITDA reconciliation, debt, DSCR, utilization limits, party capacity, membership counts, skate-fleet adequacy, occupancy, terminal growth, expansion timing, forecast length, scenario selection and ending PPE.
✅ Recommended use cases
- Build a complete roller skate rink business plan and 10-year forecast
- Evaluate opening a new skating rink or acquiring an existing location
- Forecast revenue, EBITDA, net income, cash flow and balance-sheet position
- Test admission pricing, attendance, session utilization and revenue per guest
- Plan birthday-party, private-event, membership and ancillary-revenue economics
- Determine break-even monthly visits and break-even visits per operating session
- Plan labor scheduling, wage inflation and labor cost per visit
- Forecast maintenance capex, floor resurfacing, skate replacement and equipment refresh
- Assess acquisition financing, debt amortization, refinancing and DSCR
- Compare Downside, Base and Upside operating cases
- Run sensitivities on pricing, attendance, party demand, wages, acquisition price and exit multiple
- Estimate DCF value, exit value, equity IRR, MOIC, payback and cash-on-cash returns
👤 Intended users
This model is suitable for independent rink owners, entrepreneurs, buyers evaluating an existing skating center, family-entertainment operators, multi-location operators, lenders, consultants, search-fund buyers, small-business investors and operators planning renovation, refinancing or expansion.
📦 Delivered files
The package includes the editable Excel financial model, a 30-page worksheet preview PDF and a curated set of buyer-facing screenshots. The workbook is macro-free and uses standard Excel formulas, editable assumptions, native charts and linked schedules.
Similar ProductsOther customers were also interested in...



 eFinancialModels
Electric Vehicle (EV) Charging Station Financial M...
With this comprehensive 5- or 10-year monthly tool, investors can assess the viability of setting up... Read more

Financial Model for Mobile App | Mobile App Busine...
The Mobile App Financial Plan Template in Excel allows you to develop financial projections when lau... Read more

 HenrySheykin
Food Truck Financial Model Excel Template
The Food Truck Financial Model helps entrepreneurs, founders, business owners, consultants, and anal... Read more

Green Hydrogen Production from Wind Energy Financi...
The Green Hydrogen from Wind Financial Model aims to comprehensively forecast a horizon of 40 years ... Read more

Simple Mutual Non-Disclosure Agreement Template
Protect your business secrets with ease using our Simple Mutual Non-Disclosure Agreement Template. S... Read more

Solar Energy Financial Model
The Solar Energy Financial Model Spreadsheet Template in Excel assists you in preparing a sophistica... Read more

 Peter Graf
The Customer-Centric Financial Model for Restauran...
Starting a restaurant without a financial plan is like driving a car blindfolded. You wouldn´t do i... Read more
You must log in to submit a review.