
0 ITEMS

Coworking & Flexible Office Center Financial Model – 5-Year Forecast, Churn, Deal Structures & Expansion
Build a complete five-year operating and financial view of a coworking or flexible-office business from space allocation and member acquisition through profitability, liquidity, funding, and expansion. This premium Excel model is designed for operators and advisers who need more than a generic revenue forecast: it connects physical capacity, membership behavior, pricing, meeting-room usage, real-estate deal structure, staffing, operating costs, CapEx, debt, working capital, and cash into one editable decision system. 🎯 The buyer problem this model solves
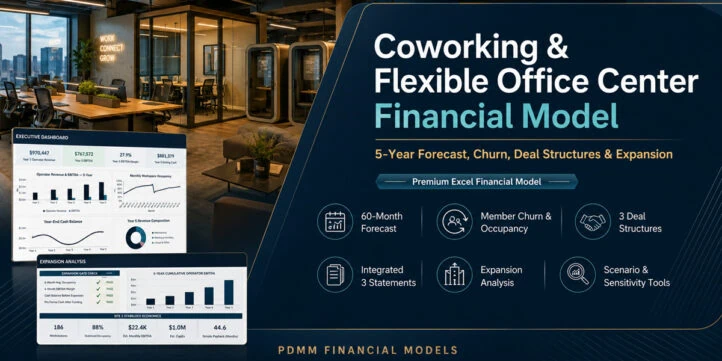


🏢 Coworking & Flexible Office Center Financial Model
Build a complete five-year operating and financial view of a coworking or flexible-office business from space allocation and member acquisition through profitability, liquidity, funding, and expansion. This premium Excel model is designed for operators and advisers who need more than a generic revenue forecast: it connects physical capacity, membership behavior, pricing, meeting-room usage, real-estate deal structure, staffing, operating costs, CapEx, debt, working capital, and cash into one editable decision system.
🎯 The buyer problem this model solves
A coworking center can appear attractive at a headline occupancy level while still destroy cash if the product mix, churn, fit-out burden, lease structure, or expansion timing is wrong. Hot desks, dedicated desks, private offices, team suites, virtual memberships, meeting rooms, and ancillary services have different capacity and economic profiles. At the same time, a fixed lease, management agreement, and revenue-share structure can create very different operator economics even when the underlying center performs identically.
This workbook makes those trade-offs explicit. You can test whether demand is sufficient, how many workstations the site can actually support, what recurring member revenue looks like after churn, how much occupancy is needed to break even, which deal structure offers the most attractive risk/reward, and whether Site 2 should open based on operating and liquidity gates.
🧭 Model workflow
1. Select the active Downside, Base, or Upside scenario and choose Fixed Lease, Management Agreement, or Revenue Share.
2. Replace the centralized sample assumptions with your own operating, pricing, space, cost, funding, and expansion inputs.
3. Review the site program and monthly workstation capacity created from usable square feet, product allocation, and workstation density.
4. Follow the acquisition funnel from leads to tours, trials, conversions, marketing spend, and new members.
5. Review product-level opening members, new joins, churn, and closing members across the 60-month forecast.
6. Validate membership, meeting-room, virtual-office, and ancillary revenue.
7. Compare staffing, operating expenses, real-estate structure costs, CapEx, depreciation, debt, interest, and DSCR.
8. Review integrated Profit & Loss, Balance Sheet, Cash Flow, break-even metrics, sensitivities, expansion gates, and dashboards.
✏️ Centralized editable inputs
Editable assumptions are concentrated in the scenario and assumptions sections rather than buried inside calculation formulas. Inputs include demand and lead growth, conversion rates, member product mix, monthly churn, membership pricing, annual price escalation, virtual-office cross-sell, meeting-room utilization and hourly rates, ancillary revenue per member, marketing cost per lead, usable area, Site 2 timing, space allocation, workstation density, rent, CAM, escalation, fit-out cost, furniture/IT/access-control cost, landlord contributions, management and incentive fees, landlord revenue share, salaries, payroll burden, facility costs, inflation, depreciation life, debt funding share, interest rate, amortization term, tax rate, DSO/DPO, security deposits, initial equity, and expansion-gate thresholds.
⚙️ Operating and financial calculation engines
The Site & Space Program converts usable square feet into hot-desk, dedicated-desk, private-office, team-suite, meeting-room, and common/support areas, then derives workstation and meeting-room capacity.
The Capacity & Utilization, Acquisition Funnel, and Membership & Churn schedules create a monthly operating bridge. The member engine uses product-level opening members + new members – churn = closing members, with capacity controls feeding the occupancy view.
The Pricing & Membership Revenue and Meeting & Ancillary Revenue schedules convert occupied capacity into recurring membership revenue plus virtual-office, meeting-room, event, printing, locker, food/beverage, mail, and other ancillary economics represented in the model.
The Deal Structures schedule compares three operating structures. Fixed Lease retains center revenue while the operator bears rent/CAM and fit-out. Management Agreement models management and incentive fees with an asset-light sample operator CapEx profile. Revenue Share retains center revenue while sharing revenue and fit-out economics with the landlord.
The Staffing & Payroll, Operating Expenses, CapEx & Depreciation, and Debt & Funding schedules connect labor capacity, facility costs, central overhead, fit-out, PPE, debt draws, amortization, interest, and DSCR into the financial statements.
📑 Workbook architecture – 25 worksheets
- 00 Cover & Navigation – model promise, workflow, horizon, active controls, color convention, and navigation index.
- 01 Executive Dashboard – headline revenue, EBITDA, margin, cash, occupancy, break-even, expansion decision, revenue mix, and operating charts.
- 02 Scenario Control – active scenario and deal-structure selectors with an at-a-glance explanation of each case.
- 03 Assumptions – centralized editable business inputs and effective scenario values.
- 04 Site & Space Program – site area allocation, density, workstation capacity, meeting rooms, and opening timing.
- 05-07 Operating Drivers – monthly capacity/utilization, acquisition funnel, and product-level membership/churn roll-forwards.
- 08-10 Revenue & Deal Economics – membership pricing, recurring revenue, meeting/ancillary revenue, and fixed-lease/management/revenue-share economics.
- 11-14 Cost, CapEx & Funding – staffing, payroll, operating expenses, CapEx, depreciation, debt, amortization, interest, and DSCR.
- 15 Expansion Analysis – six-month occupancy and EBITDA-margin gates, pre-expansion cash, pro-forma post-funding cash, Site 2 stabilized economics, payback, and proceed/hold decision.
- 16 Profit & Loss – five annual years of selected-structure operating results.
- 17 Balance Sheet – cash, receivables, deposits, PPE, payables, debt, equity, and an explicit balance check.
- 18 Cash Flow – monthly EBITDA-to-cash bridge, NOL schedule, working capital, deposits, CapEx, debt, equity funding, and ending liquidity.
- 19 Break-Even & Unit Economics – weighted pricing, revenue per occupied workstation, churn, annualized gross retention, CAC, indicative LTV, LTV/CAC, and break-even occupancy by structure.
- 20 Scenario Comparison – Downside/Base/Upside operating assumptions and exact active full-model outputs.
- 21 Sensitivity Analysis – four two-variable decision grids.
- 22 Deal Structure Dashboard – operator and landlord comparison across Fixed Lease, Management Agreement, and Revenue Share.
- 23 Audit & Integrity – independent allocation, roll-forward, balance, bounds, liquidity, selector, and expansion checks.
- 24 Methodology & Guide – model logic, workflow, operating methodology, market-source references, and color conventions.
🔄 Scenarios and sensitivities
The model includes Downside, Base, and Upside scenarios covering demand, pricing, retention, utilization, and cost pressure. It also includes four explicit two-variable sensitivities: Year 5 EBITDA vs occupancy/pricing, Year 5 EBITDA vs churn/acquisition, Year 5 EBITDA vs rent/occupancy, and Year 5 ending cash vs Site 2 fit-out/opening utilization. These tools let users identify which assumptions matter most before committing capital.
📊 Decision dashboards and KPIs
The Executive Dashboard combines Year 1 and Year 5 operator revenue, Year 5 EBITDA and margin, ending cash, recent six-month occupancy, selected break-even occupancy, expansion decision, revenue composition, annual operator EBITDA trend, monthly workspace occupancy, and cash balance. A separate Deal Structure Dashboard compares Year 5 operator EBITDA, five-year cumulative operator EBITDA, landlord NOI/rent, operator CapEx, break-even occupancy, and EBITDA-to-operator-CapEx economics across the three structures.
✅ Practical use cases
- 📌 Business planning: build an integrated five-year operating and financial plan for a new or existing coworking center.
- 📈 Forecasting: model 60 monthly periods of demand, members, capacity, revenue, expenses, debt, and cash.
- 💰 Profitability analysis: understand EBITDA, margins, site costs, contribution economics, and break-even occupancy.
- 💵 Cash-flow planning: evaluate working capital, fit-out, debt service, equity funding, minimum cash, and ending liquidity.
- 🏷️ Pricing strategy: test membership pricing, annual price escalation, meeting-room rates, and ancillary revenue assumptions.
- 🪑 Space-mix planning: compare workstation capacity created by hot desks, dedicated desks, private offices, and team suites.
- 🔁 Retention management: quantify the impact of member churn, product mix, acquisition efficiency, CAC, LTV, and LTV/CAC.
- 🏢 Deal-structure evaluation: compare Fixed Lease, Management Agreement, and Revenue Share operator/landlord economics.
- 🧪 Scenario planning: switch between Downside, Base, and Upside operating conditions.
- 🎛️ Sensitivity analysis: identify exposure to occupancy, pricing, churn, acquisition, rent, fit-out, and opening utilization.
- 🚀 Expansion analysis: test whether Site 2 clears occupancy, EBITDA-margin, cash, and post-funding gates before opening.
- 🏦 Funding review: evaluate operator CapEx, debt draws, interest, repayment, DSCR, and equity needs.
👥 Intended users
The model is suitable for independent coworking operators, flexible-office entrepreneurs, franchisees, landlords evaluating flex-space structures, multi-location operators, lenders, investors, business-plan consultants, financial advisers, and analysts who need an editable model that links physical workspace decisions to financial outcomes.
📦 Delivered files
The premium package includes the editable Excel financial model, a 25-page full-workbook PDF preview with one worksheet per page, and a curated set of high-resolution buyer-facing PNG screenshots for marketplace presentation. The Excel file contains fictional sample data so every schedule, scenario, sensitivity, chart, and dashboard is demonstrable immediately and can then be replaced with project-specific assumptions.
Similar ProductsOther customers were also interested in...



 eFinancialModels
Electric Vehicle (EV) Charging Station Financial M...
With this comprehensive 5- or 10-year monthly tool, investors can assess the viability of setting up... Read more

Financial Model for Mobile App | Mobile App Busine...
The Mobile App Financial Plan Template in Excel allows you to develop financial projections when lau... Read more

 HenrySheykin
Food Truck Financial Model Excel Template
The Food Truck Financial Model helps entrepreneurs, founders, business owners, consultants, and anal... Read more

Green Hydrogen Production from Wind Energy Financi...
The Green Hydrogen from Wind Financial Model aims to comprehensively forecast a horizon of 40 years ... Read more

Simple Mutual Non-Disclosure Agreement Template
Protect your business secrets with ease using our Simple Mutual Non-Disclosure Agreement Template. S... Read more

Solar Energy Financial Model
The Solar Energy Financial Model Spreadsheet Template in Excel assists you in preparing a sophistica... Read more

 Peter Graf
The Customer-Centric Financial Model for Restauran...
Starting a restaurant without a financial plan is like driving a car blindfolded. You wouldn´t do i... Read more
You must log in to submit a review.