
0 ITEMS

Investment Holding Company NAV, Liquidity, Capital Allocation & Distribution Financial Model – 5-Year Forecast
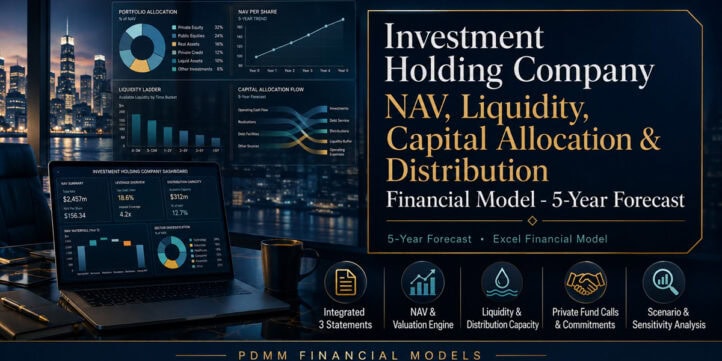
🧭 Investment Holding Company NAV, Liquidity, Capital Allocation & Distribution Financial Model – 5-Year Forecast Managing an investment holding company is not just a question of whether portfolio value is rising. The harder question is whether the company can fund commitments, protect liquidity, manage leverage, rebalance capital and make shareholder distributions without weakening long-term NAV. This fully editable Excel model is designed around that decision problem.


🧭 Investment Holding Company NAV, Liquidity, Capital Allocation & Distribution Financial Model – 5-Year Forecast
Managing an investment holding company is not just a question of whether portfolio value is rising. The harder question is whether the company can fund commitments, protect liquidity, manage leverage, rebalance capital and make shareholder distributions without weakening long-term NAV. This fully editable Excel model is designed around that decision problem.
The workbook combines a 60-month forecast with annual five-year summaries, integrated financial statements and investment-specific schedules. It is built for owner-managed investment holding companies, entrepreneur investment vehicles, family investment companies and small family-office style structures investing their own capital across direct/private holdings, public securities, fixed income, funds and cash.
🎯 What this model helps you decide
Use the model to answer practical capital-allocation questions such as:
- How much cash should be retained before making new investments or distributions?
- Can projected private-fund capital calls be funded without breaching the minimum cash reserve?
- When should excess cash be used for public-market reinvestment, debt repayment or shareholder distributions?
- How do direct-holding growth and valuation-multiple changes affect five-year NAV?
- How much liquidity is actually available after conservative haircuts rather than simply looking at accounting NAV?
- What happens to debt, gross LTV and liquidity coverage under Downside, Base and Upside cases?
- Which holdings create the greatest concentration exposure?
- How sensitive are NAV, distribution capacity, financing cost and exit proceeds to key assumptions?
📊 Verified model coverage
The final workbook contains 20 worksheets and a 60-month forecast from January 2027 through December 2031, supported by five annual summaries. It includes fully integrated Profit & Loss, Balance Sheet and Cash Flow statements plus dedicated schedules for direct holdings, public investments, private funds, debt, NAV, liquidity, capital allocation, scenarios, sensitivities and risk.
The sample case begins with 10 direct/private holdings, 6 public/liquid investment sleeves and 4 private funds. All sample names and values are illustrative and editable.
Direct/private holdings engine
Model each holding with opening fair value, memo ownership percentage, base value growth, dividend yield, annual follow-on investment, planned exit month, exit premium or discount, and an opening-to-target valuation-multiple path. The monthly engine calculates closing fair value, dividend income, follow-on capital, exit proceeds, realized gains/losses and unrealized gains/losses. Scenario growth multipliers and valuation drift flow through the holding values automatically.
Public and liquid portfolio
The public-asset schedule separates cash yield from unrealized market return and supports editable purchase allocation weights. When liquidity is tight, the cash waterfall can use conservative liquid-public-asset sale proceeds rather than allowing cash to become artificially negative. Liquid values are haircut for liquidity planning and tied into the risk analysis.
Private funds and capital calls
Track total commitments, opening NAV, opening unfunded commitments, annual call rates, distribution yields, return assumptions, contributed capital, capital calls, distributions, NAV movement and remaining unfunded commitments. Distributions are treated as transfers from fund NAV to cash rather than being double-counted as incremental return.
💧 Liquidity and distribution capacity
A key differentiator is the liquidity decision engine. It compares cash, haircutted public investments and remaining revolver capacity against annual obligations including operating costs, interest, private-fund calls, direct follow-ons, scheduled amortization and target distributions.
The model calculates liquidity coverage, minimum cash reserve requirements and an indicative shareholder distribution capacity that excludes new borrowing. This provides a more decision-useful answer than simply treating NAV as immediately distributable cash.
🏦 Capital allocation and leverage
The monthly waterfall prioritizes cash protection and mandatory uses before discretionary deployment. It incorporates operating costs, taxes, direct follow-ons, fund capital calls, scheduled debt amortization, interest, revolver draws, liquid asset sales, optional revolver repayment, optional term-debt repayment, discretionary public investment and shareholder distributions.
The debt schedule tracks term debt, revolver movements, interest expense, gross debt, gross LTV and remaining revolver capacity.
📈 Executive dashboard and KPIs
The dashboard gives a compact decision view with verified KPIs including:
- Ending NAV and five-year NAV CAGR
- Cash balance
- Liquidity coverage ratio
- Gross LTV
- Distribution capacity excluding new borrowing
- Unfunded commitments
- Top-three portfolio concentration
- Action-oriented concentration/liquidity/leverage commentary
Six native Excel charts support decision-making: NAV vs Gross Debt, Available Liquidity vs Annual Obligations, 2031 Asset Mix, Scenario NAV Comparison, Concentration Trend and the 2031 Liquidity Ladder.
🔀 Scenarios and sensitivities
Select Downside, Base or Upside from the scenario control. The selected case drives private-holding growth, public returns, private-fund returns, dividends, valuation drift, capital calls, exit timing, interest rates, distribution targets, minimum cash reserve policy, reinvestment and debt-paydown priorities.
A separate scenario comparison provides an independent five-year strategic view across all three cases.
The Sensitivity Analysis sheet contains four decision matrices:
- Year-5 NAV: private growth multiplier × annual valuation drift
- Year-1 distribution capacity: capital-call stress × minimum cash reserve
- Annual interest expense: gross debt × interest rate
- Cumulative exit proceeds by month 36: exit timing shift × exit premium adjustment
✅ Practical use cases
- Five-year planning: build a coherent monthly and annual forecast for an investment holding company.
- Financial forecasting: project investment income, gains/losses, operating costs, taxes, debt service and net income.
- Profitability analysis: understand how dividends, public returns, realized exits and fair-value changes drive earnings.
- Cash-flow planning: anticipate capital calls, follow-ons, debt service, asset sales, distributions and ending cash.
- Capital allocation: compare reinvestment, debt repayment, new public purchases and shareholder distributions within one waterfall.
- Scenario planning: test Downside, Base and Upside assumptions without rewriting formulas.
- Sensitivity analysis: isolate the effect of growth, valuation drift, call stress, reserve policy, rates, debt and exit timing.
- Operational governance: use minimum cash, commitment and leverage rules to support investment-committee or owner decisions.
- Portfolio-risk monitoring: track largest-holding, top-three concentration, illiquid assets, liquid assets and unfunded commitments relative to NAV.
- Valuation planning: roll forward direct-holding values using operating growth plus opening-to-target valuation-multiple re-rating.
- Distribution planning: estimate affordable shareholder distributions after required uses and liquidity protection.
- Financing decisions: assess revolver utilization, optional debt repayment, interest cost and gross LTV over time.
🗂️ Workbook workflow
1. Start with 02 Scenario Control to select the planning case and review scenario multipliers.
2. Update 03 Assumptions & Opening for company-level settings, cash reserve policy, tax, debt and opening position.
3. Replace sample investments in 04-06 with direct holdings, public assets and private funds.
4. Review 07-11 for returns, NAV, liquidity, capital allocation and debt.
5. Review the integrated 12 Profit & Loss, 13 Balance Sheet and 14 Cash Flow.
6. Use 15 Scenario Comparison, 16 Sensitivity Analysis and 17 Concentration & Risk for decision testing.
7. Confirm 18 Audit & Integrity Checks before relying on outputs.
8. Use 19 Methodology & Sources for calculation conventions and workbook methodology.
🧩 Built for editing and handover
Inputs are clearly distinguished from formulas and cross-sheet links. The workbook includes data validation, internal navigation, methodology notes, source references and 22 integrity checks covering balance, cash flow, NAV reconciliation, debt limits, reserve protection, investment balances, commitments and valuation inputs.
The delivered package includes the client-ready Excel workbook, a 20-sheet full preview PDF and selected buyer-facing screenshots. The workbook is designed to replace a collection of disconnected portfolio, cash and distribution spreadsheets with one coherent decision system for NAV growth, liquidity protection and capital allocation.
Similar ProductsOther customers were also interested in...



 eFinancialModels
Electric Vehicle (EV) Charging Station Financial M...
With this comprehensive 5- or 10-year monthly tool, investors can assess the viability of setting up... Read more

Financial Model for Mobile App | Mobile App Busine...
The Mobile App Financial Plan Template in Excel allows you to develop financial projections when lau... Read more

 HenrySheykin
Food Truck Financial Model Excel Template
The Food Truck Financial Model helps entrepreneurs, founders, business owners, consultants, and anal... Read more

Green Hydrogen Production from Wind Energy Financi...
The Green Hydrogen from Wind Financial Model aims to comprehensively forecast a horizon of 40 years ... Read more

Simple Mutual Non-Disclosure Agreement Template
Protect your business secrets with ease using our Simple Mutual Non-Disclosure Agreement Template. S... Read more

Solar Energy Financial Model
The Solar Energy Financial Model Spreadsheet Template in Excel assists you in preparing a sophistica... Read more

 Peter Graf
The Customer-Centric Financial Model for Restauran...
Starting a restaurant without a financial plan is like driving a car blindfolded. You wouldn´t do i... Read more
You must log in to submit a review.