
0 ITEMS

Padel Club Bankability, Court Yield, Pricing & Expansion Financial Model – 10-Year Forecast, Loan DSCR & SWOT
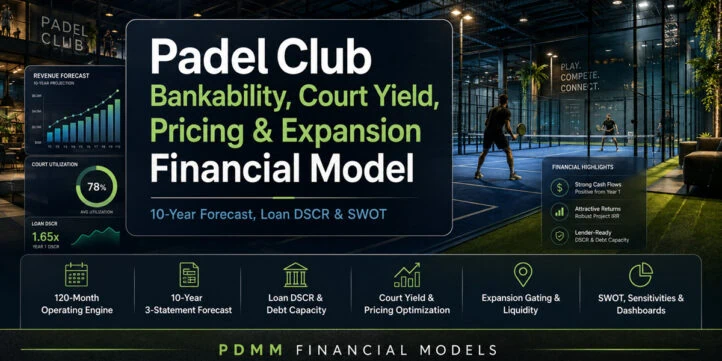
Build a lender-ready and operator-ready view of a padel club with a 120-month operating and financing engine feeding a complete 10-year Income Statement, Balance Sheet and Cash Flow Statement. This premium Excel model is designed for founders, club owners, investors, lenders and advisers who need more than a basic revenue forecast: it connects court-hour capacity, utilization and pricing directly to profitability, cash, DSCR, debt capacity, valuation and expansion decisions. 💡 What decision does this model solve?

🎾 Padel Club Bankability, Court Yield, Pricing & Expansion Financial Model
Build a lender-ready and operator-ready view of a padel club with a 120-month operating and financing engine feeding a complete 10-year Income Statement, Balance Sheet and Cash Flow Statement. This premium Excel model is designed for founders, club owners, investors, lenders and advisers who need more than a basic revenue forecast: it connects court-hour capacity, utilization and pricing directly to profitability, cash, DSCR, debt capacity, valuation and expansion decisions.
💡 What decision does this model solve?
Padel clubs sell time-based capacity. An unused court hour cannot be recovered, while excessive discounts, weak off-peak demand, high rent, construction costs or aggressive debt can quickly weaken returns. The model helps answer practical questions such as: How many courts should be opened? What utilization is required? What should peak, shoulder and off-peak rates be? How much debt can the club safely carry? What cash reserve is needed? When should the next court be added? Does an expansion still work after financing, tax, maintenance and replacement costs?
🧭 Model workflow
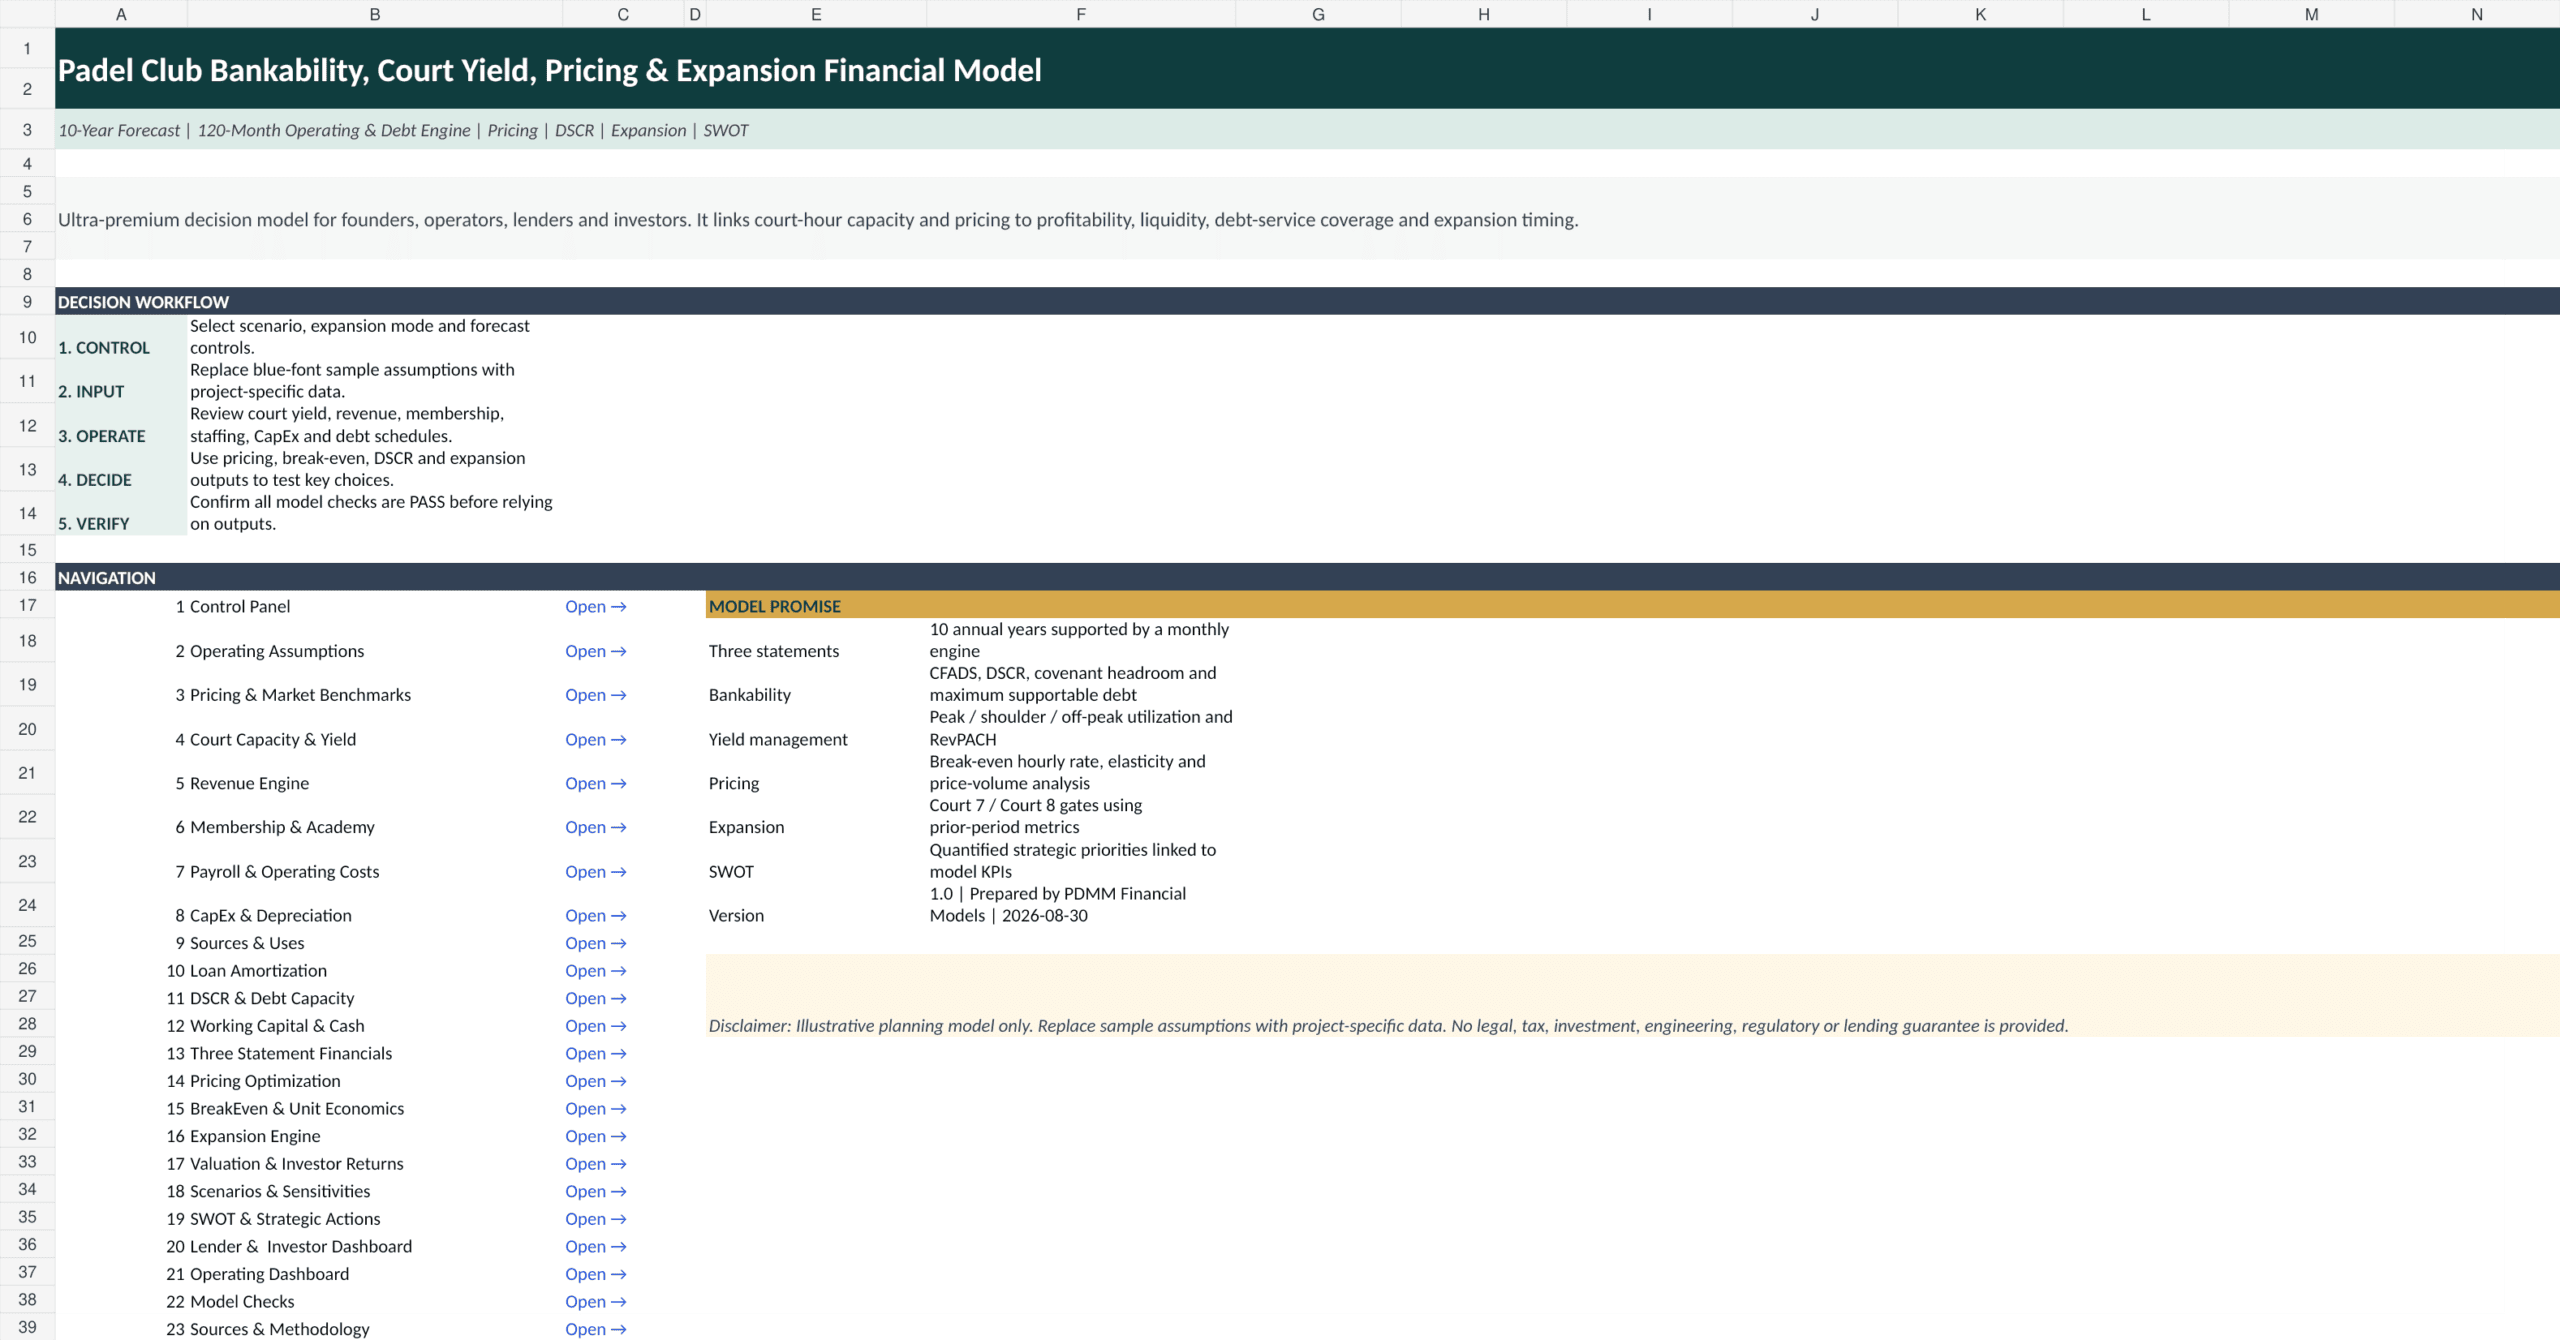
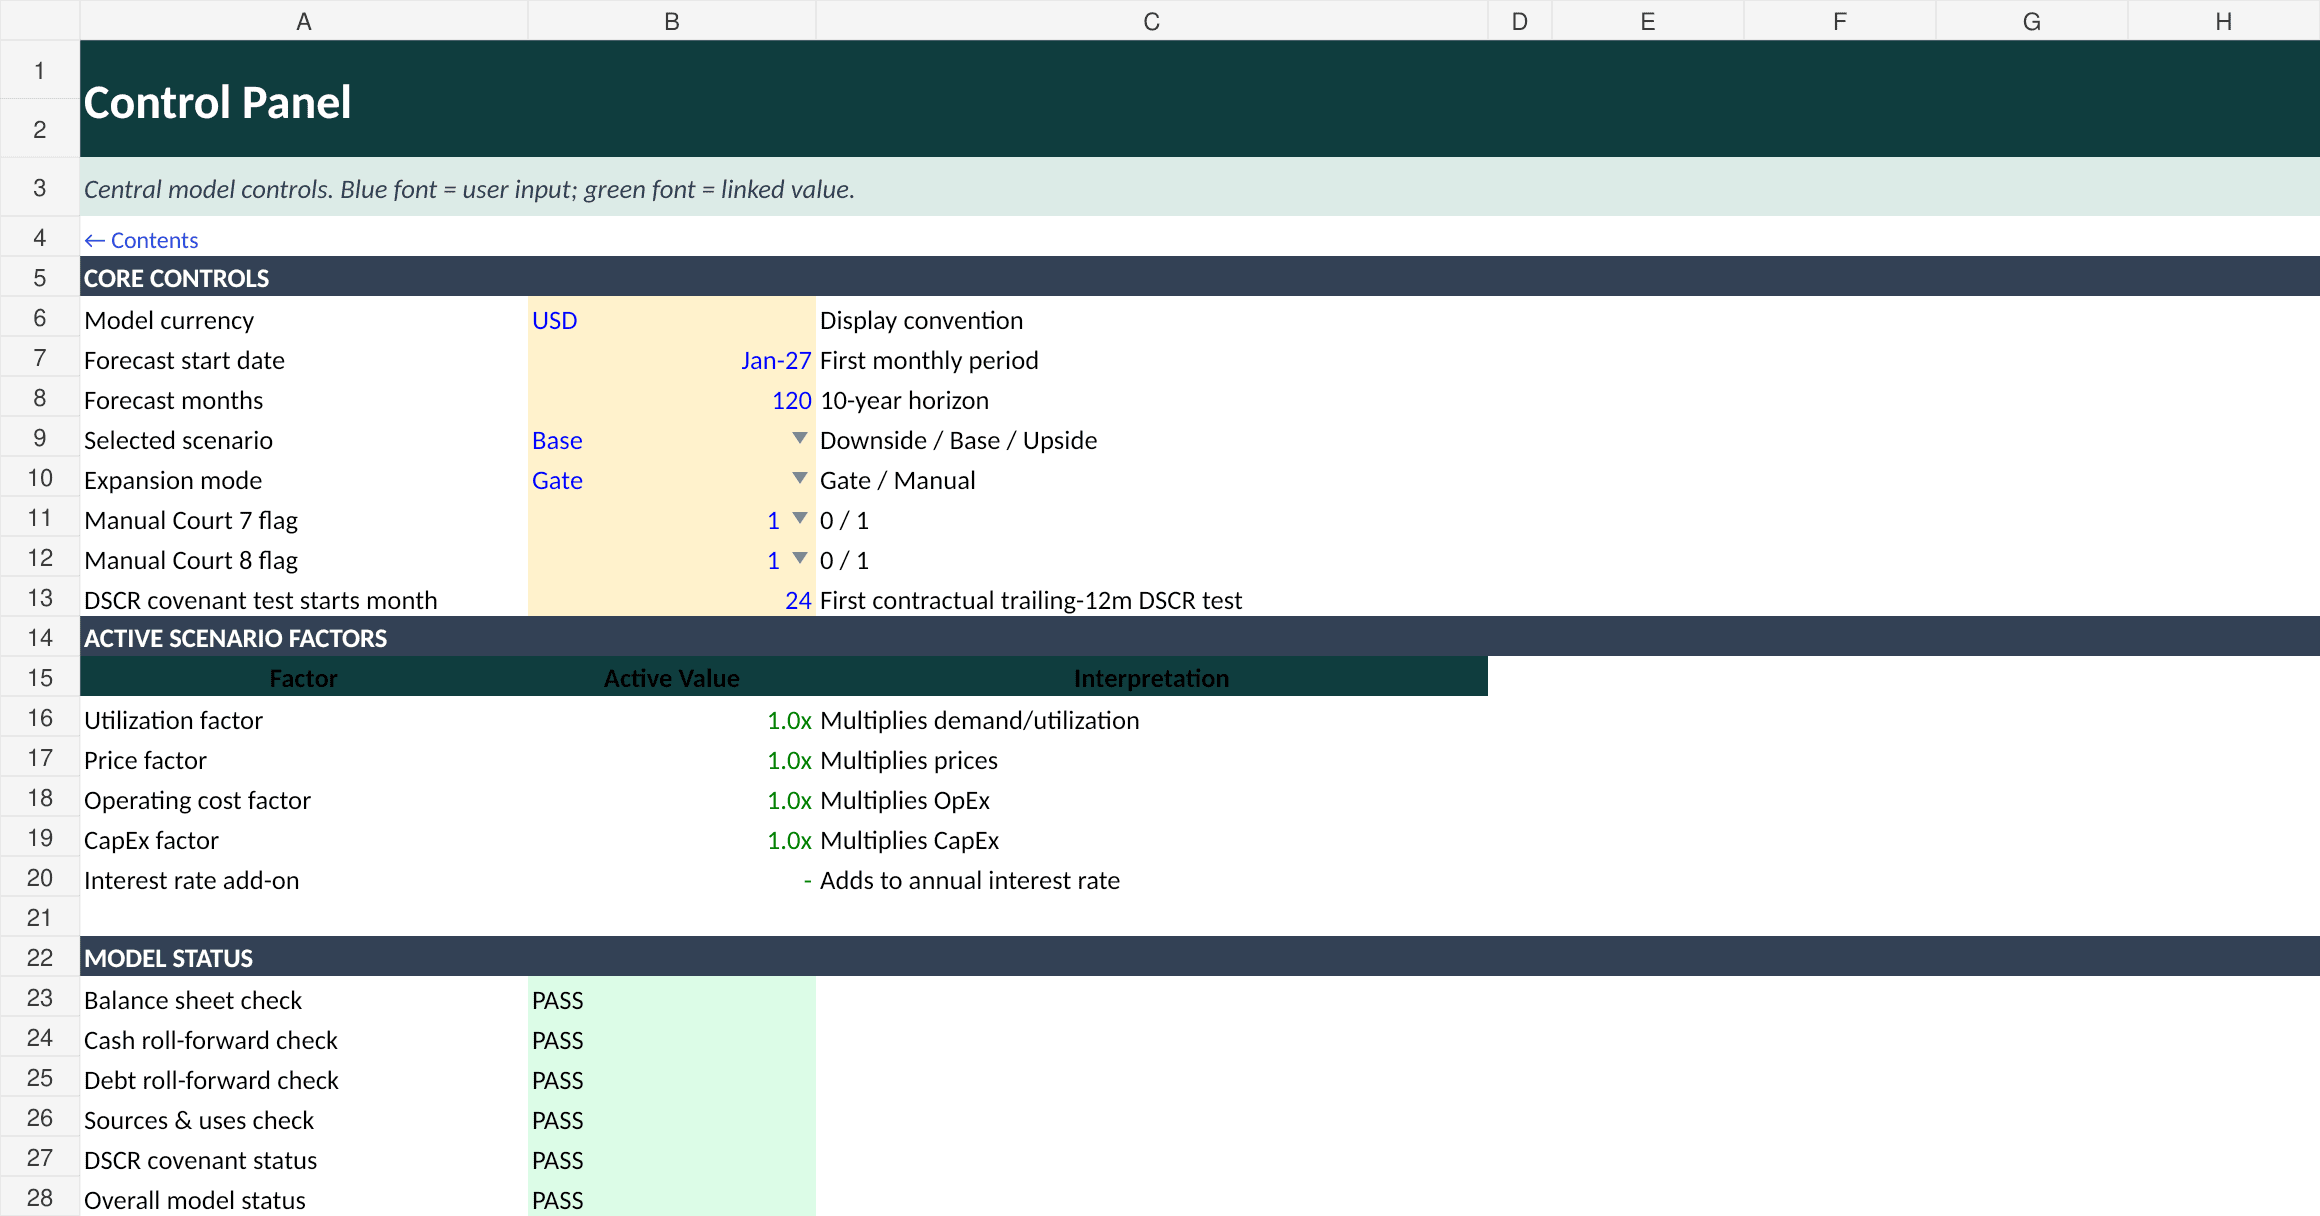
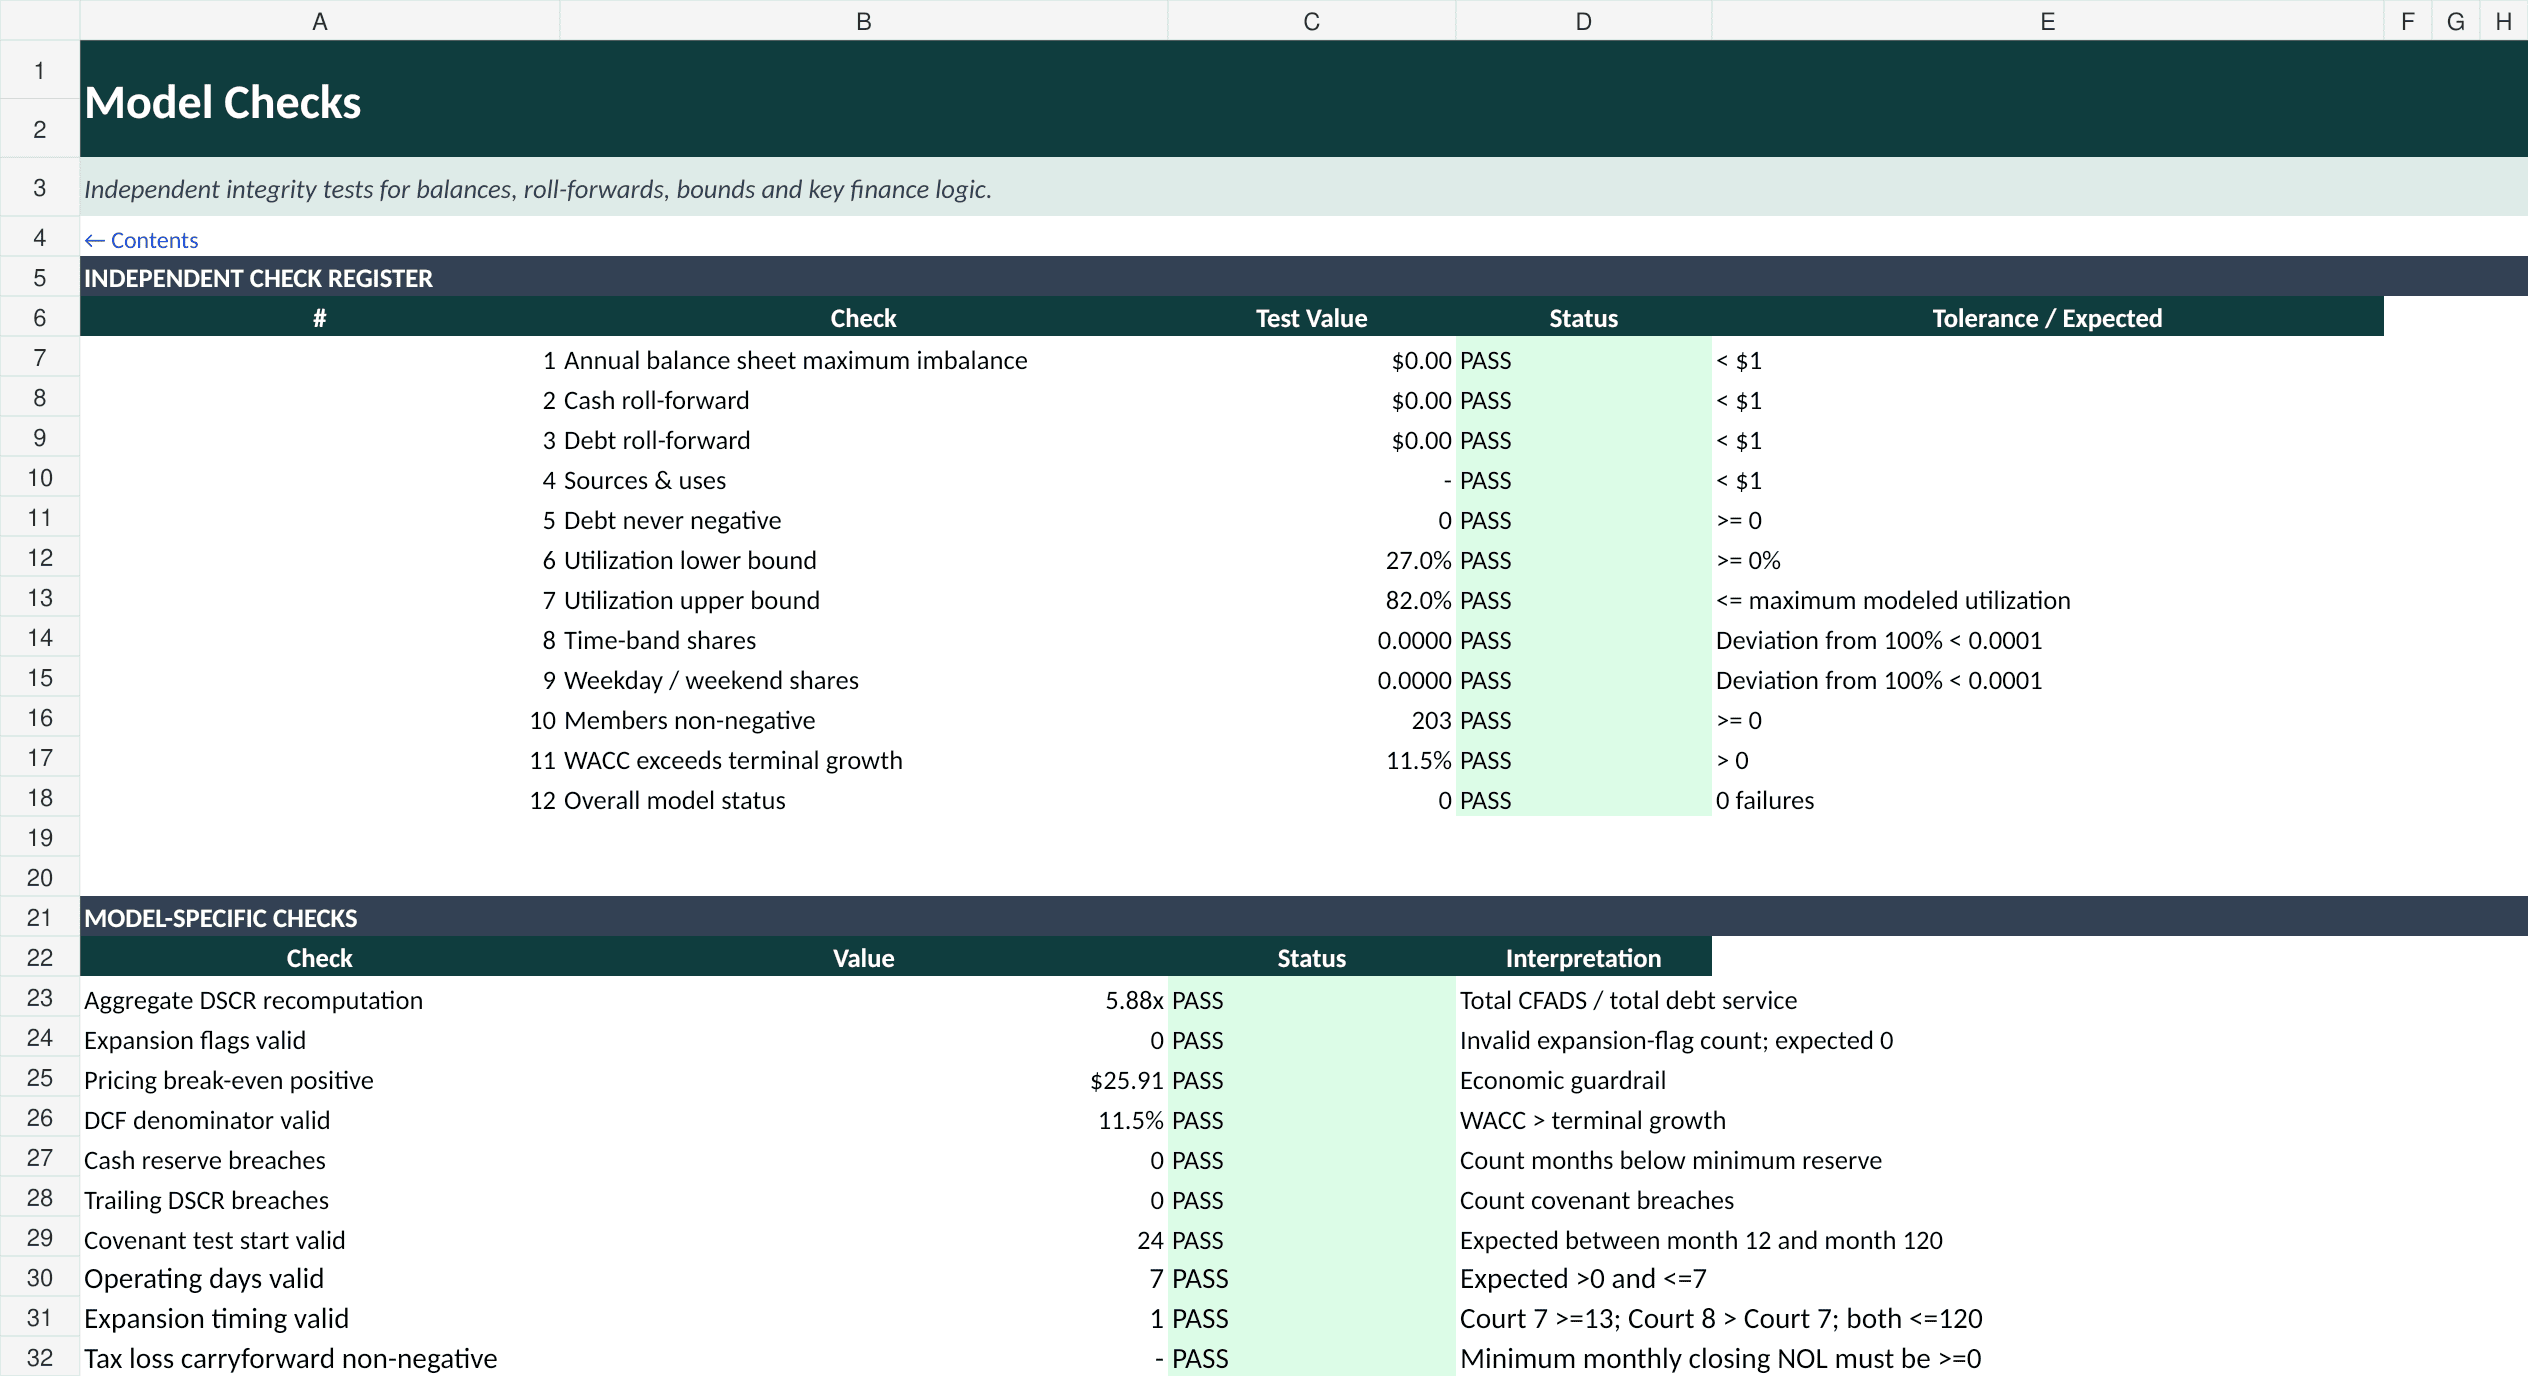
Start on the Cover & Navigation page, move to the Control Panel, select the Base, Downside or Upside case, then replace the blue-font sample inputs in Operating Assumptions. The monthly operating schedules calculate court capacity, bookings, memberships, coaching, ancillary revenue, payroll, OpEx, CapEx, debt service, working capital and cash. Those schedules flow into the 10-year financial statements, lender metrics, pricing tools, valuation, sensitivities, SWOT and executive dashboards. A dedicated Model Checks sheet provides integrity tests before the outputs are used.
✏️ Editable operating and commercial inputs
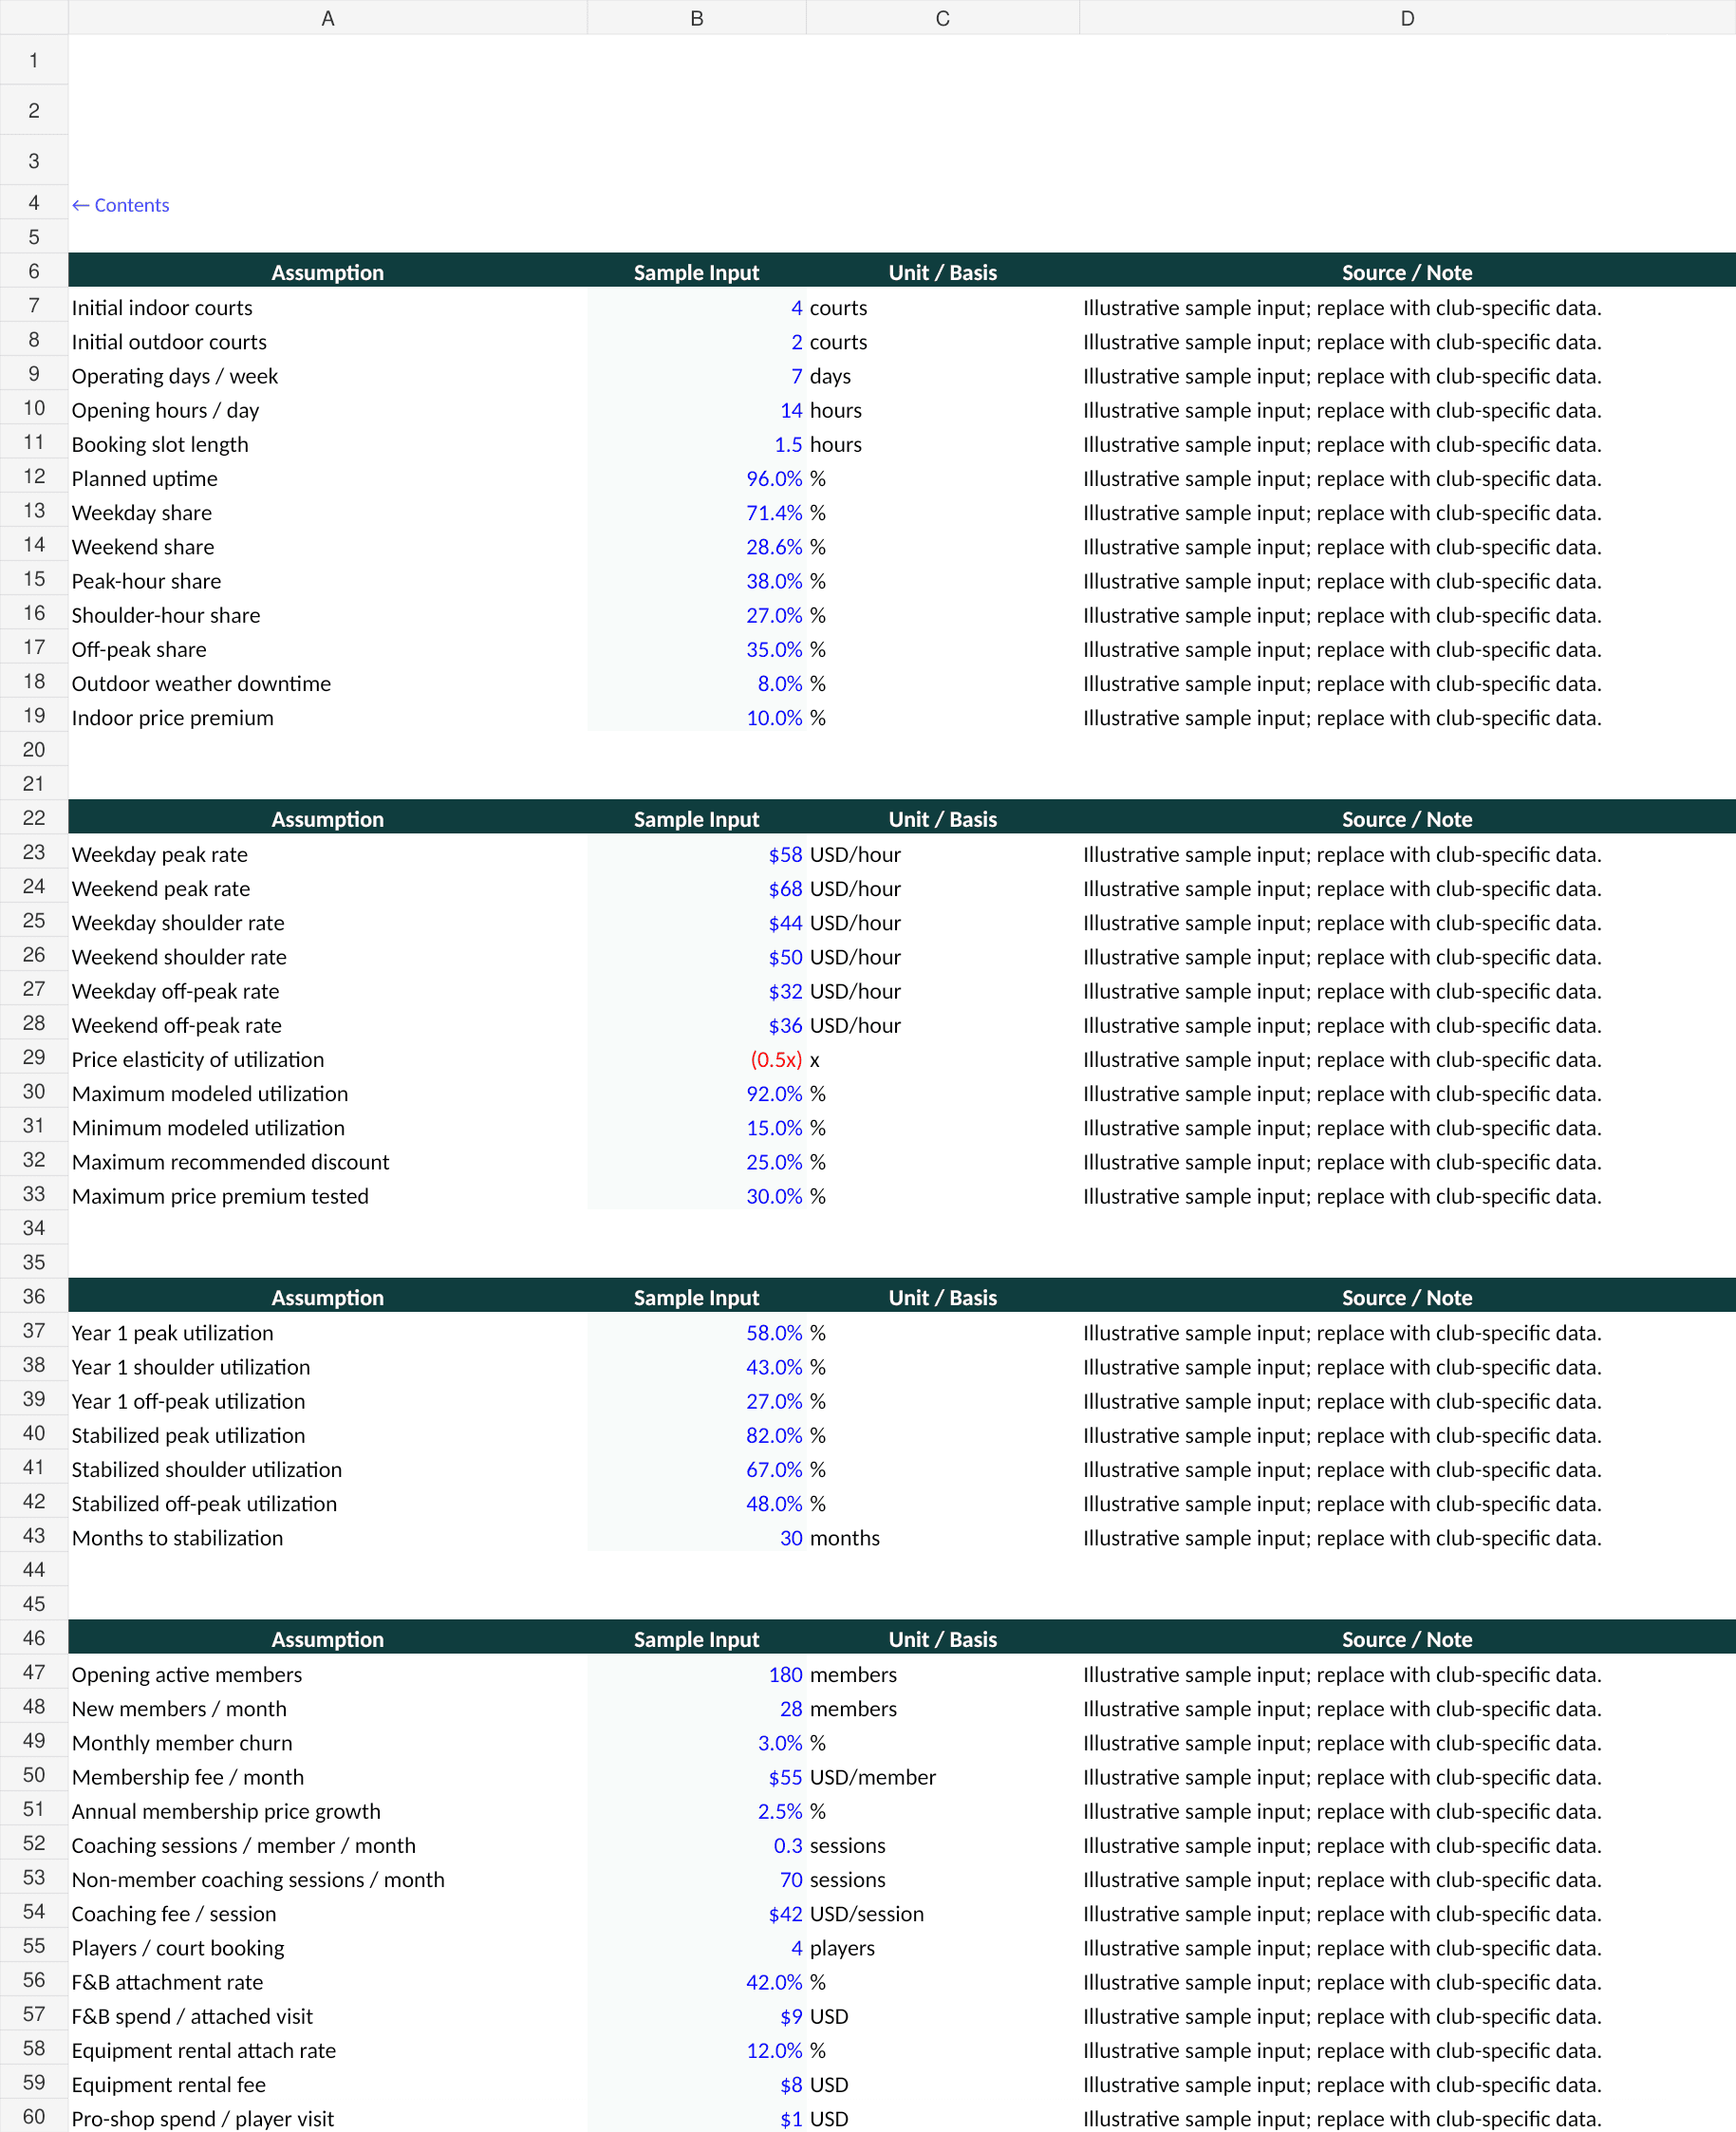
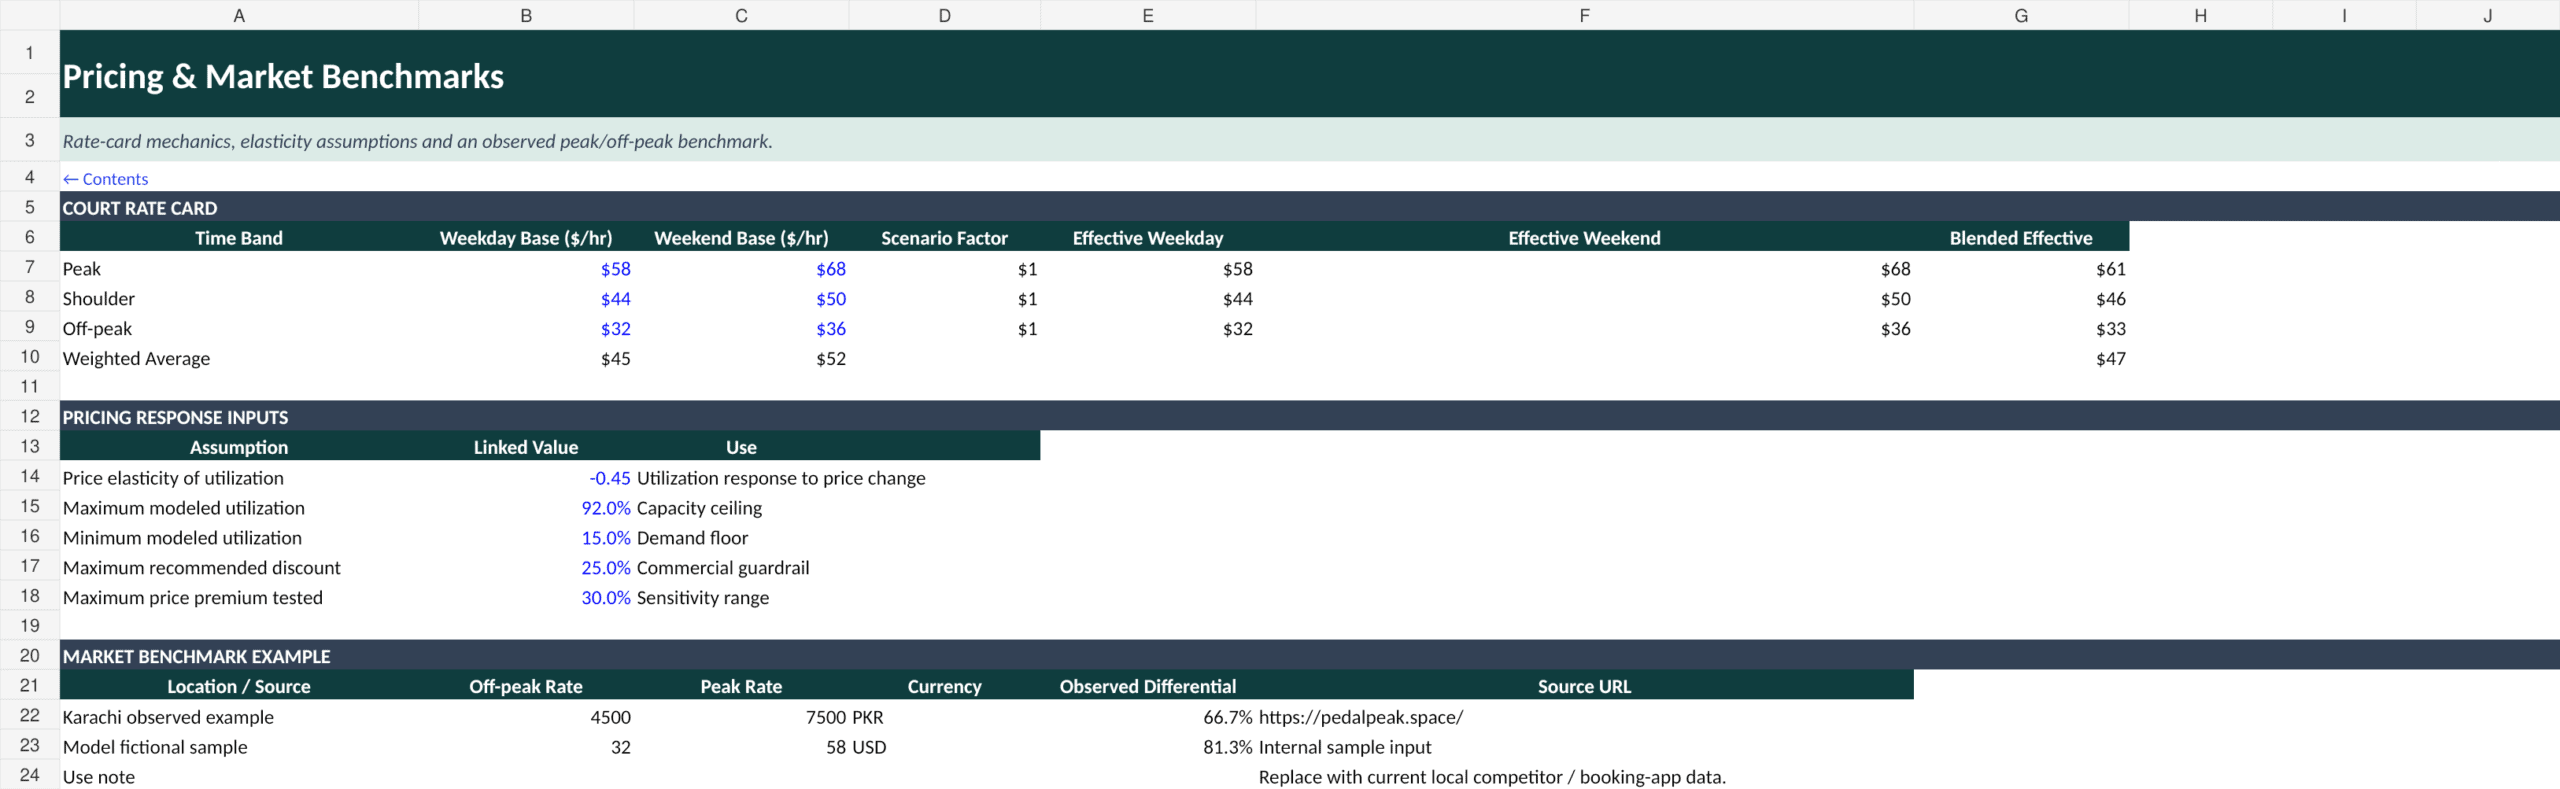
The workbook centralizes editable assumptions for indoor and outdoor courts, operating days, opening hours, booking-slot length, uptime, outdoor weather downtime, weekday/weekend mix, peak/shoulder/off-peak hour shares, court-rate cards, indoor pricing premium, utilization ramp, price elasticity, member acquisition and churn, membership fees, coaching activity, player throughput, F&B attachment, equipment rental, pro-shop spend, events, sponsorship and more. Staffing scaling, salary inflation, rent, utilities, maintenance, insurance, marketing, administration and working-capital assumptions are also editable.
📊 Court capacity, yield and revenue engine
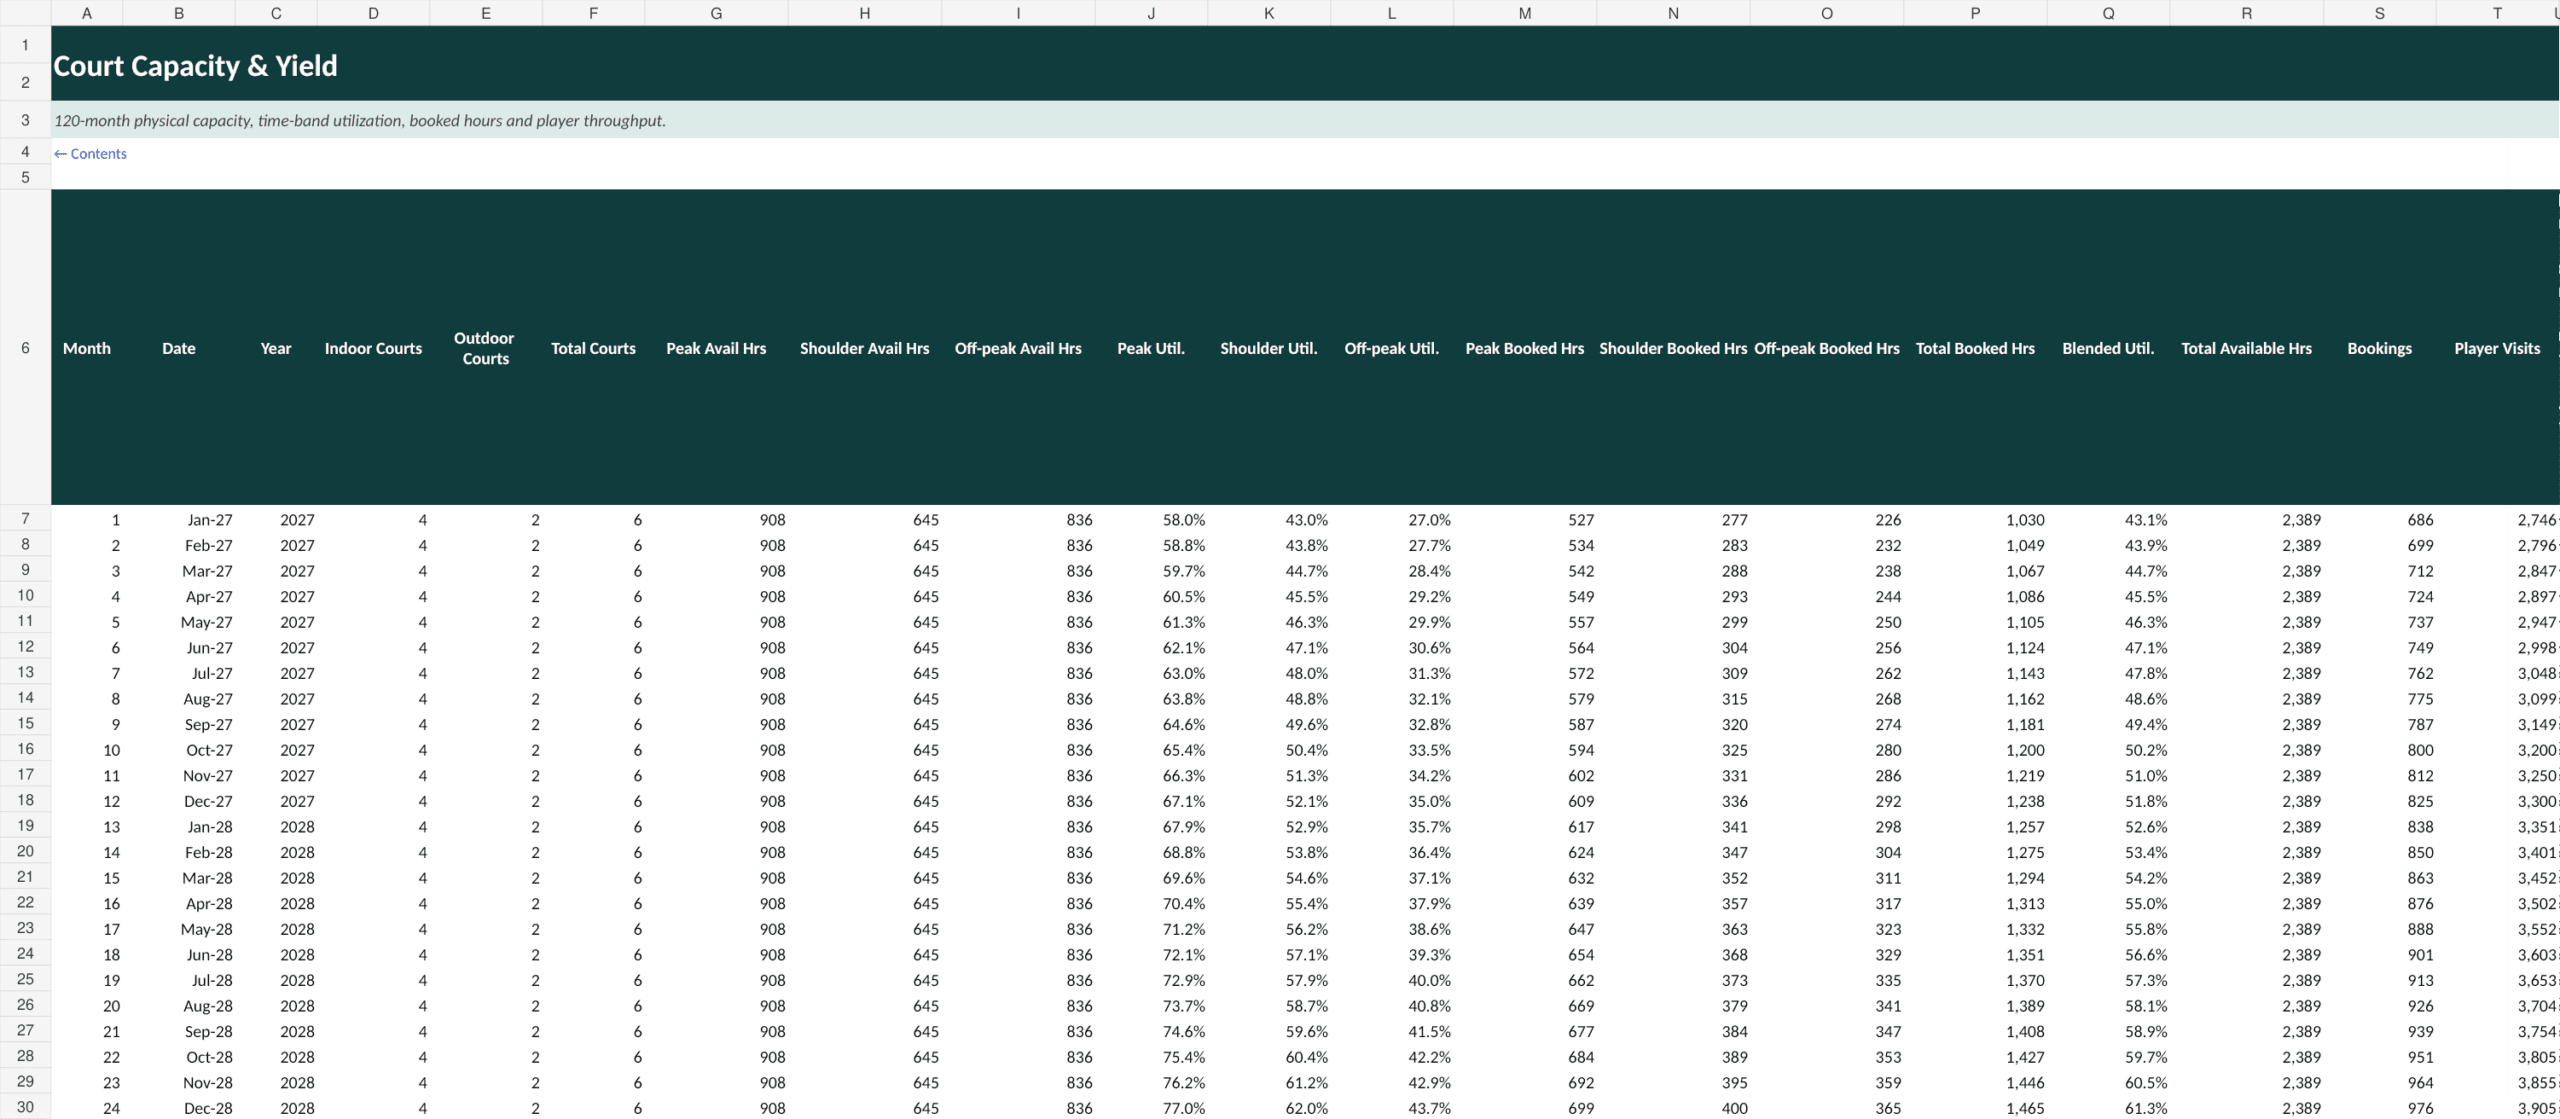
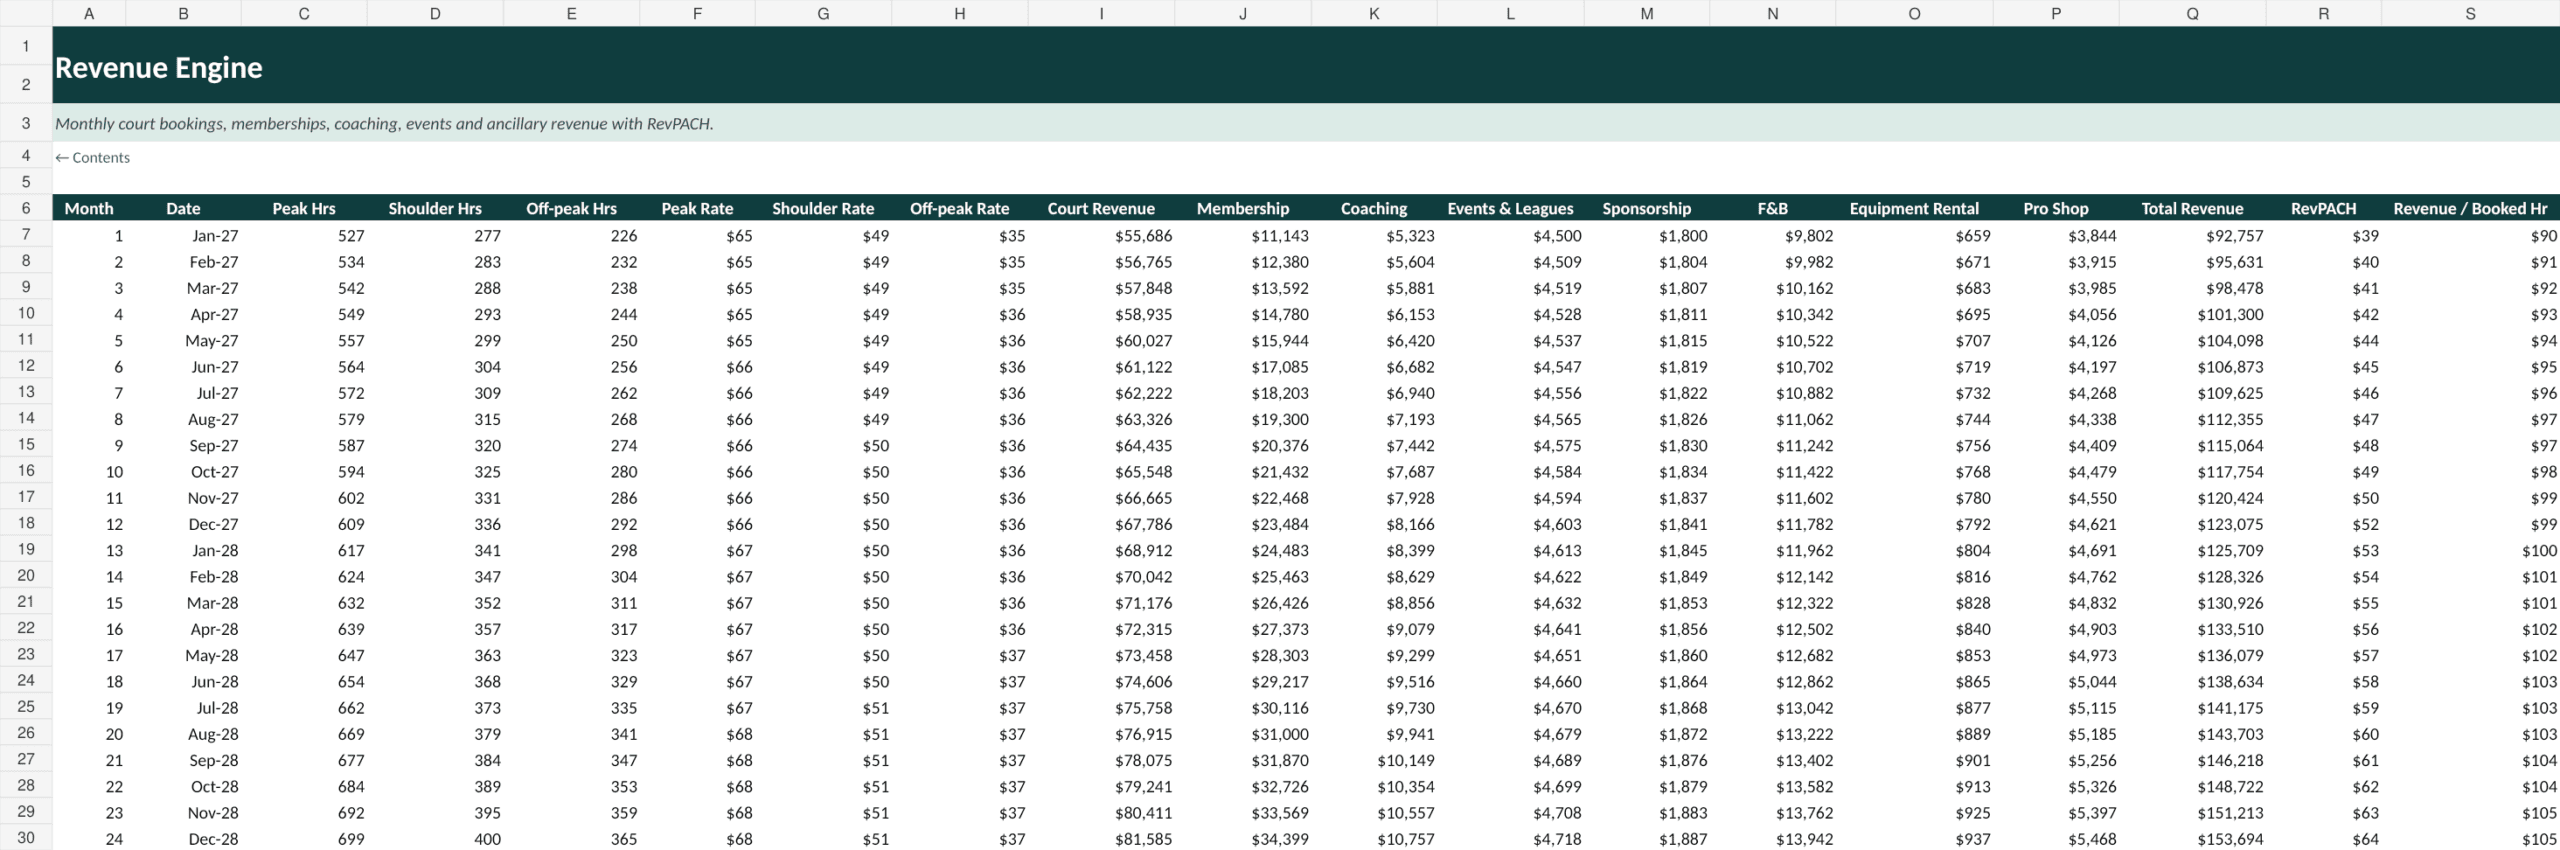
The Court Capacity & Yield schedule converts physical courts into available hours and booked hours across peak, shoulder and off-peak periods. It tracks blended utilization, booking volume and player visits over all 120 months. The Revenue Engine then combines court bookings with memberships, coaching, events/leagues, sponsorship, F&B, equipment rental and pro-shop sales. Core operating KPIs include Revenue per Available Court Hour (RevPACH), revenue per booked court hour, utilization by time band, average court rate and revenue per active member.
💵 Pricing optimization and break-even analysis
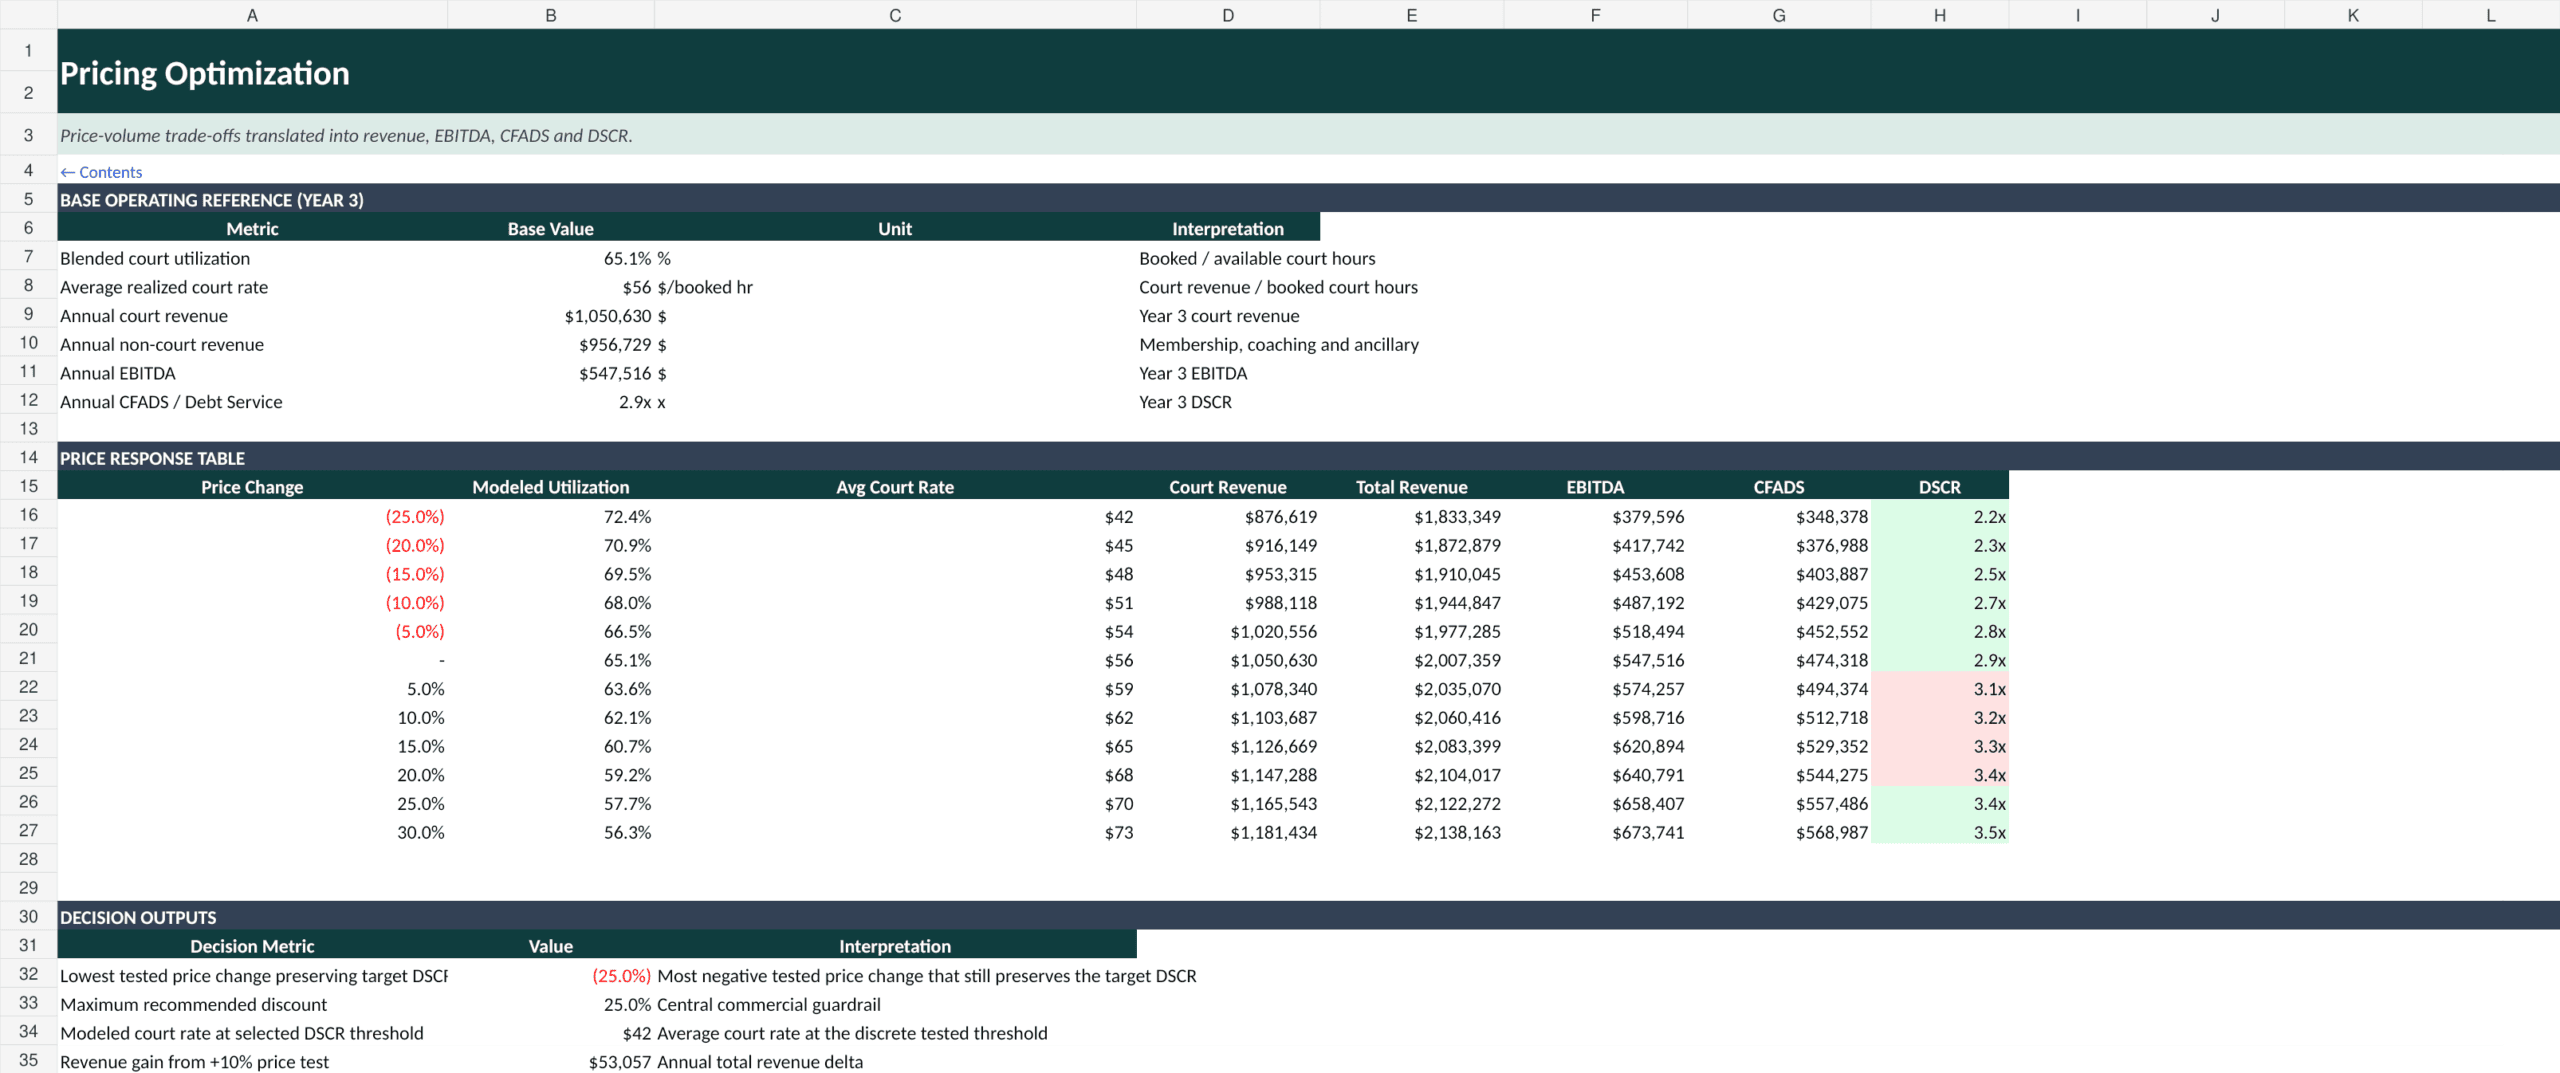
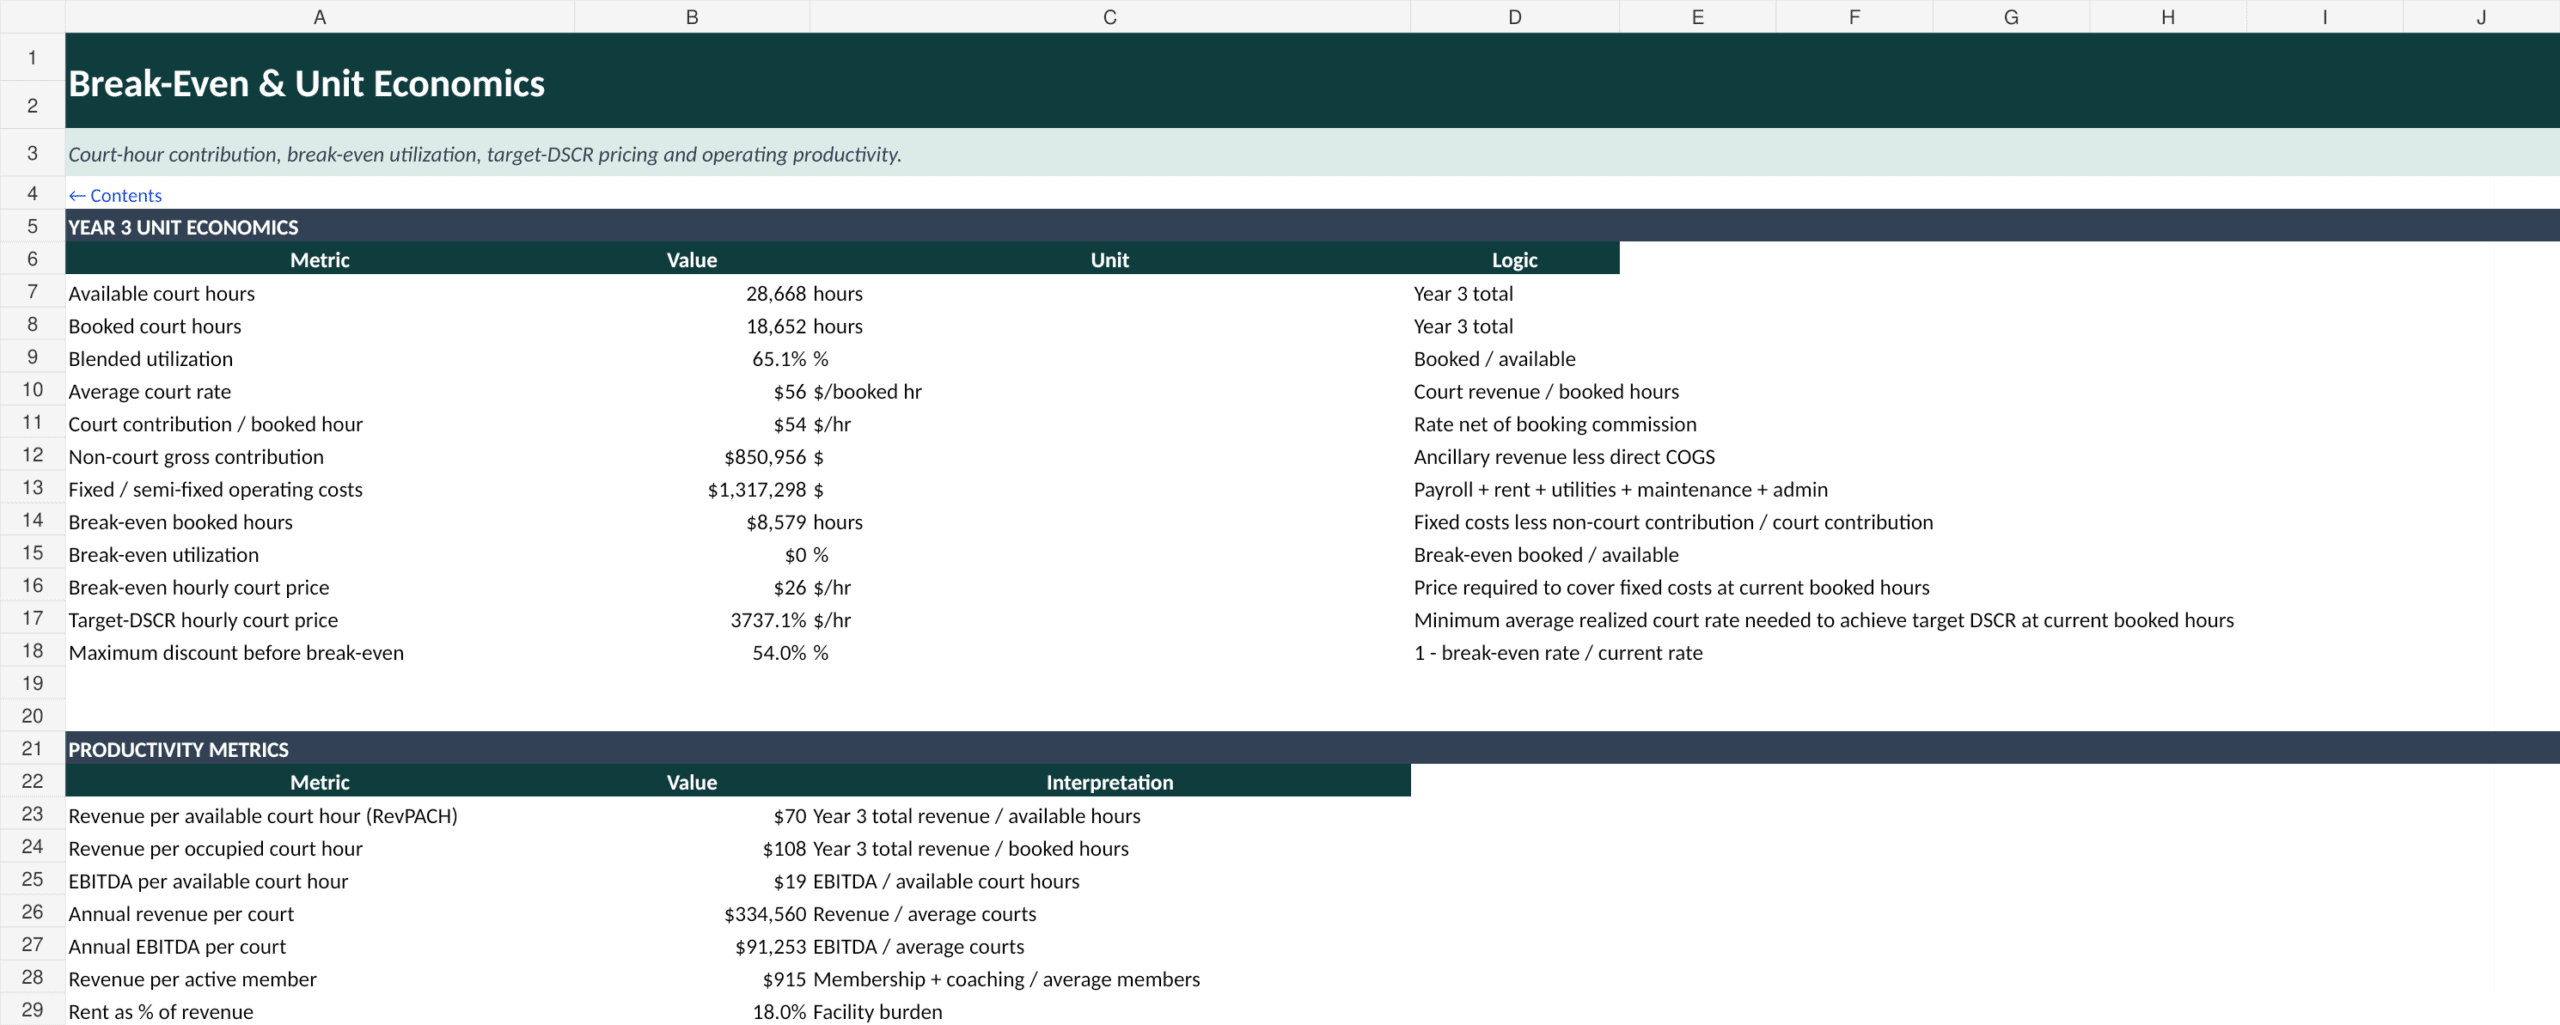
The model includes a dedicated Pricing Optimization module that applies price elasticity to tested price changes and translates the result into utilization, court revenue, EBITDA, CFADS and DSCR. A separate Break-Even & Unit Economics sheet calculates court contribution per booked hour, break-even booked hours, break-even utilization, break-even hourly court price, target-DSCR hourly court price, RevPACH, EBITDA per available court hour, annual revenue/EBITDA per court, revenue per member and rent as a percentage of revenue.
🏦 Loan amortization, CFADS and DSCR
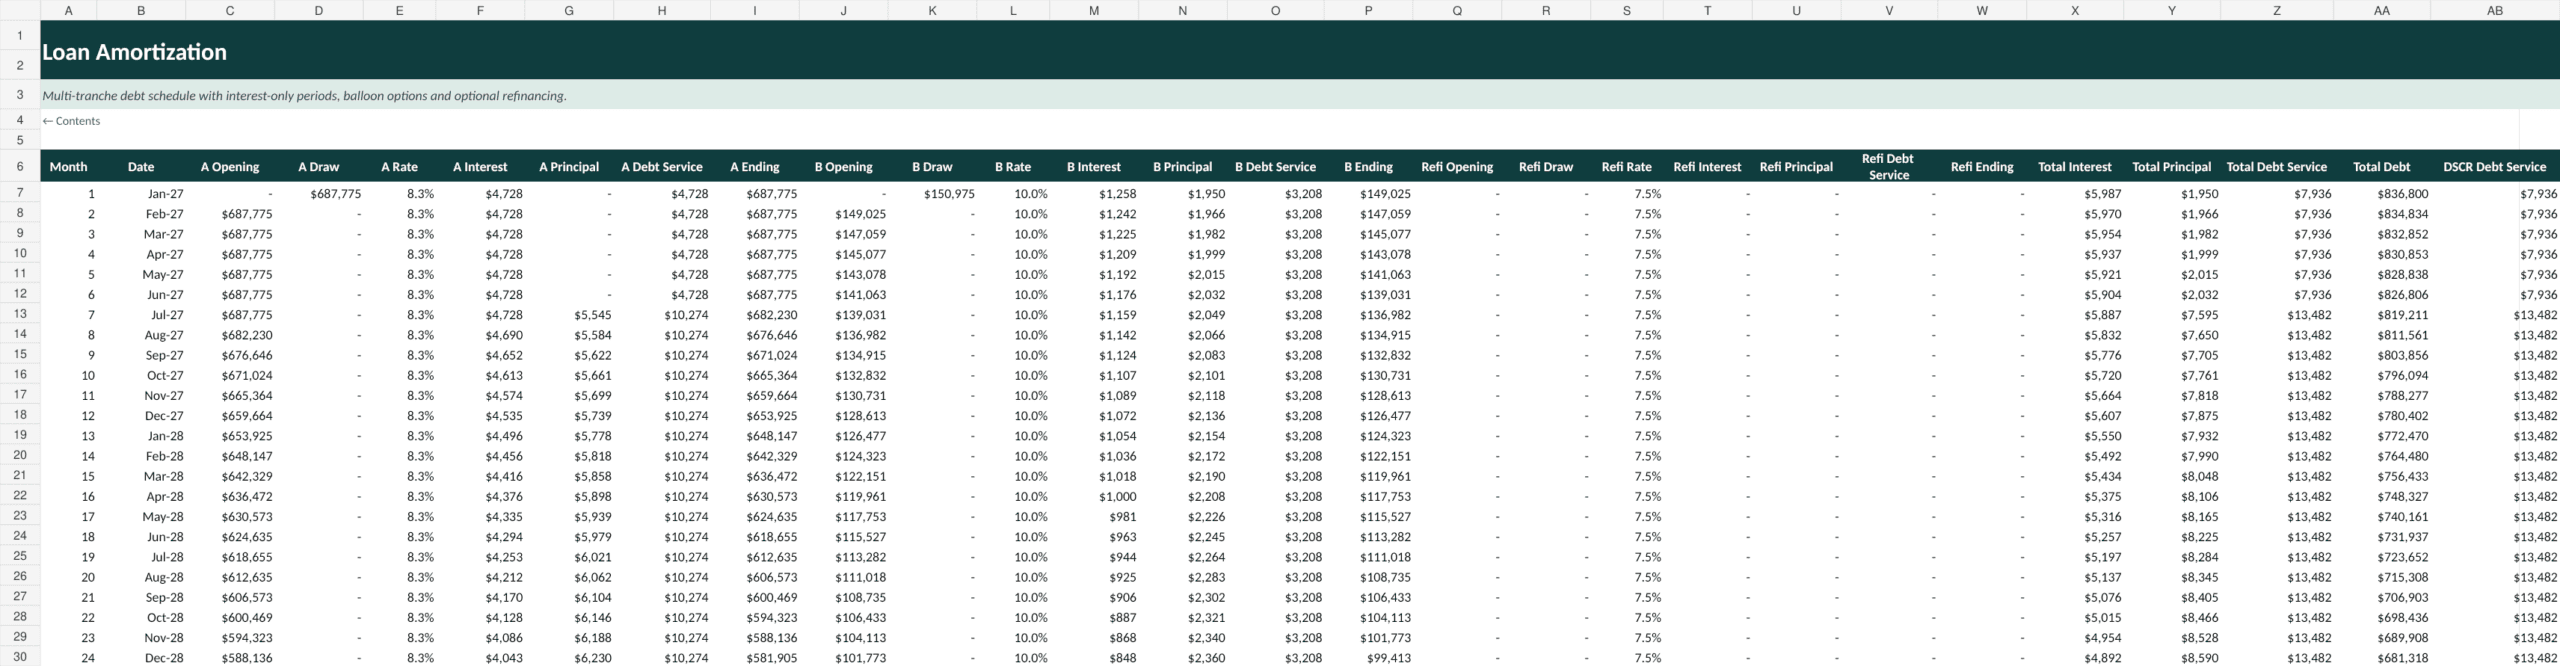
The financing section contains two opening debt tranches with editable interest rates, amortization terms, interest-only periods, upfront fees, balloon assumptions and optional refinancing. The model calculates monthly opening and closing balances, interest, scheduled principal and contractual debt service. The DSCR & Debt Capacity sheet calculates CFADS, monthly coverage, trailing-12-month coverage, covenant headroom, interest coverage, debt/EBITDA, maximum annual and monthly debt service, maximum supportable term debt and debt-capacity headroom. The covenant test start month and target DSCR are editable.
🏗️ CapEx, cash and expansion decisions
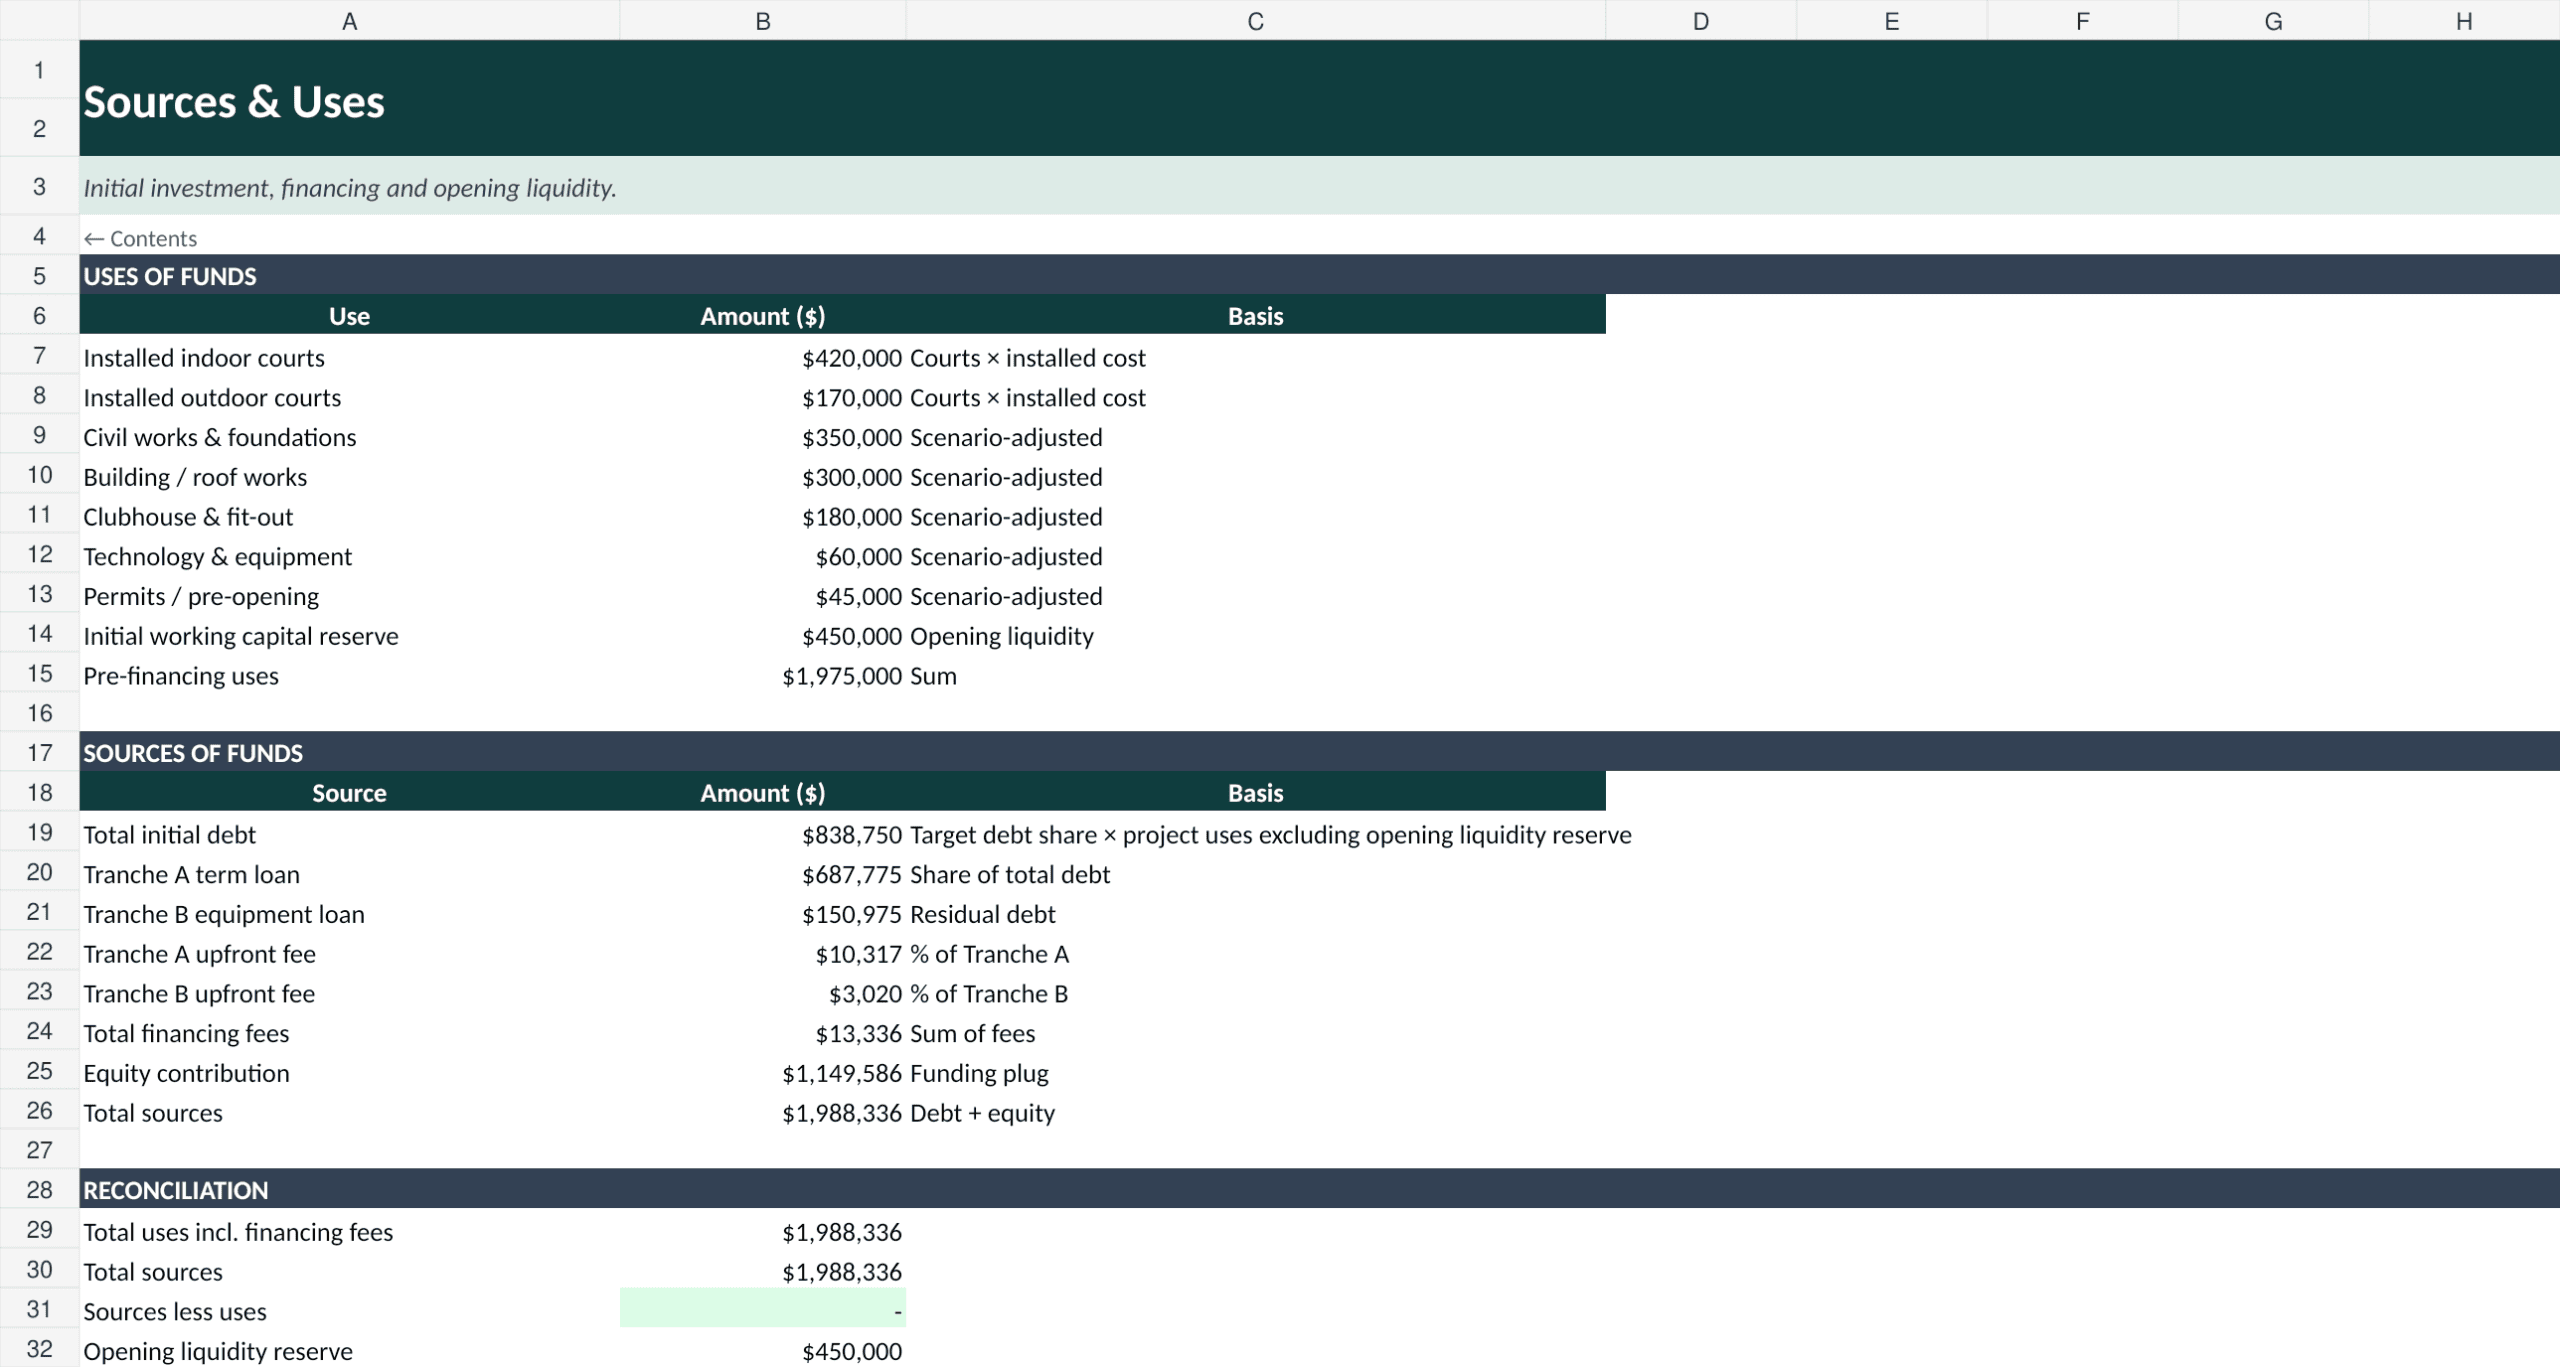
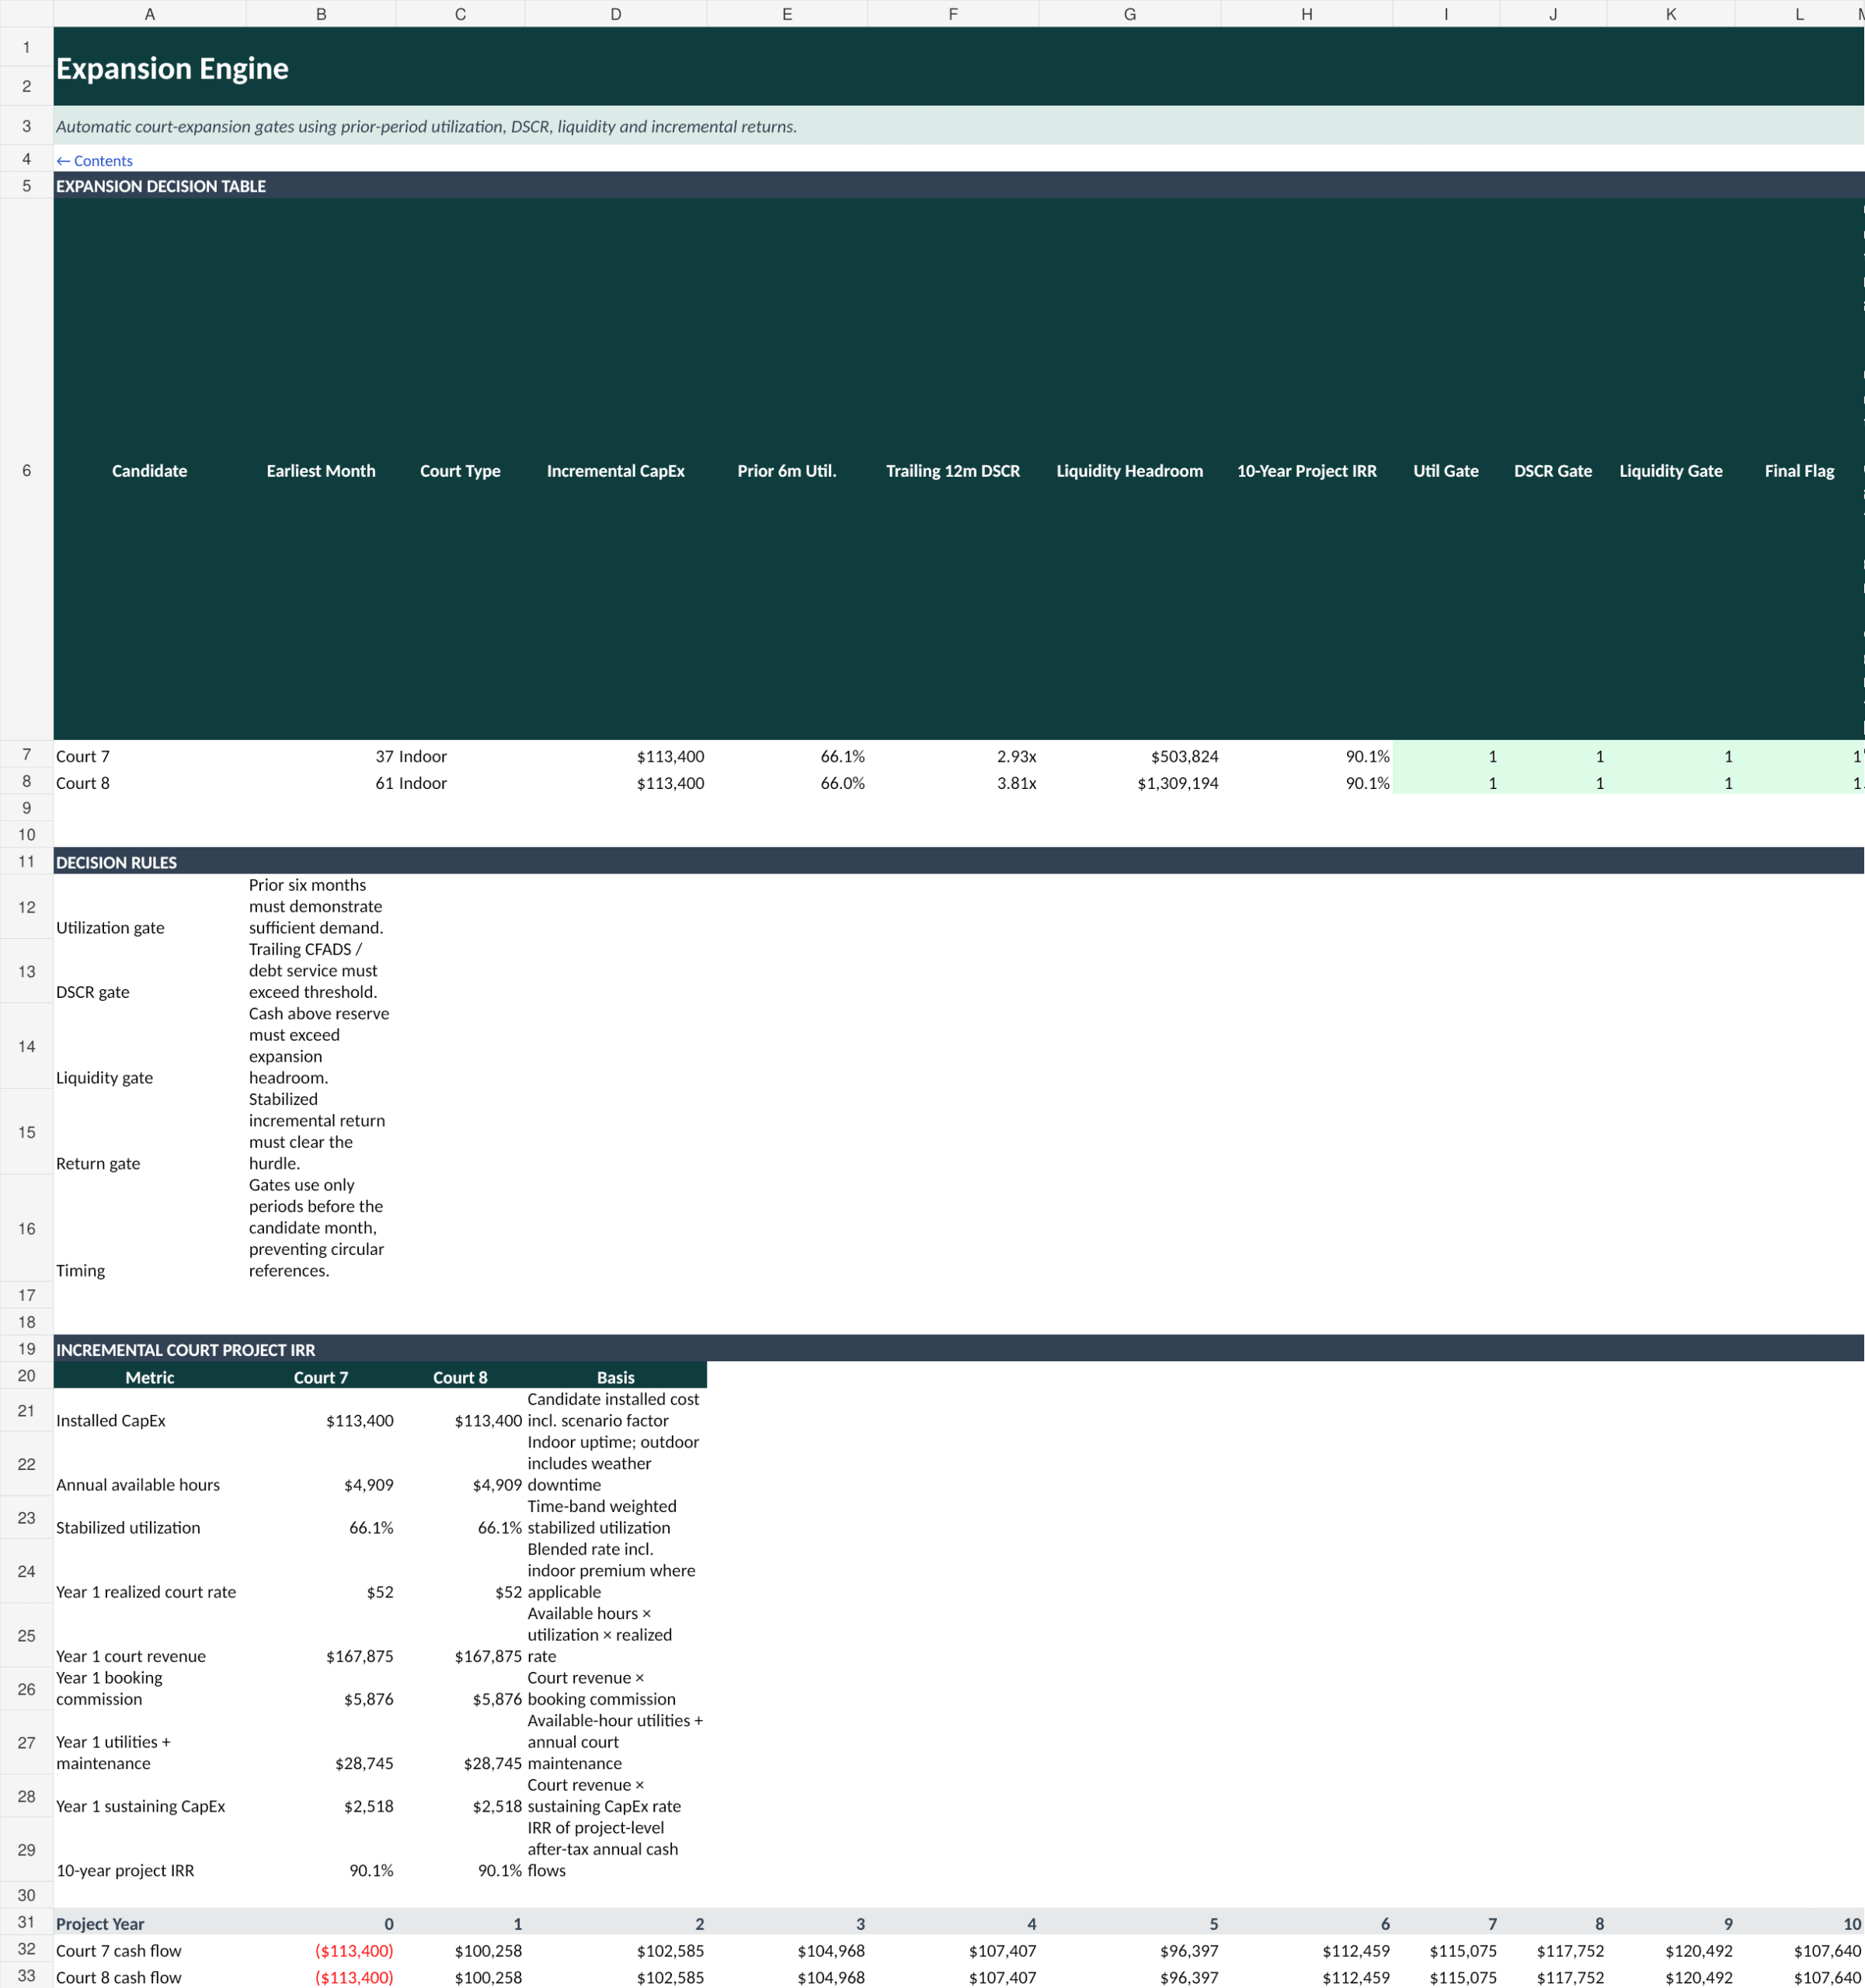
Startup investment is built from installed indoor/outdoor courts, civil works, building/roof works, clubhouse fit-out, technology, permits and opening liquidity. The model also schedules sustaining CapEx, turf replacement, depreciation and gated expansion CapEx. Court 7 and Court 8 are evaluated using prior-period utilization, trailing DSCR, liquidity headroom and a 10-year incremental-project IRR. Expansion can operate in automatic Gate mode or Manual mode, so users can compare rule-based growth with management-selected timing.
📈 10-year financial statements and valuation
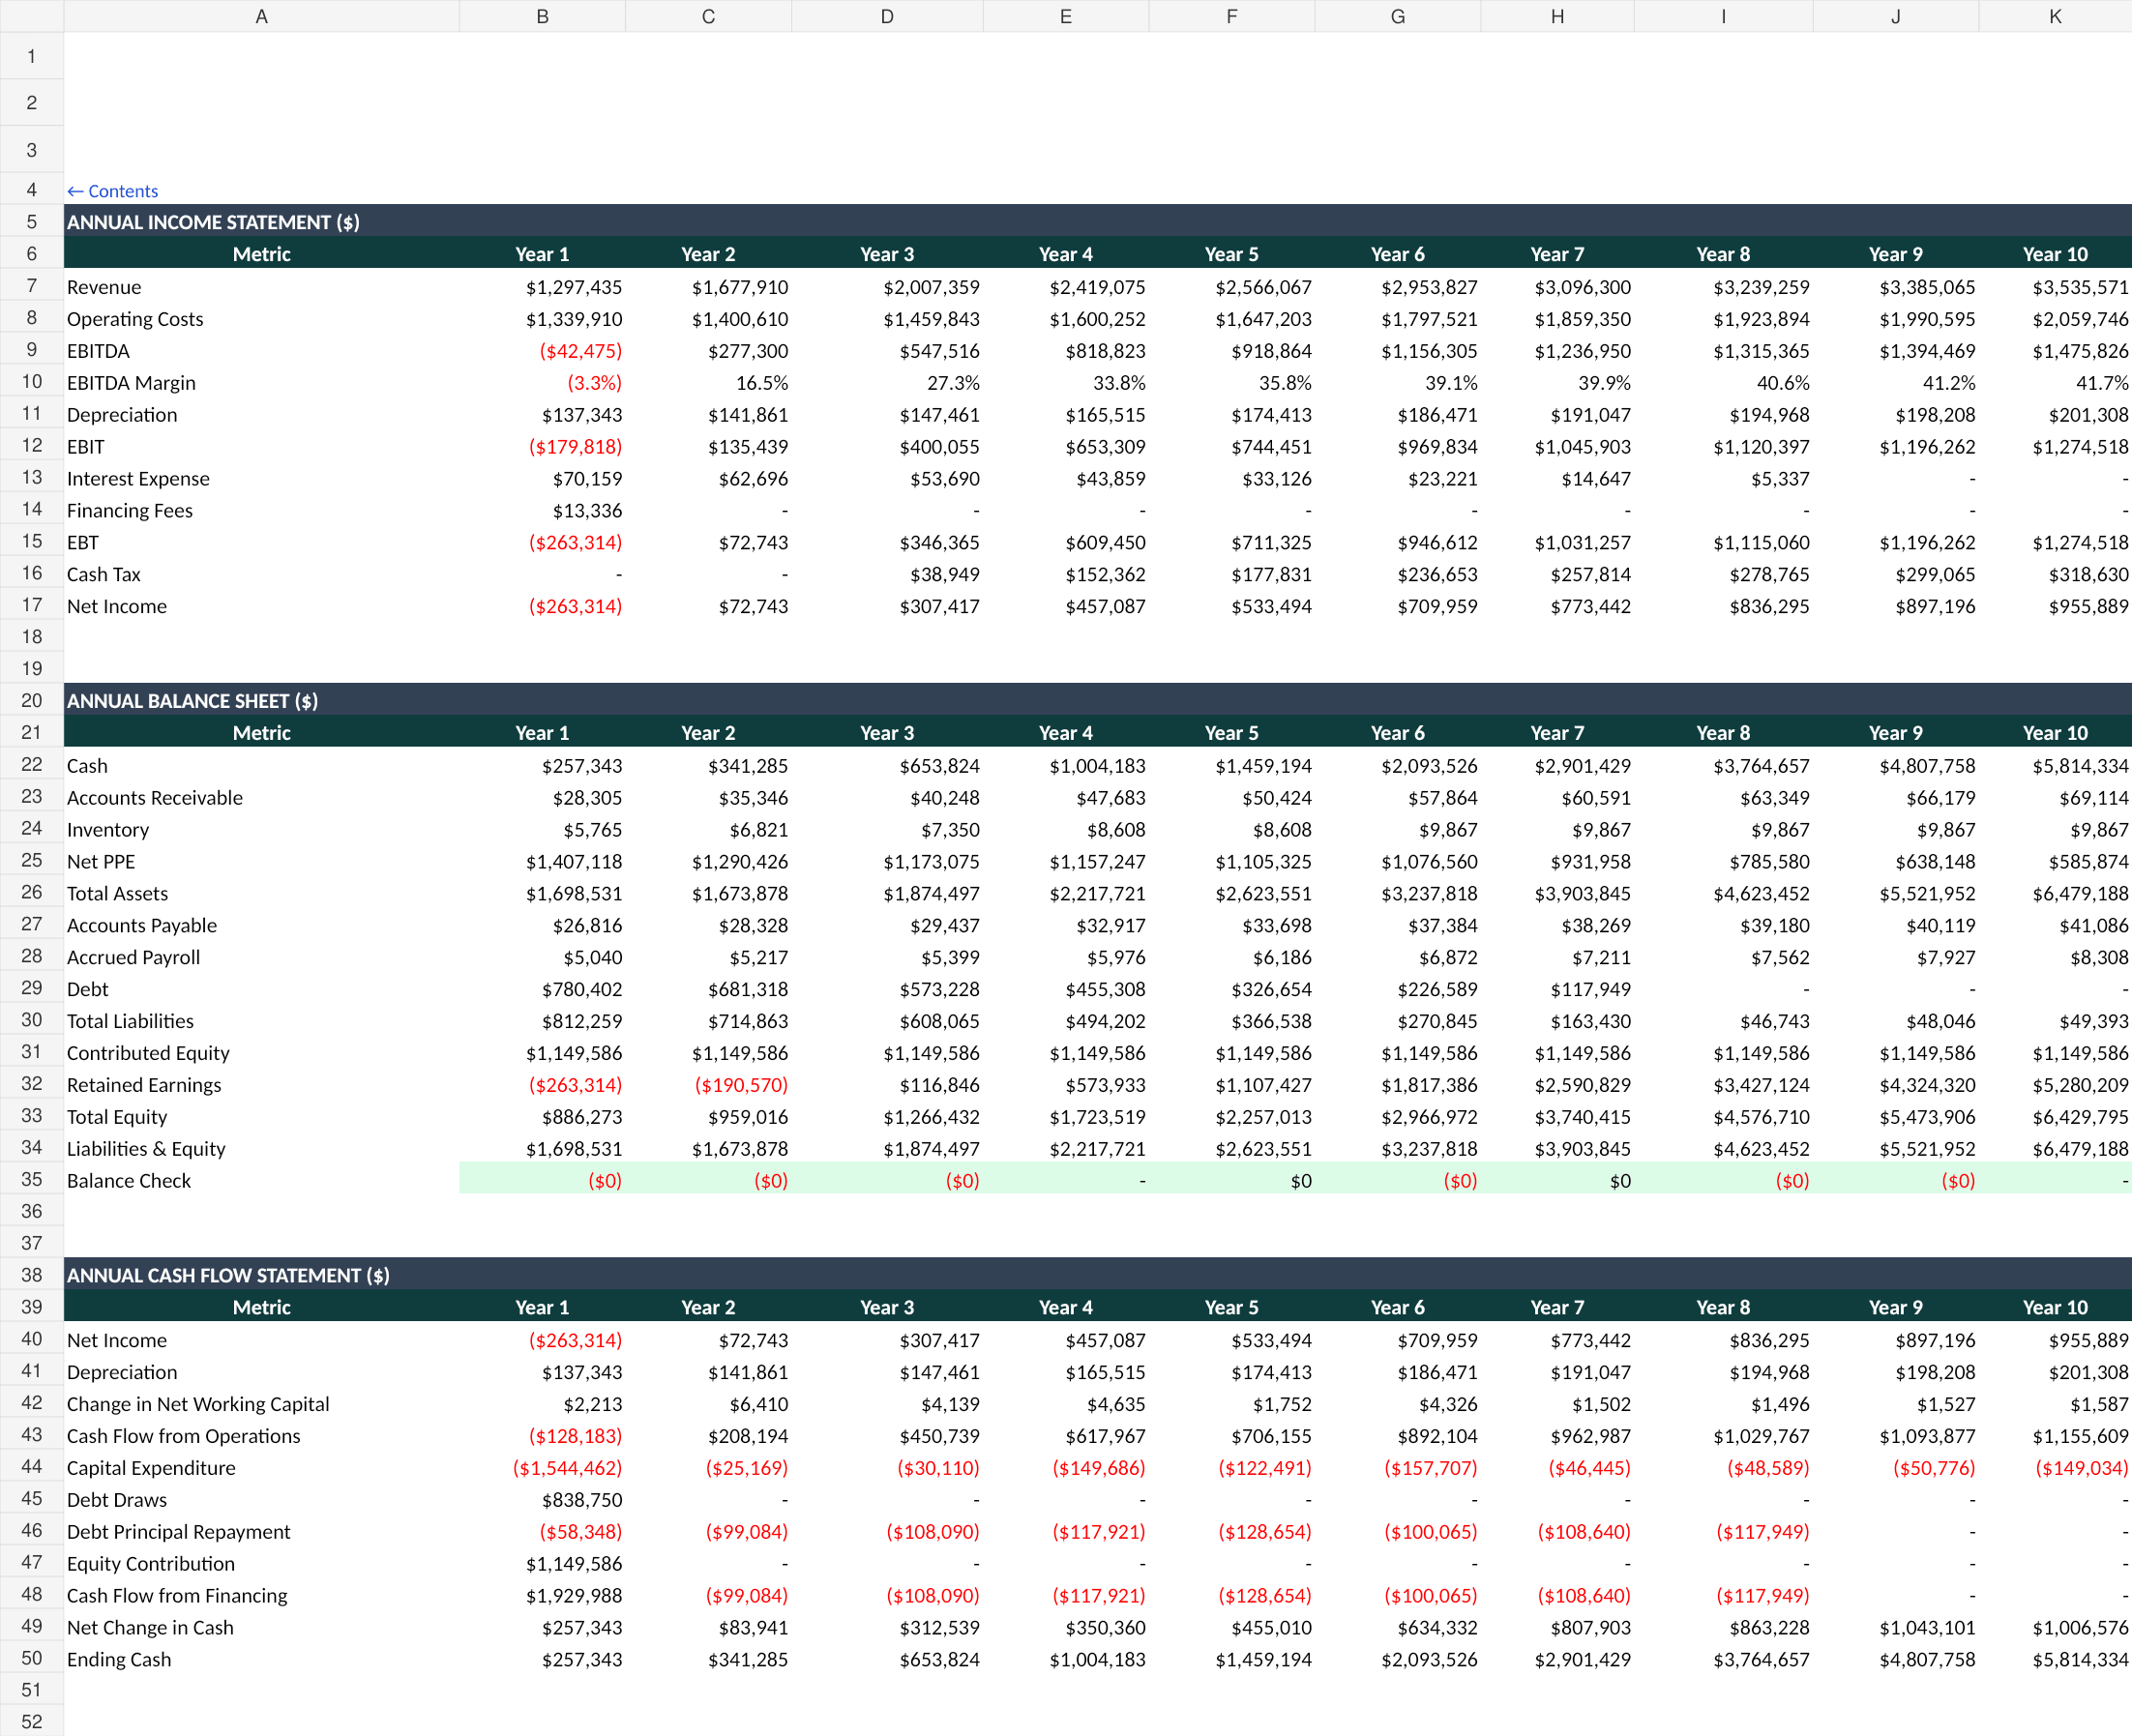
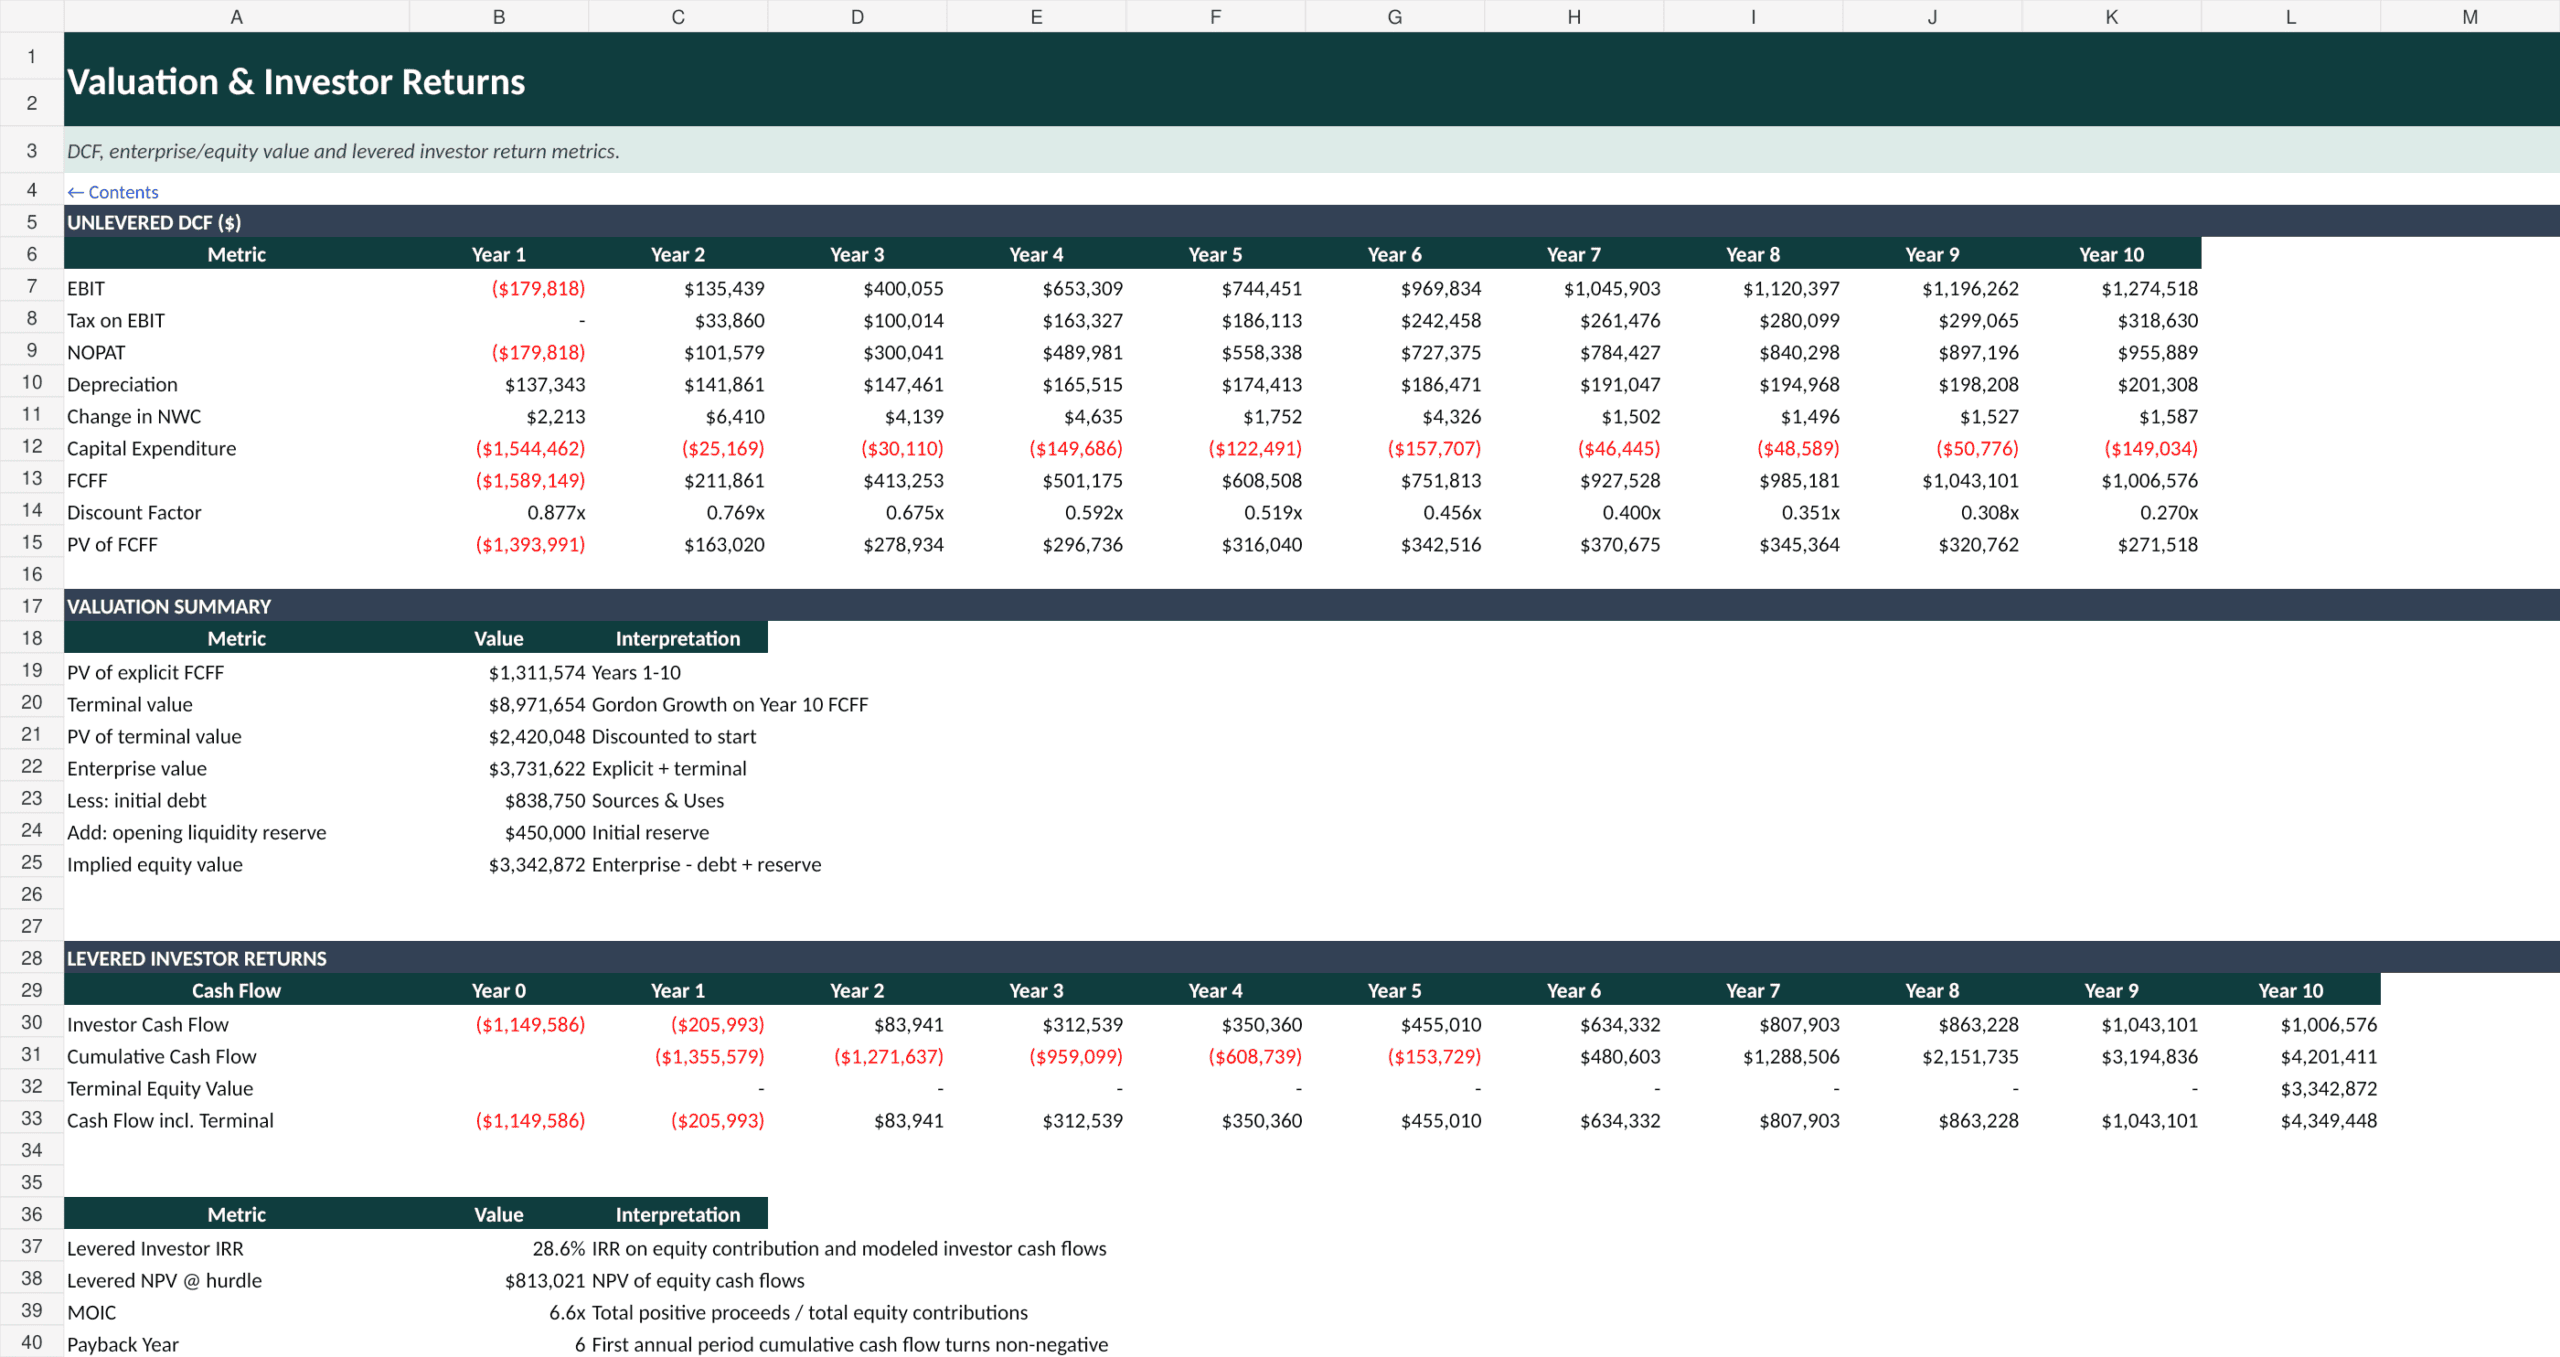
The Three-Statement Financials sheet contains integrated annual P&L, Balance Sheet and Cash Flow outputs backed by monthly calculations. Working capital includes receivables, inventory, payables and accrued payroll. The Valuation & Investor Returns module calculates unlevered FCFF, DCF enterprise value, implied equity value, levered investor IRR, NPV, MOIC and payback period. The model also includes a simplified tax-loss carryforward in the cash-tax schedule.
🔄 Scenarios, sensitivities and strategic analysis
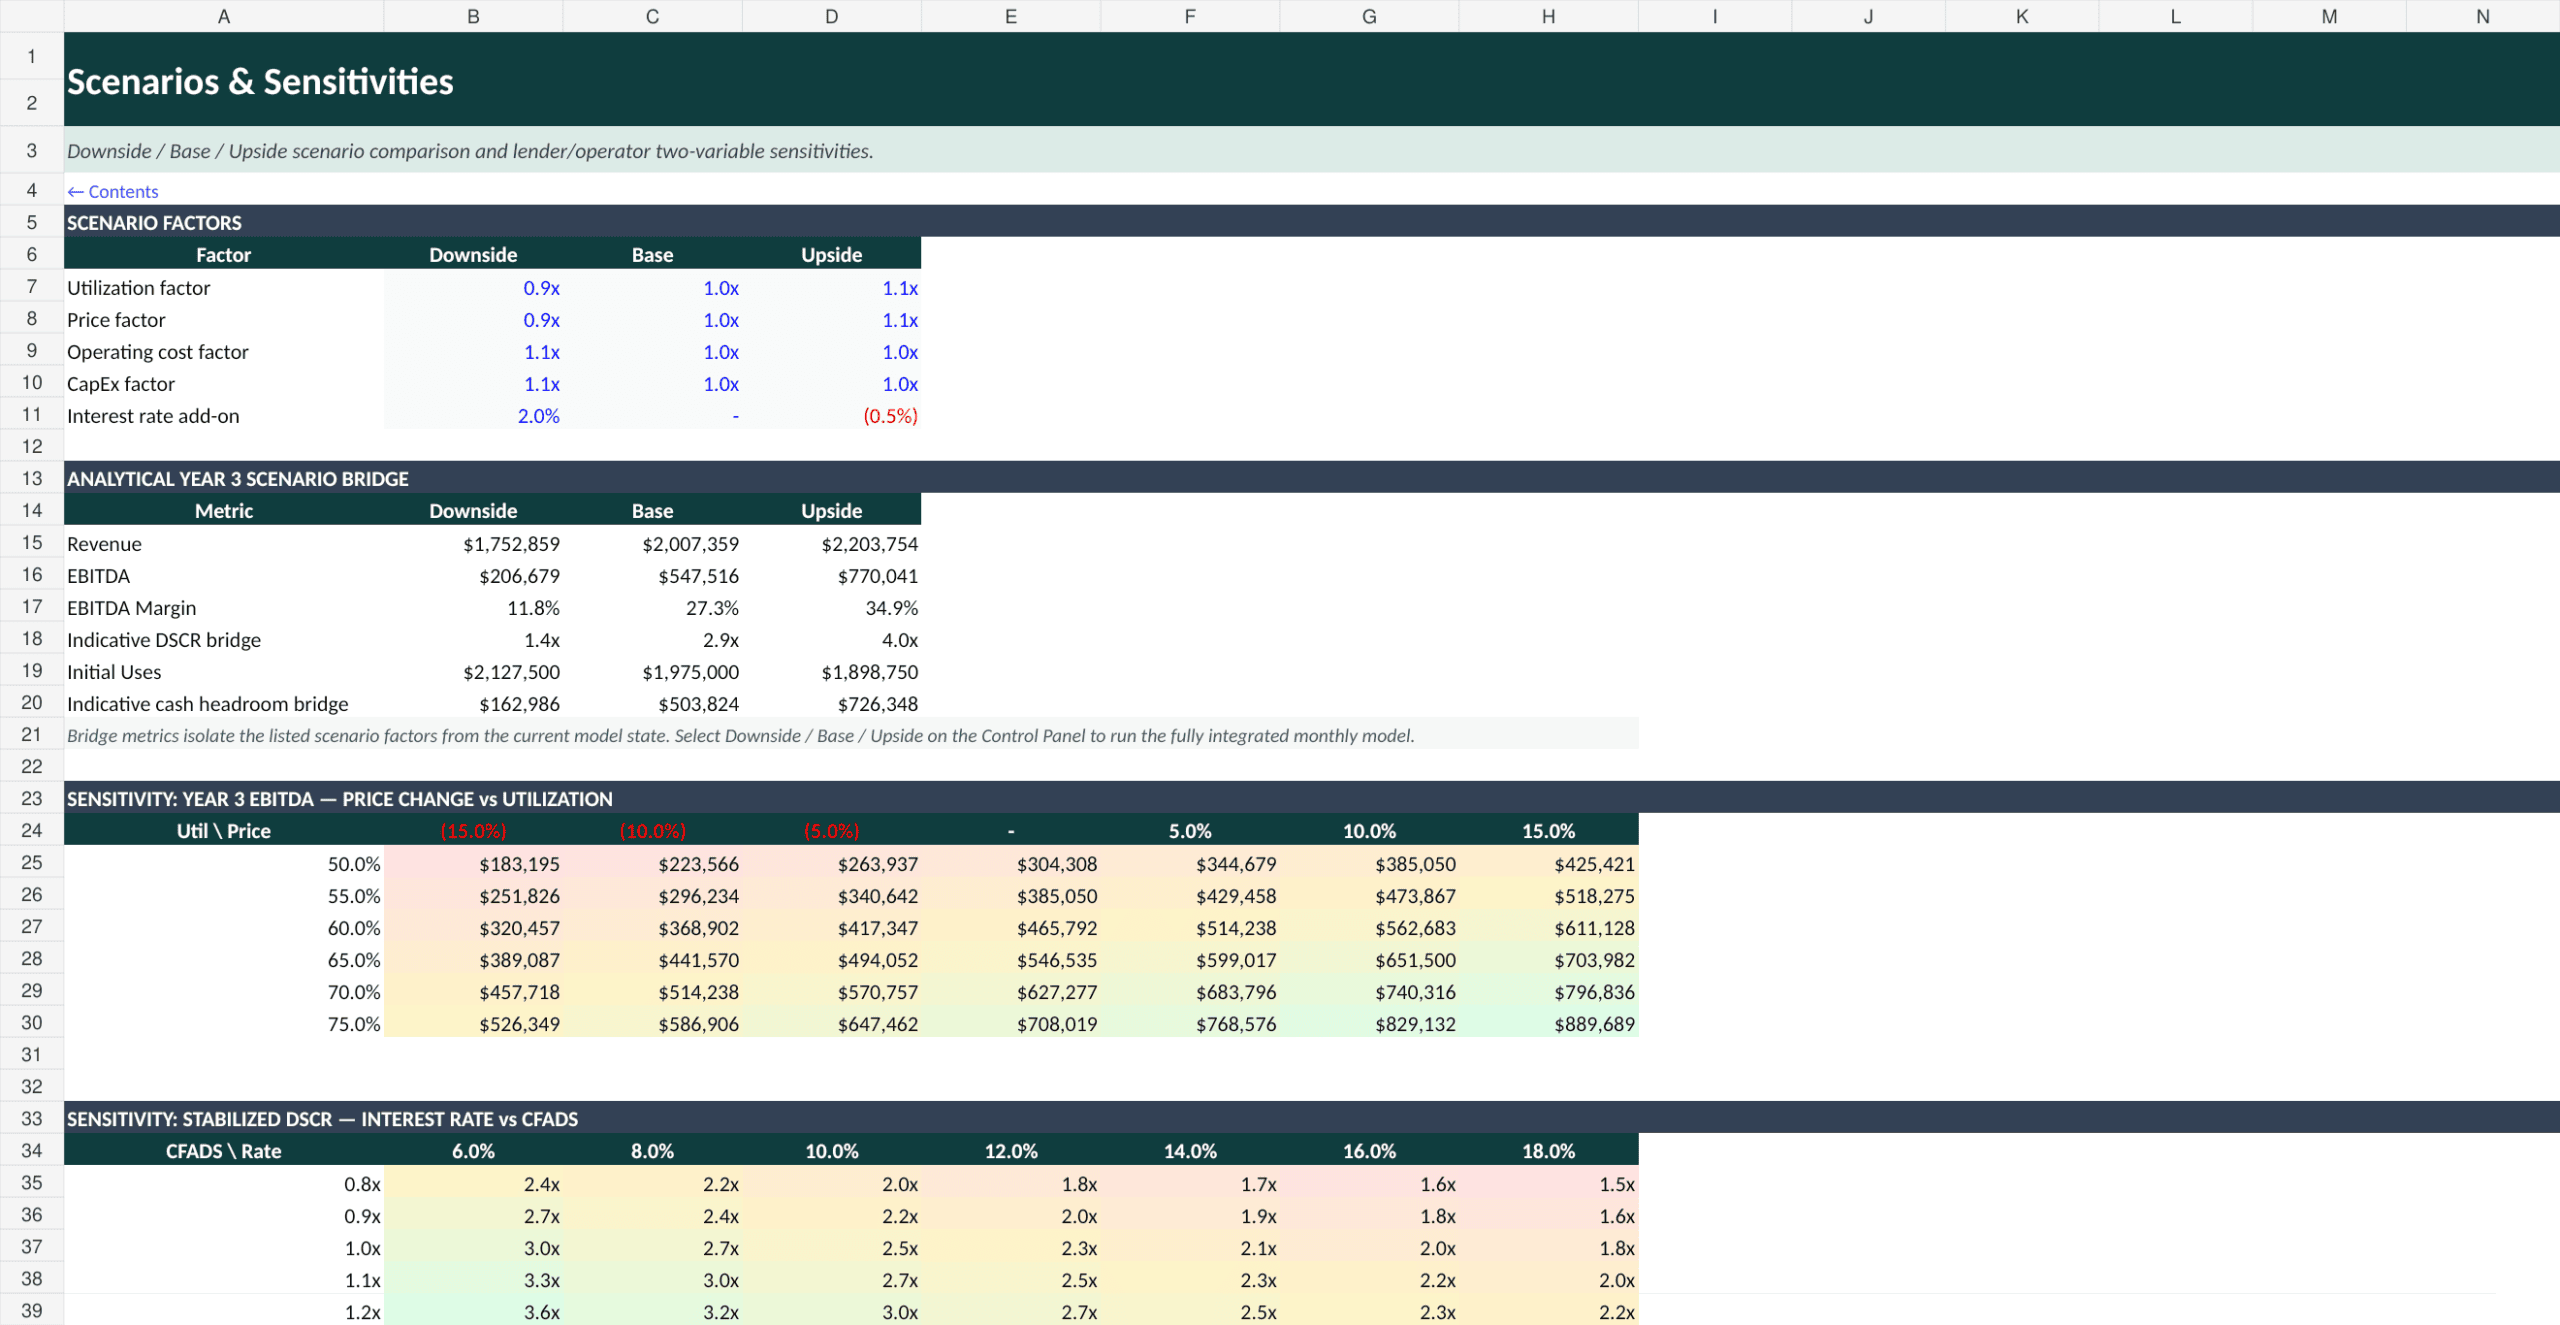
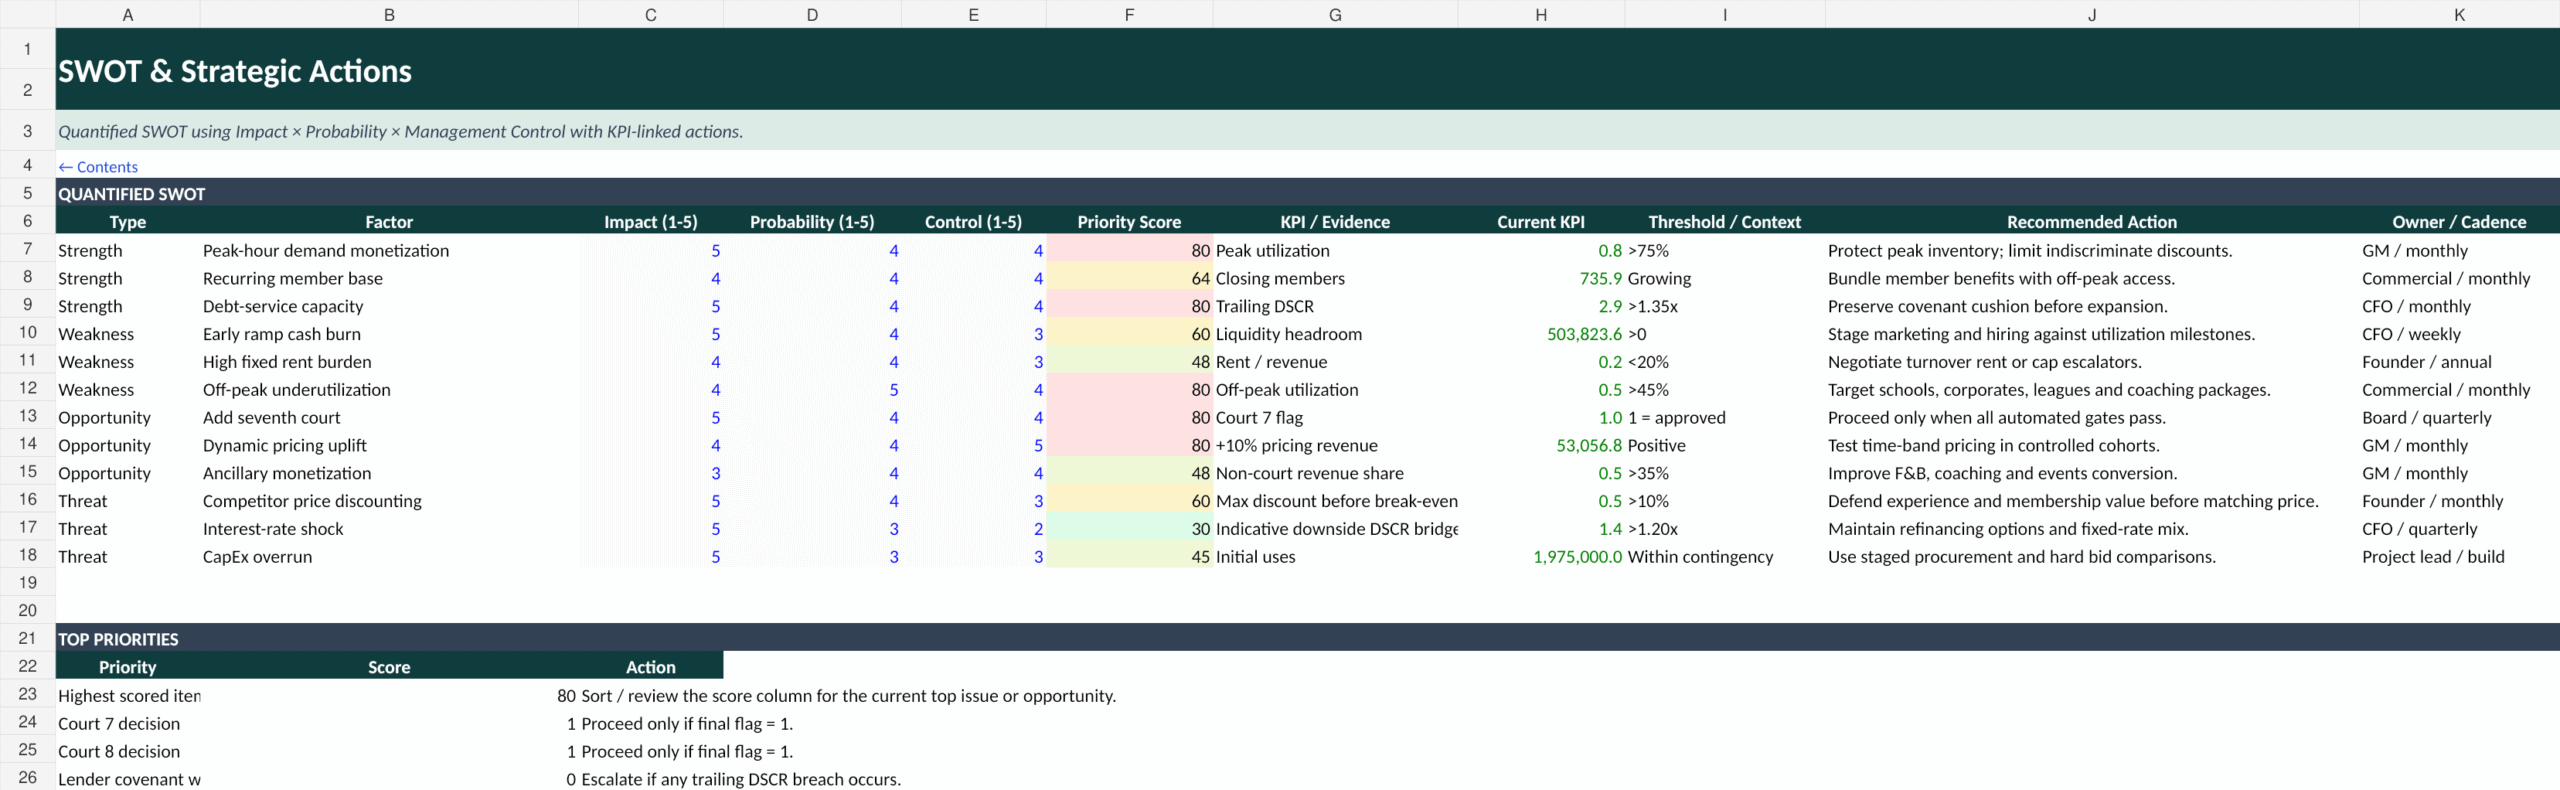
The scenario manager includes Downside, Base and Upside cases affecting utilization, pricing, operating costs, CapEx and interest rates. The sensitivity section provides decision tables around key operating and lender variables. A quantified SWOT & Strategic Actions sheet scores issues using Impact × Probability × Management Control and links priorities to model KPIs, helping convert financial output into actions around pricing, marketing, financing, cost control and expansion.
📌 Executive dashboards
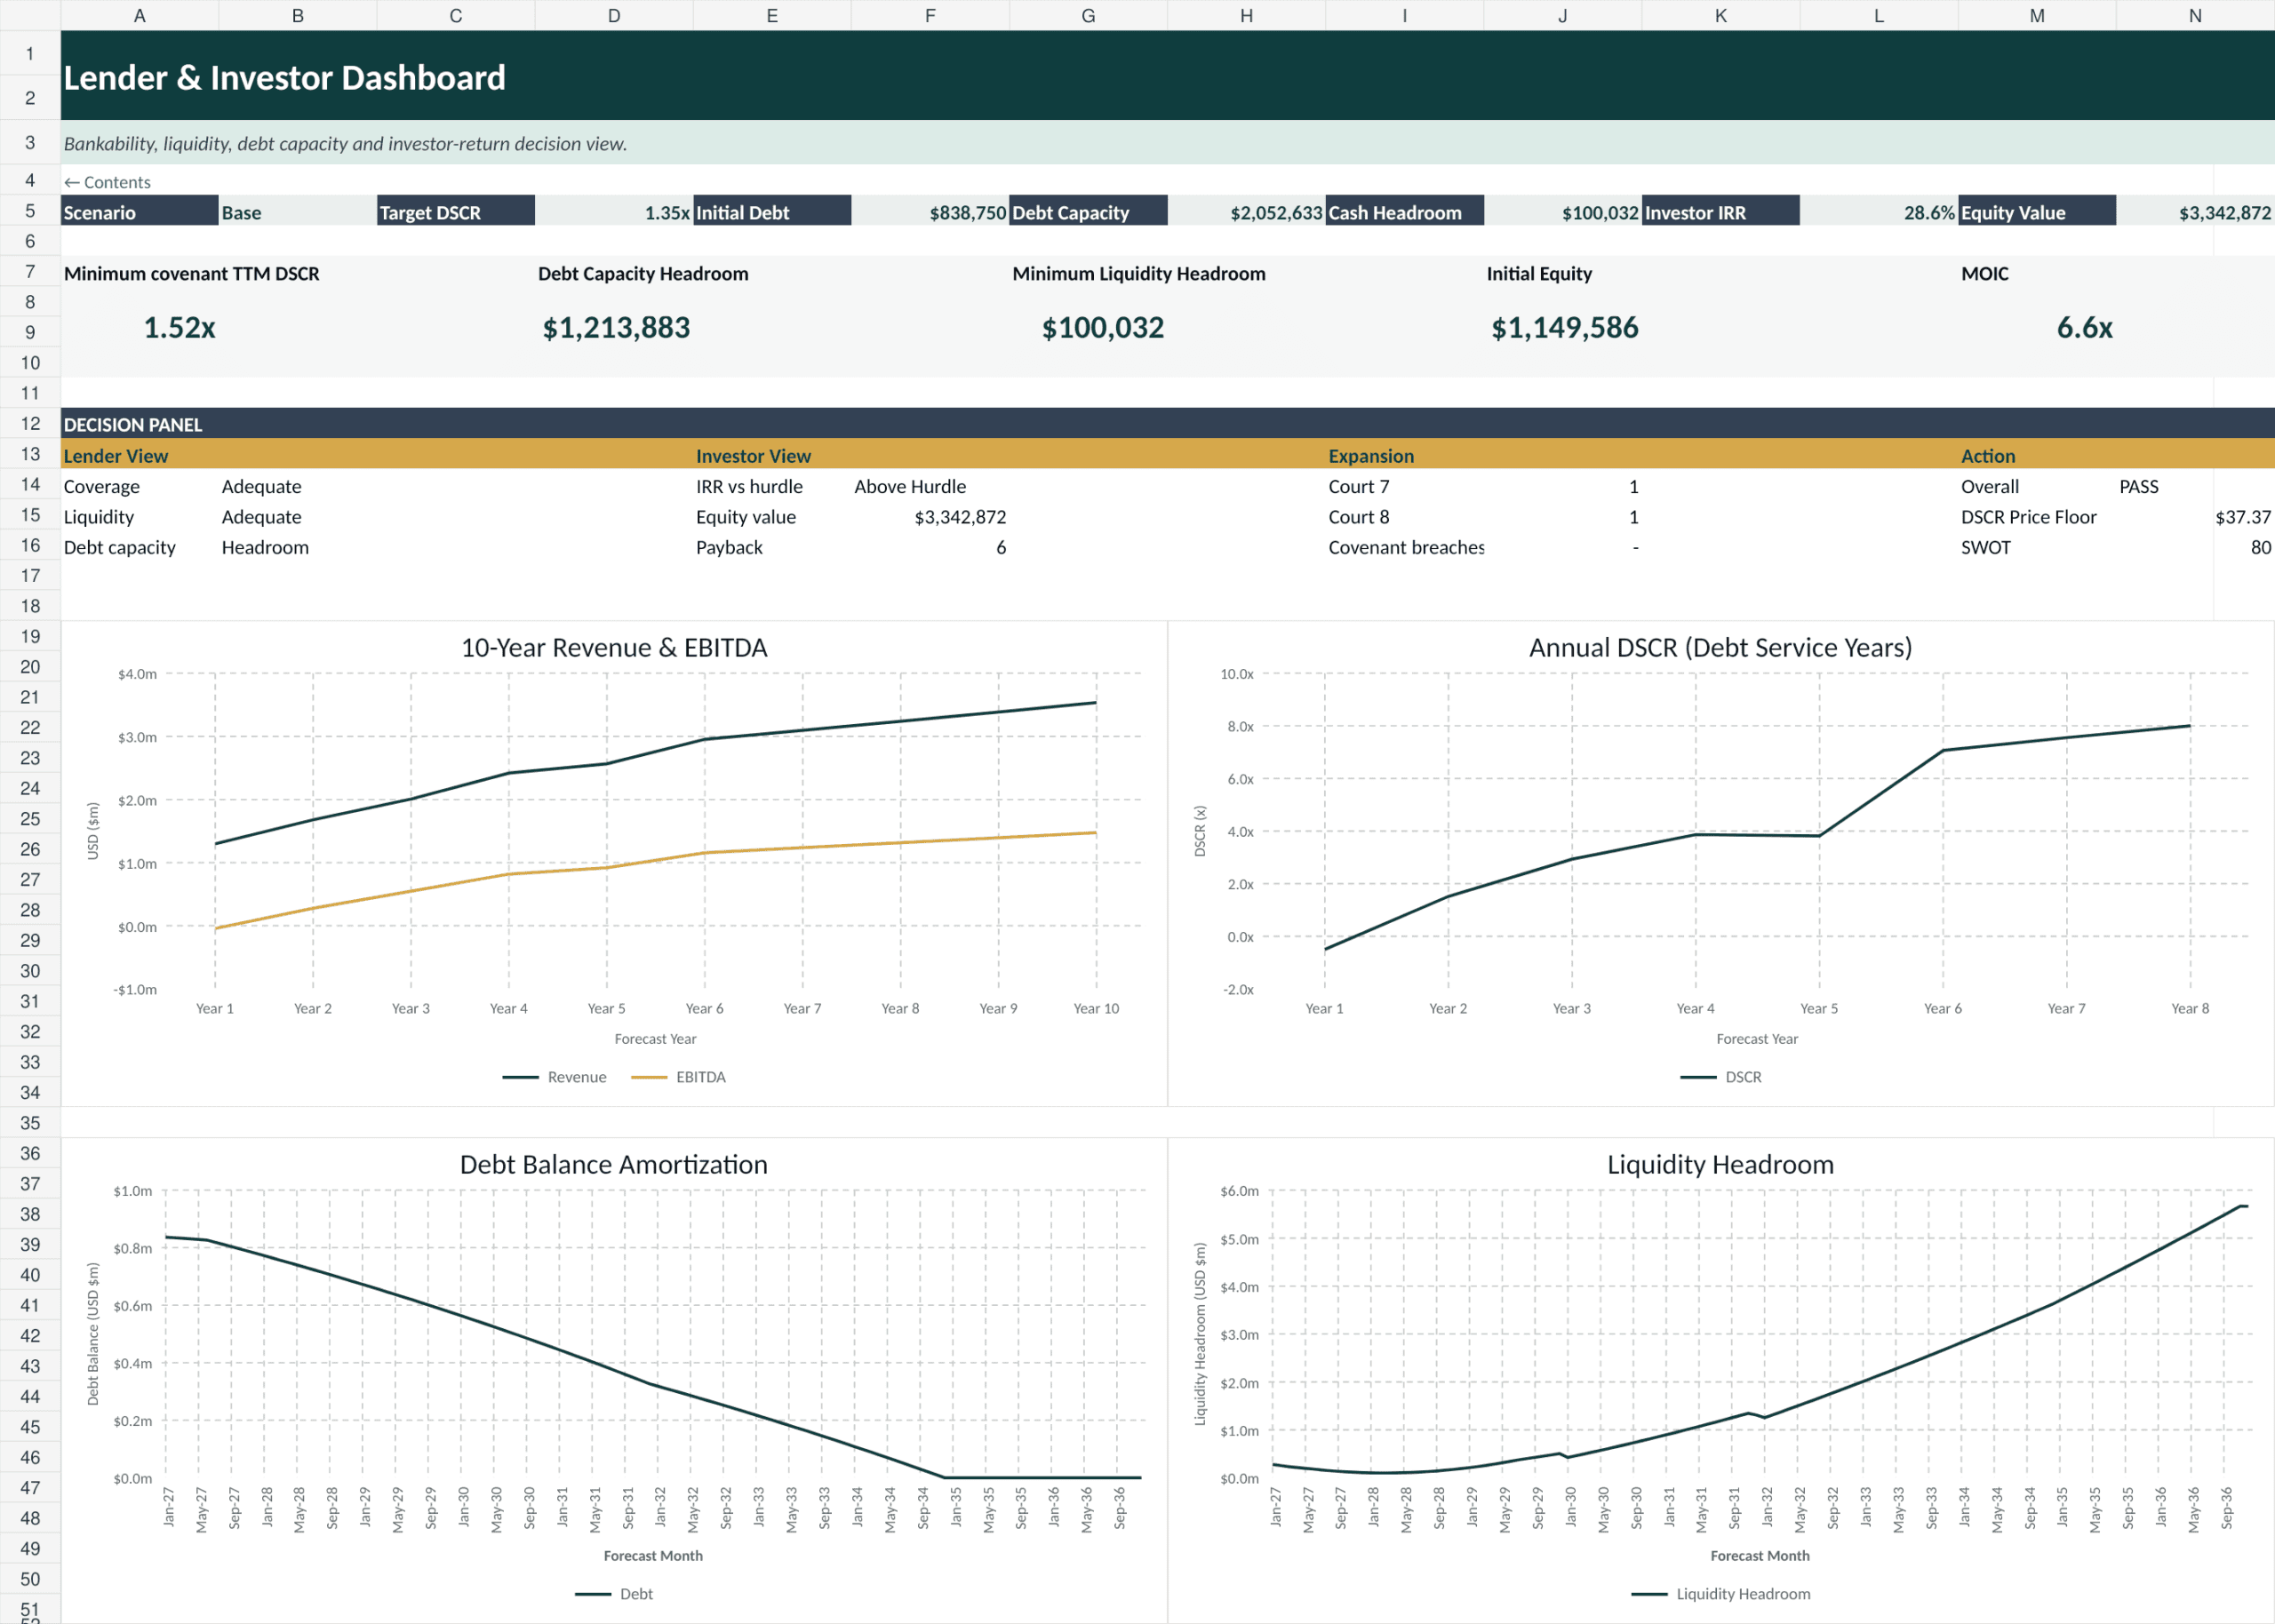
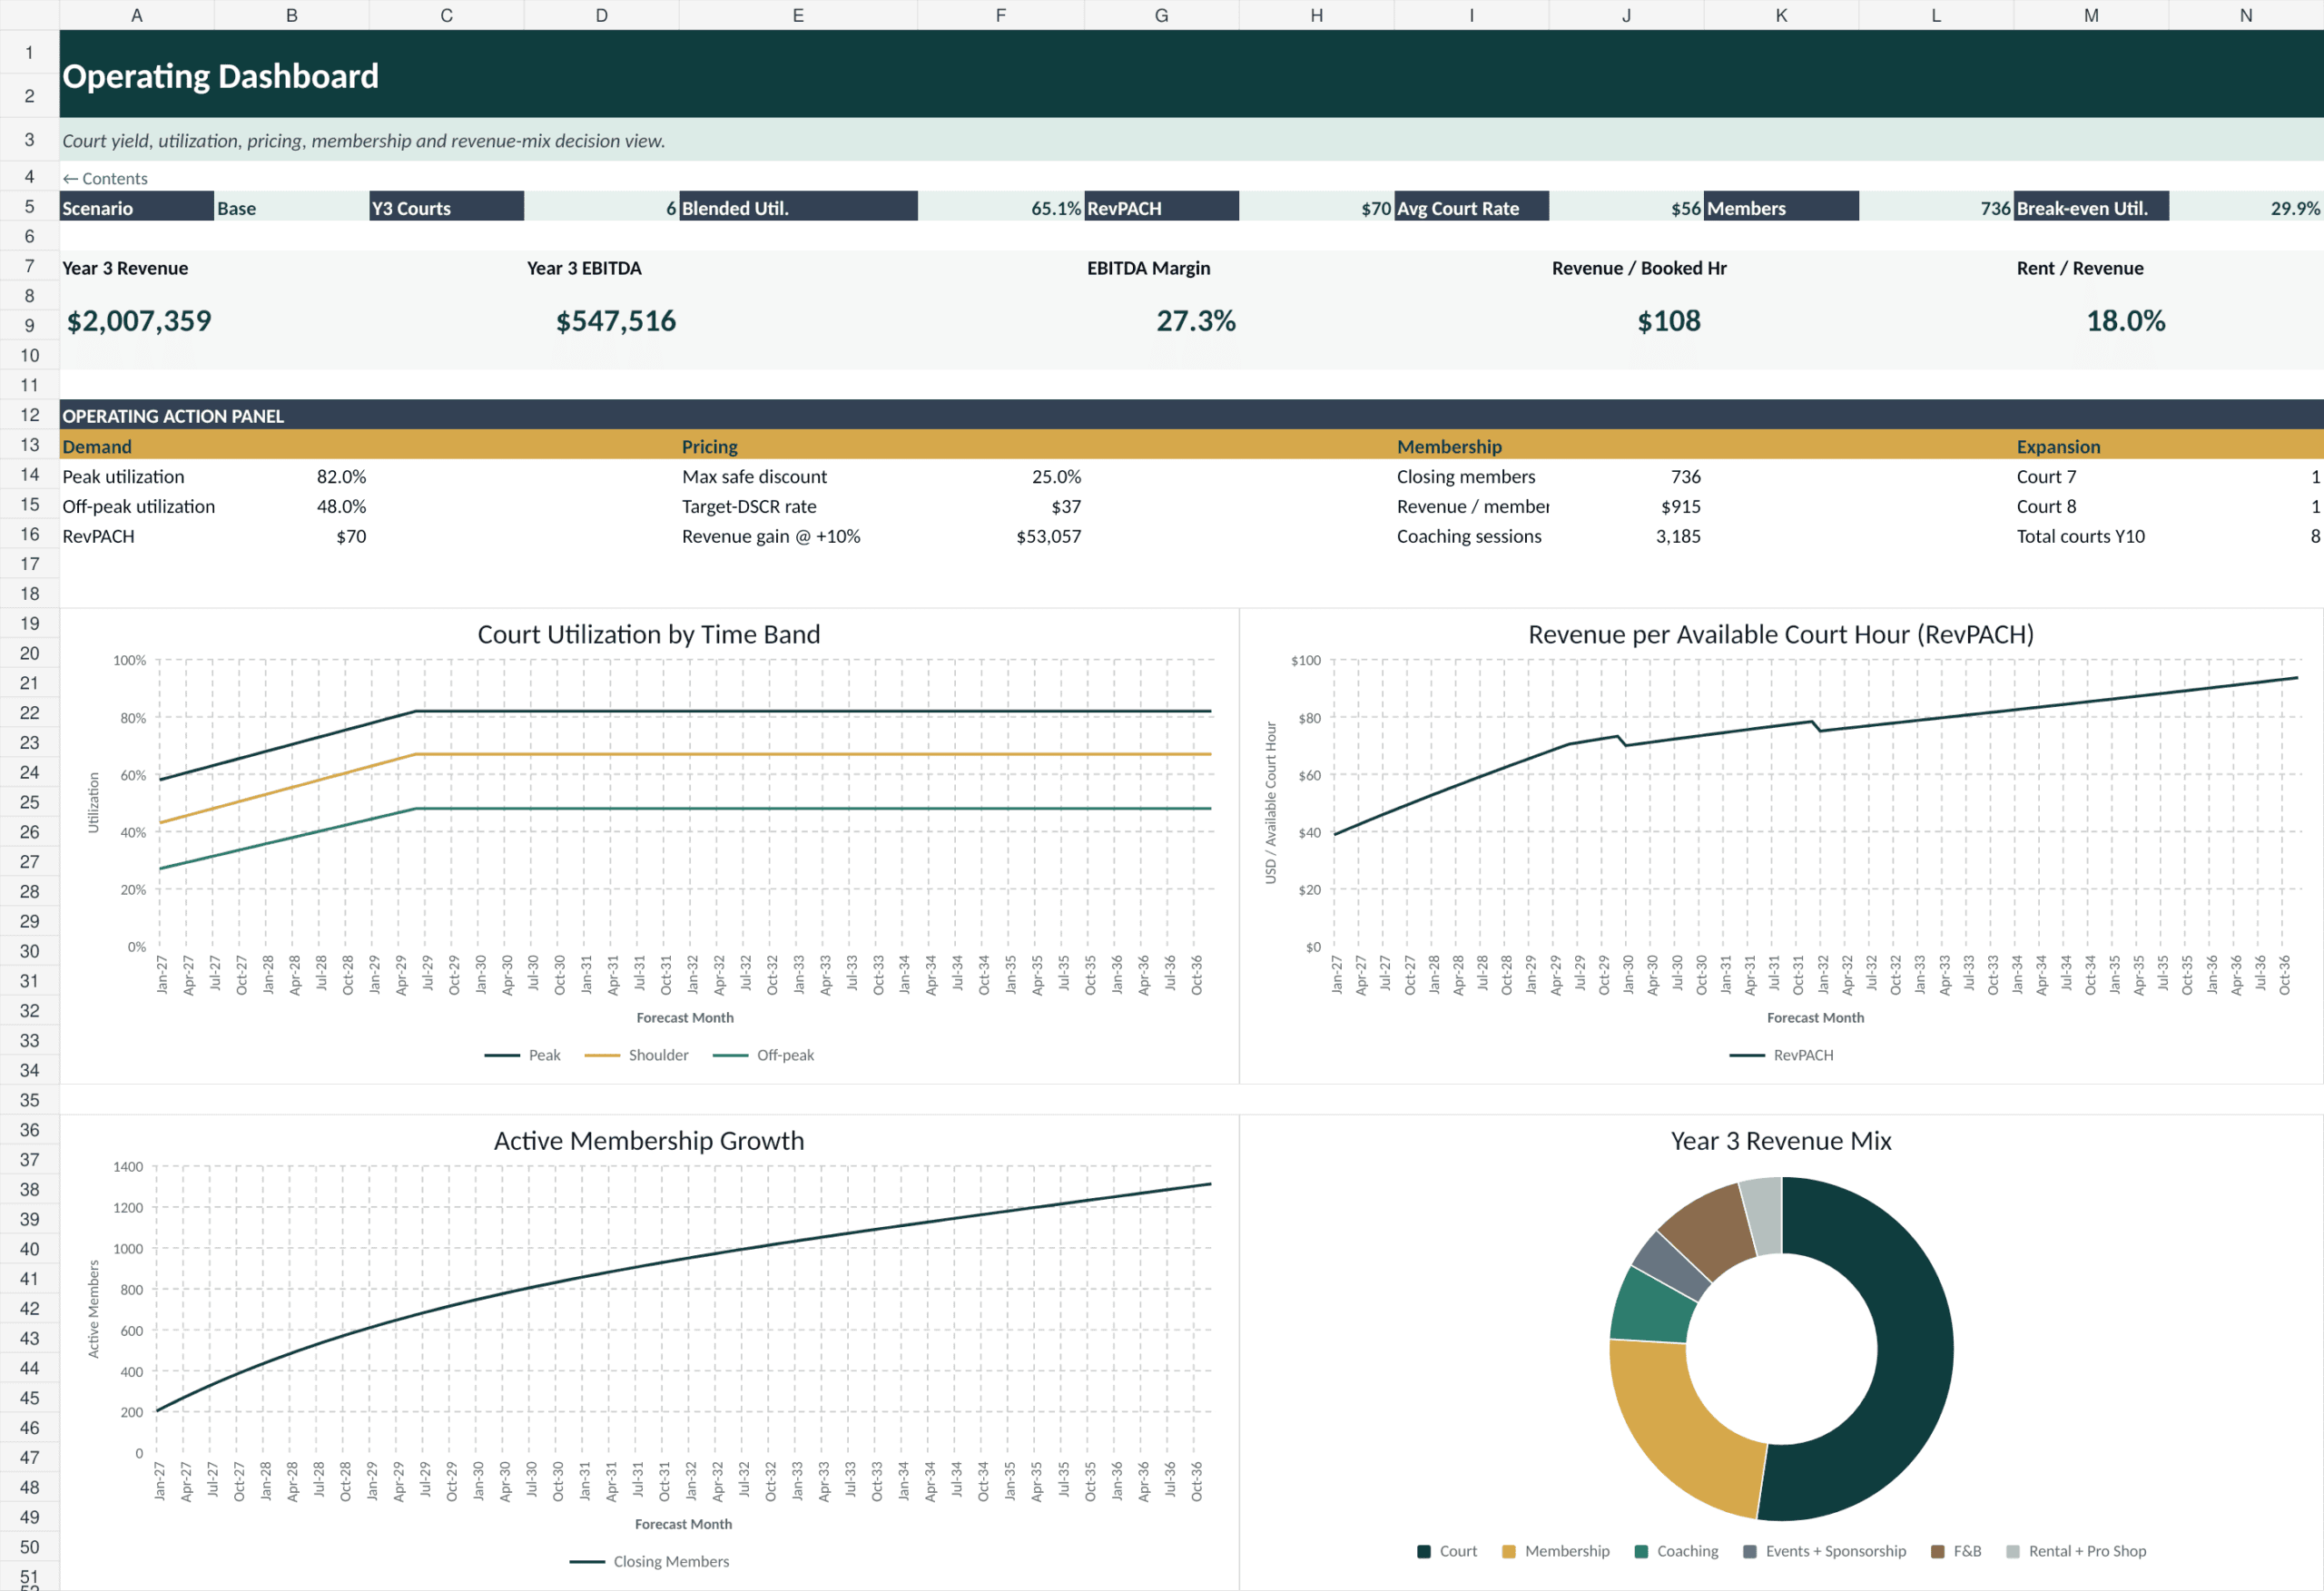
The Lender & Investor Dashboard summarizes target DSCR, debt capacity, cash headroom, investor IRR, equity value, minimum covenant DSCR, debt-capacity headroom, MOIC, payback and expansion status. Its charts show revenue/EBITDA, annual DSCR, debt amortization and liquidity headroom. The Operating Dashboard focuses on Year 3 revenue and EBITDA, EBITDA margin, utilization, RevPACH, average court rate, membership, break-even utilization, pricing actions and the Court 7/Court 8 expansion path. Charts cover court utilization, RevPACH, active member growth and revenue mix.
✅ Practical use cases
- Startup planning: estimate total uses, initial equity requirement and opening liquidity for a new padel club.
- 10-year forecasting: build integrated revenue, operating cost, profit, balance-sheet and cash-flow projections.
- Profitability analysis: understand EBITDA margin, revenue/EBITDA per court and rent burden.
- Cash-flow planning: track working capital, CapEx, debt service, liquidity headroom and cash reserves.
- Pricing strategy: test peak/off-peak economics, price elasticity, safe discounts and the target-DSCR court rate.
- Operational planning: evaluate court capacity, utilization, member growth, coaching activity and player throughput.
- Loan assessment: analyze amortization, CFADS, DSCR, covenant headroom and maximum supportable debt.
- Scenario planning: compare the economic effect of Downside, Base and Upside operating assumptions.
- Sensitivity analysis: test lender and operating outcomes across combinations of key variables.
- Expansion planning: determine whether and when additional courts meet demand, DSCR, liquidity and return gates.
- Valuation: estimate DCF enterprise/equity value and levered investor returns.
- Strategic review: use quantified SWOT priorities and dashboard signals to identify actions requiring management attention.
🗂️ Workbook structure
The 24 worksheets cover: Cover & Navigation; Control Panel; Operating Assumptions; Pricing & Market Benchmarks; Court Capacity & Yield; Revenue Engine; Membership & Academy; Payroll & Operating Costs; CapEx & Depreciation; Sources & Uses; Loan Amortization; DSCR & Debt Capacity; Working Capital & Cash; Three-Statement Financials; Pricing Optimization; Break-Even & Unit Economics; Expansion Engine; Valuation & Investor Returns; Scenarios & Sensitivities; SWOT & Strategic Actions; Lender & Investor Dashboard; Operating Dashboard; Model Checks; and Sources & Methodology.
👥 Intended users
This model is suitable for padel club founders, existing operators considering additional courts, sports-facility investors, lenders assessing repayment capacity, accountants and FP&A teams, consultants preparing feasibility studies, and entrepreneurs comparing capital structures or pricing strategies.
📦 Delivered files
The package includes the fully editable audited Excel workbook, a 24-page full-sheet PDF preview with one page per worksheet, and a curated set of 19 buyer-facing PNG screenshots showing the model’s key inputs, calculations, decision tools and dashboards.
Similar ProductsOther customers were also interested in...



 eFinancialModels
Electric Vehicle (EV) Charging Station Financial M...
With this comprehensive 5- or 10-year monthly tool, investors can assess the viability of setting up... Read more

Financial Model for Mobile App | Mobile App Busine...
The Mobile App Financial Plan Template in Excel allows you to develop financial projections when lau... Read more

 HenrySheykin
Food Truck Financial Model Excel Template
The Food Truck Financial Model helps entrepreneurs, founders, business owners, consultants, and anal... Read more

Green Hydrogen Production from Wind Energy Financi...
The Green Hydrogen from Wind Financial Model aims to comprehensively forecast a horizon of 40 years ... Read more

Simple Mutual Non-Disclosure Agreement Template
Protect your business secrets with ease using our Simple Mutual Non-Disclosure Agreement Template. S... Read more

Solar Energy Financial Model
The Solar Energy Financial Model Spreadsheet Template in Excel assists you in preparing a sophistica... Read more

 Peter Graf
The Customer-Centric Financial Model for Restauran...
Starting a restaurant without a financial plan is like driving a car blindfolded. You wouldn´t do i... Read more
You must log in to submit a review.