
0 ITEMS

Cap Table with SAFE & Convertible Note Conversion, Dilution and Exit Waterfall (Excel)
A working Excel model of a priced round: it converts every SAFE and convertible note you have outstanding, sizes the option pool, issues the new shares, and shows who owns what before and after — then runs the exit waterfall with liquidation preferences. The hard part of a cap table is a circular reference. Price per share depends on the fully diluted count; the shares issued to a discounted SAFE depend on the price per share; the option pool top-up is a percentage of the post-round total, which includes both. Excel cannot resolve that without iterative calculation switched on — a setting most buyers never enable and no diligence reader trusts. This model solves the loop in twelve visible columns instead, with the residual printed at the bottom and an integrity check that proves it converged. Post-money SAFEs, pre-money SAFEs, uncapped and MFN SAFEs, and convertible notes with accrued simple interest are each priced at their own conversion price. The option pool can be created before the round, where founders bear it, or after, where everyone does. The exit waterfall supports non-participating, participating and capped participating preferred, and the question of whether converted instruments carry a preference at all. Twelve tabs. Twelve integrity checks, all of which must read PASS. No macros, no locked cells, no passwords, no external links.
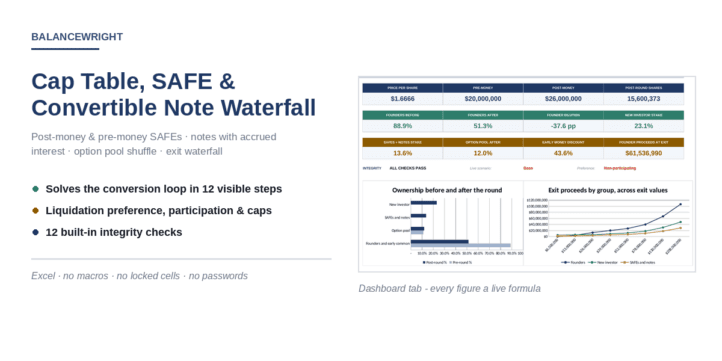


This Excel model answers the two questions that decide whether a term sheet gets signed: who owns what after this round, and who gets what at exit.
Enter the cap table you have today, every SAFE and convertible note outstanding, and the terms of the priced round. The model converts each instrument at its own price, sizes the option pool, issues the new shares, and reports ownership before and after, dilution holder by holder, and the exit waterfall with liquidation preferences. Every figure is a live formula.
The problem this model exists to solve
In a priced round with converting instruments, three things depend on each other at the same moment. The price per share is the pre-money valuation divided by the fully diluted share count. The shares issued to a discounted SAFE or note depend on that price per share. The option pool top-up is sized as a percentage of the post-round total, which includes both of the above.
Written directly into a spreadsheet, that is a circular reference. Excel refuses to calculate it until you switch on iterative calculation — a setting that travels with the file on some machines and not others, that changes the answer depending on the maximum-iterations value, and that a diligence reader is entitled to distrust. Most cap table templates avoid the problem by ignoring it: they price the round off the pre-round count, which overstates the price per share and understates founder dilution.
This workbook solves the loop explicitly. The Conversion Engine tab runs twelve iterations across twelve columns. Each column takes the previous column’s fully diluted count, prices the round off it, reprices every discounted instrument, resizes the pool and produces a new count. The residual printed at the bottom shrinks to zero, and the Checks tab tests that it did.
What is inside
Twelve tabs: Read Me, Dashboard, Assumptions, Pre-Round Cap Table, SAFEs, Convertible Notes, Conversion Engine, Round Waterfall, Post-Round Cap Table, Exit Waterfall, Sensitivity and Checks. Eight SAFE rows, five convertible note rows, five pre-round holder lines and one priced round.
- Post-money SAFEs convert at their cap to a fixed percentage of the company, the standard YC behaviour.
- Pre-money SAFEs and notes convert at the better of cap price and discount — and the model shows which leg won.
- Convertible notes accrue simple interest from issue date to the round closing date and convert with principal.
- The option pool is sized to a target percentage of the post-round total, created either before the round, where founders bear it, or after, where everyone does.
- Three scenarios — pre-money, new money, pool target and exit value — switch from a single cell.
- The exit waterfall applies the preference to the preferred class, tests it against converting to common, and allocates proceeds, money multiples and share of exit to every holder. Non-participating, participating and participating-with-a-cap are all supported.
- The Sensitivity tab reruns the whole waterfall across eight exit values, from a quarter of post-money to eight times it.
How it is built
No macros. No add-ins. No external links. No password protection, no locked cells, and no iterative calculation setting to enable. A worked example runs through the whole file: three founders, a 1,000,000-share option pool, six SAFEs, two bridge notes and a $6m round at a $20m pre-money. A five-page PDF guide documents every convention the model applies, along with its limitations, and is available here as a free download.
Twelve integrity checks sit on their own tab and must all read PASS: the cap table adds up to the solved share count, ownership sums to 100%, price per share times the pre-money count equals the pre-money valuation, the iteration converged, shares times conversion price returns the money converted for every instrument, the option pool hits its target, and the exit waterfall distributes exactly the exit value.
This workbook models the arithmetic of financing documents. It is not legal or tax advice.
Similar ProductsOther customers were also interested in...



 eFinancialModels
Electric Vehicle (EV) Charging Station Financial M...
With this comprehensive 5- or 10-year monthly tool, investors can assess the viability of setting up... Read more

Financial Model for Mobile App | Mobile App Busine...
The Mobile App Financial Plan Template in Excel allows you to develop financial projections when lau... Read more

 HenrySheykin
Food Truck Financial Model Excel Template
The Food Truck Financial Model helps entrepreneurs, founders, business owners, consultants, and anal... Read more

Green Hydrogen Production from Wind Energy Financi...
The Green Hydrogen from Wind Financial Model aims to comprehensively forecast a horizon of 40 years ... Read more

Simple Mutual Non-Disclosure Agreement Template
Protect your business secrets with ease using our Simple Mutual Non-Disclosure Agreement Template. S... Read more

Solar Energy Financial Model
The Solar Energy Financial Model Spreadsheet Template in Excel assists you in preparing a sophistica... Read more

 Peter Graf
The Customer-Centric Financial Model for Restauran...
Starting a restaurant without a financial plan is like driving a car blindfolded. You wouldn´t do i... Read more
You must log in to submit a review.