
0 ITEMS

Roller Coaster Construction Costs: Full Financial Breakdown

Building a roller coaster is not a single line item. It is a multi-phase capital project where the ride itself is often the minority cost, and where the financial modeling errors happen in the 55-75% of budget that most operators underestimate. This breakdown gives investors, analysts, and park operators the numbers they need to model roller coaster investments with precision.
Key Takeaways
- Ride procurement represents only 25-45% of a roller coaster’s total project budget, meaning a $13M coaster can carry an $18M total price tag once site prep, installation, and theming are included.
- Major wooden roller coasters cost $5-40 million to build depending on scale, while comparable steel coasters run $10-60 million, with the premium driven by materials, engineering complexity, and manufacturer selection.
- Hypercoasters and giga coasters (coasters exceeding 200 feet in height) command $50-200+ million budgets, making manufacturer selection and throughput modeling critical to ROI.
- Wooden coasters carry $500,000 or more in annual maintenance costs plus periodic rebuilds exceeding $1 million, which must be modeled into any total cost of ownership analysis.
- A financially sound roller coaster investment requires modeling depreciation over a 20-30 year useful life, throughput-based revenue projections, and a contingency reserve of 10-15% of total project cost.
- Cash-flow forecasting for theme park attractions must separate construction-phase capital outflows from operating-phase maintenance escalators to avoid systematic underestimation of lifecycle costs.
Understanding the True Cost Structure: Coaster vs. Total Project Investment
The coaster price and the total project cost are two different numbers, and confusing them is the most common financial planning error in theme park capital budgeting. Ride and attraction procurement typically accounts for 25-45% of a park’s total project budget (Isun Amusement, 2023), meaning the remaining 55-75% covers site preparation, civil engineering, installation labor, electrical and utility infrastructure, theming, landscaping, testing, permitting, and contingency reserves.
Here is why this matters for cash-flow forecasting: if you model only the ride procurement cost, you will understate total capital deployment by a factor of 2x or more on complex projects. Every financial model for a roller coaster investment must start with a fully loaded project cost, not a manufacturer quote.
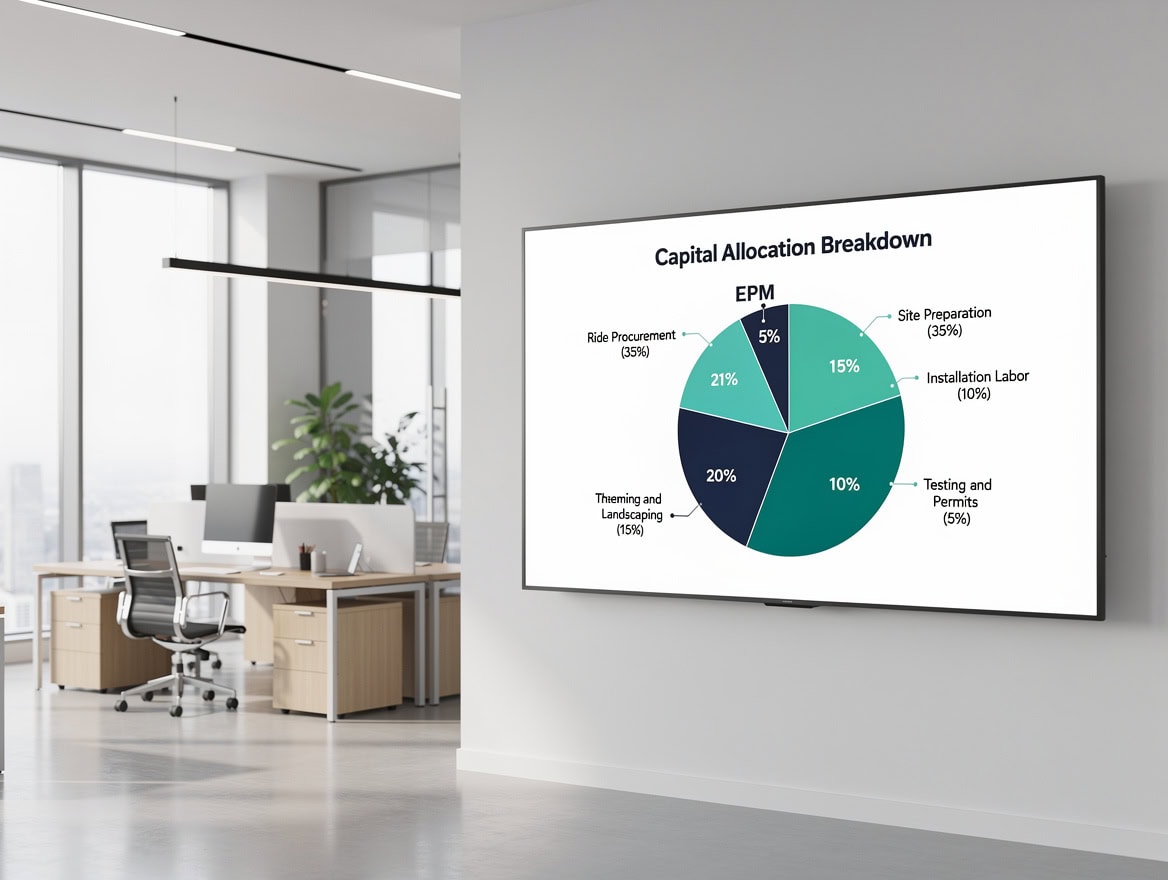
Ride procurement is the largest single line item but rarely exceeds 45% of total project cost on complex installations.
The Six Cost Categories Beyond Ride Procurement
- Site preparation and civil works: Grading, drainage, foundation engineering, and utility routing. On hilly or constrained sites, this alone can exceed the cost of a small coaster.
- Installation labor: Specialized crews for track assembly, structural steel erection, and mechanical systems. Labor costs vary significantly by region and union jurisdiction.
- Electrical and control systems: Modern coasters use programmable logic controllers (PLCs) and redundant safety systems that add $500K-$2M on larger installations.
- Theming and landscaping: Queue theming, station design, and surrounding landscaping. For IP-licensed attractions, theming can rival the ride cost itself.
- Testing and commissioning: Regulatory inspections, manufacturer sign-off, and soft-opening periods represent 60-120 days of carrying costs before revenue begins.
- Contingency reserve: Industry standard is 10-15% of total project cost. Omitting this from a financial model is a critical error on any project with custom engineering.
Wooden Roller Coasters: The $5-40 Million Spectrum Explained
Wooden roller coasters span a wide cost range because track length, height, and structural complexity scale non-linearly with price. A major wooden roller coaster is generally in the $5-10 million range to build (BGT Safari, 2026), while large-scale wooden coasters with extended track lengths and complex layouts reach $25-40 million (Coaster Me This, 2024). Under current IRS MACRS rules, certain amusement park ride components qualify as 7-year property (IRS), which meaningfully accelerates depreciation deductions in the early years of a coaster’s operating life and improves after-tax cash flow projections.
The primary cost drivers within the wooden coaster category are:
- Track length per dollar: Wooden coasters use significantly more lumber volume per foot of track than steel alternatives. Longer layouts multiply material and labor costs proportionally.
- Height premiums: Each additional 10 feet of lift hill height requires heavier structural support columns and more powerful lift chain systems, adding cost at an accelerating rate above 100 feet.
- Custom vs. catalog design: A catalog layout from an established manufacturer like Great Coasters International or Philadelphia Toboggan Coasters costs less than a fully custom design. Custom engineering adds 15-25% to the base ride cost.
- Manufacturer reputation and capacity: Lead times of 18-36 months are common for top-tier wooden coaster manufacturers, and high demand periods push prices upward.

Steel coasters command a 20-50% premium over comparable wooden layouts, driven by precision engineering, inversion capability, and launch system costs.
Steel Roller Coasters: Why the Premium Reaches $10-60 Million
Steel roller coasters command a premium over wooden coasters of comparable scale because tubular steel track enables inversions, higher speeds, and more complex element sequences that require precision engineering. A major steel coaster is typically between $10-25 million (BGT Safari, 2026), while large steel installations reach $35-60 million. Signature steel coasters with loops and high-speed elements can cost between $500,000 and $5 million or more for smaller installations (Isun Amusement, 2023), with the range expanding dramatically as complexity increases.
Key cost drivers unique to steel coasters:
- Inversion count: Each inversion (loop, corkscrew, zero-g roll) requires precision-bent tubular track sections manufactured to tight tolerances. A coaster with 7 inversions costs materially more per foot of track than a non-inverting layout.
- Launch systems: Linear synchronous motor (LSM) and linear induction motor (LIM) launch systems replace traditional chain lifts and add $1-4M to the base cost depending on launch speed targets.
- Manufacturer selection: Manufacturers like Bolliger and Mabillard (B&M), Intamin, and Mack Rides command premium pricing relative to regional manufacturers, but their throughput performance and reliability records often justify the premium in ROI models.
- Coating and corrosion protection: Steel track requires industrial coating systems and periodic repainting, adding to both initial cost and lifecycle maintenance budgets.
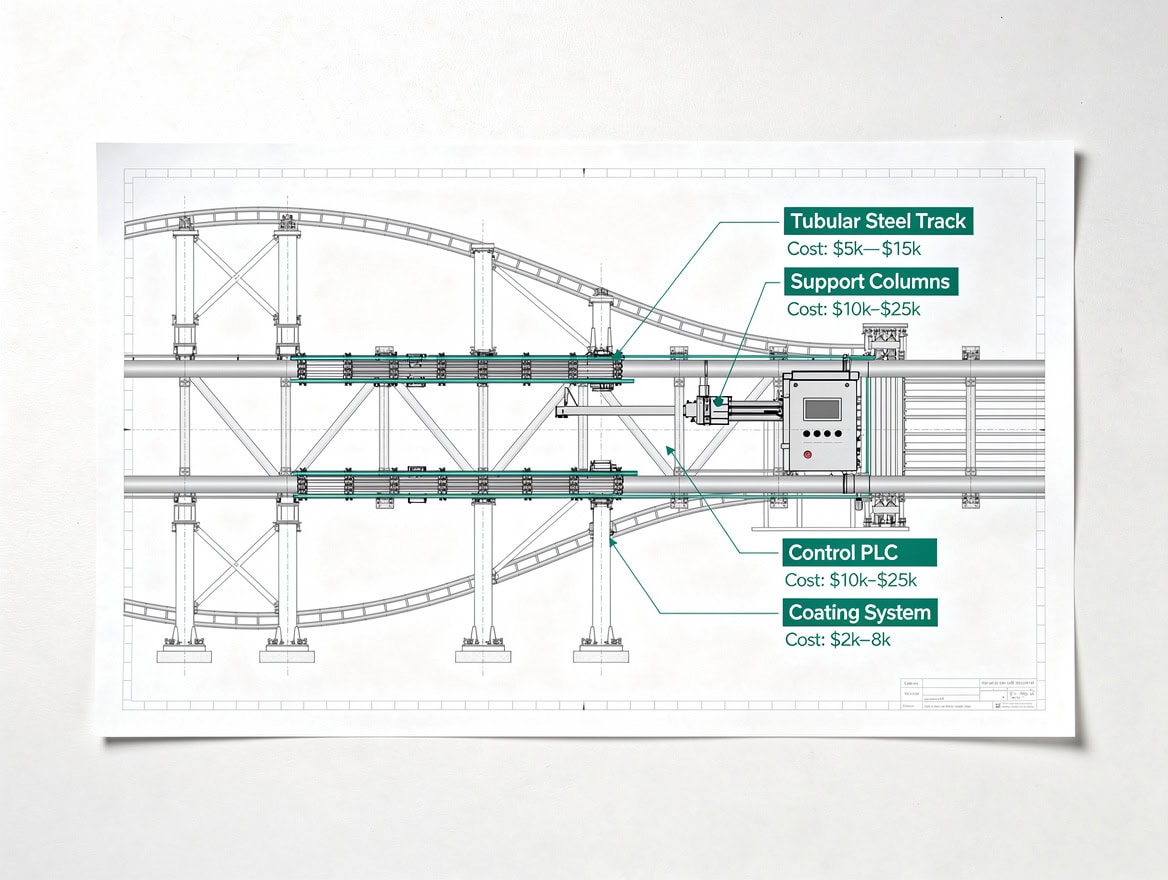
Launch systems alone add $1-4M to a steel coaster’s base cost, making element selection one of the highest-leverage decisions in project budgeting.
Case Study Analysis: ArieForce One and The Voyage
Two real-world projects illustrate the coaster-vs-project-cost gap and the importance of inflation-adjusted benchmarking.
ArieForce One at Fun Spot Atlanta (Steel, recent construction): The total project cost was $18 million, with $13 million allocated to the coaster itself (BGT Safari, 2026). The remaining $5 million, representing 28% of total project cost, covered site preparation, installation, infrastructure, and ancillary costs. This project sits at the lower end of the major steel coaster range and demonstrates that even a relatively modest steel installation carries a significant project cost multiplier.
The Voyage at Holiday World (Wooden, 2006): The coaster cost $6.5 million and the total project cost was $9.5 million (BGT Safari, 2026). The coaster represented 68% of total project cost, a higher proportion than the industry average, reflecting Holiday World’s existing infrastructure and efficient site conditions. Adjusted for construction cost inflation from 2006 to 2024 (approximately 80% cumulative based on ENR Construction Cost Index data), The Voyage’s $9.5M total project cost equates to roughly $17.1M in today’s dollars, placing it squarely in the current mid-tier wooden coaster range.
Premium Categories: Hypercoasters and Giga Coasters at $50-200+ Million
Hypercoasters (exceeding 200 feet in height) and giga coasters (exceeding 300 feet) represent a fundamentally different capital investment category. These attractions typically cost between $50 million and $100 million, and the largest projects reach $100-200+ million (Coaster Me This, 2024).
At this scale, the financial modeling framework shifts. The ride procurement cost remains 25-45% of total project cost, but the absolute dollar amounts involved mean that financing structure, depreciation strategy, and throughput modeling become the dominant variables in ROI analysis. A $150M giga coaster project requires:
- Throughput of 1,200-1,800 riders per hour to generate sufficient incremental revenue to service debt and achieve target returns
- A 25-30 year depreciation schedule to match the asset’s useful life
- Incremental attendance modeling: industry data suggests a signature coaster can drive 5-15% incremental attendance in its first full season
- Financing structures that may combine direct capital, municipal incentive bonds, and manufacturer-arranged financing
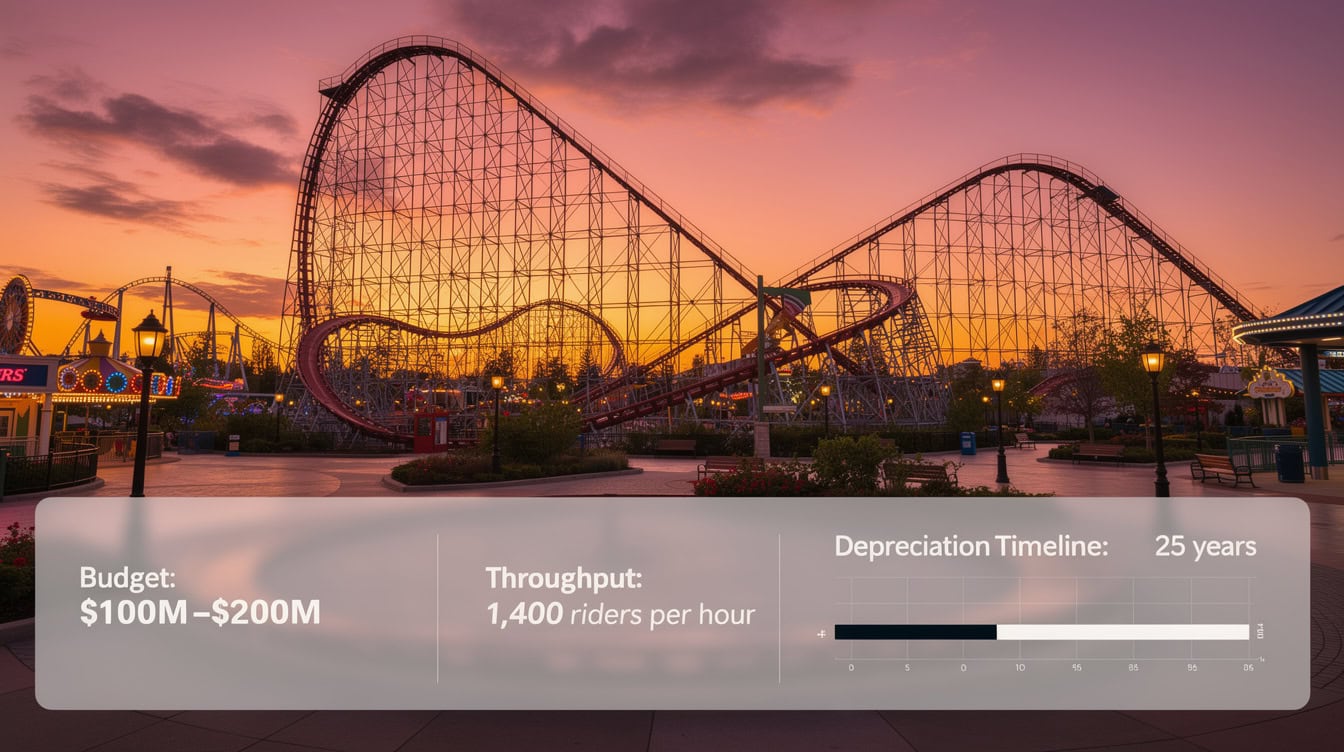
Giga coasters exceeding 300 feet require throughput of 1,200-1,800 riders per hour to generate the incremental revenue needed to service project-scale debt.
Beyond Construction: Total Cost of Ownership and Maintenance Economics
Total cost of ownership (TCO) is the sum of all costs associated with an asset over its useful life, including acquisition, operation, maintenance, and disposal. For roller coasters, TCO analysis consistently reveals that construction cost is the smaller half of the lifetime financial commitment.
Some wooden roller coasters require around $500,000 per year in maintenance and periodic rebuilds costing well over $1 million (BGT Safari, 2026). Over a 25-year operating life, that baseline maintenance spend totals $12.5M, plus $3-5M in periodic rebuilds, bringing the maintenance component alone to $15-17.5M on a coaster that may have cost $8M to build.
Steel coasters carry lower annual maintenance costs (typically $150,000-$300,000 per year for mid-tier installations) but require periodic wheel, brake, and track section replacements that can spike annual costs in years 8-12 and 18-22 of operation. The U.S. Bureau of Labor Statistics reports that construction and maintenance labor costs have risen by more than 40 percent over the past decade (U.S. Bureau of Labor Statistics), making it essential to apply a realistic annual escalator to any long-range maintenance cost projection rather than holding costs flat.
TCO modeling must include:
- Annual maintenance escalator: 3-4% per year to account for component aging and labor cost inflation
- Periodic rebuild reserve: fund $200,000-$400,000 per year into a capital reserve account
- Insurance and liability: typically 1.5-3% of replacement value annually
- Regulatory inspection and certification: $25,000-$75,000 per year depending on jurisdiction

A wooden coaster’s 25-year maintenance spend of $12.5M+ often exceeds its original construction cost, making TCO analysis non-negotiable for ROI modeling.
Budget Allocation Framework: Where Each Dollar Goes
A reliable budget allocation framework for roller coaster projects distributes total project cost across six categories. The percentages below reflect industry norms for a mid-tier steel coaster project in the $20-40M total cost range.
| Cost Category | % of Total Project Budget | Notes |
|---|---|---|
| Ride and attraction procurement | 25-45% | Manufacturer contract; largest single line item |
| Site preparation and civil works | 15-25% | Grading, drainage, foundations, utilities |
| Installation and structural labor | 10-20% | Varies by region, union status, site complexity |
| Theming, landscaping, and queue | 5-15% | Higher for IP-licensed or heavily themed attractions |
| Testing, commissioning, and permits | 3-7% | Regulatory inspections, soft-opening period costs |
| Contingency reserve | 10-15% | Non-negotiable on custom engineering projects |
For a $30M total project, this framework allocates $7.5-13.5M to the ride itself, $4.5-7.5M to site work, $3-6M to installation labor, $1.5-4.5M to theming, $900K-$2.1M to testing and permits, and $3-4.5M to contingency.
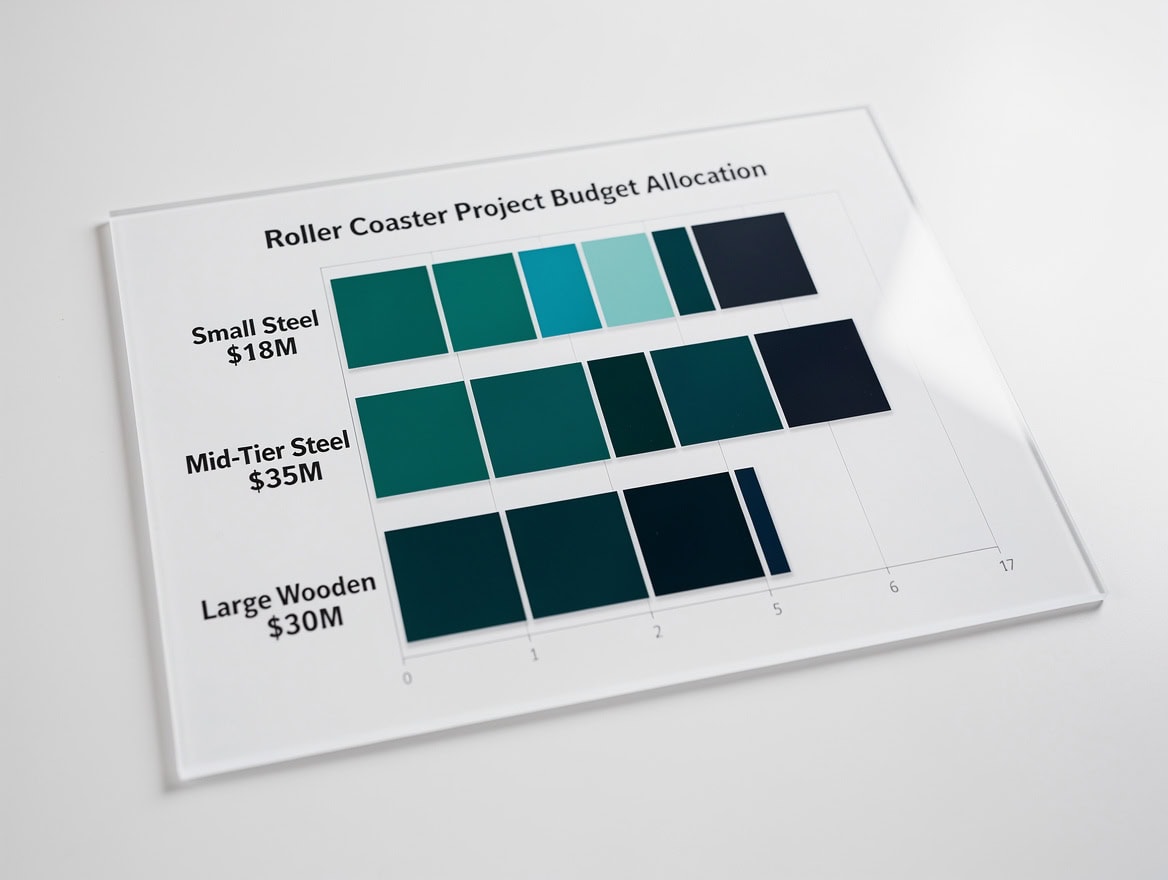
Budget allocation ratios shift as project scale increases, with theming and site preparation consuming larger shares on complex or IP-licensed installations.
Financial Modeling for Roller Coaster ROI: A Step-by-Step Approach
A rigorous ROI model for a roller coaster investment requires five components: capital cost projection, depreciation schedule, throughput-based revenue model, operating cost model, and NPV/IRR calculation.
Step 1: Establish fully loaded capital cost. Start with the manufacturer quote and apply the budget allocation framework above to derive total project cost. Add financing costs (interest during construction) if the project is debt-financed.
Step 2: Set depreciation schedule. Roller coasters are typically depreciated over 20-30 years using straight-line depreciation (equal annual deductions) for financial reporting. For tax purposes, accelerated depreciation methods may apply under current IRS rules for amusement park assets classified under MACRS (Modified Accelerated Cost Recovery System) as 7-year property for certain components.
Step 3: Model throughput-based revenue. Here’s the math for a mid-tier coaster:
- Throughput: 1,000 riders per hour
- Operating hours per day: 10
- Operating days per year: 150
- Incremental ticket revenue per rider: $8 (blended, accounting for season pass holders)
- Annual incremental revenue: 1,000 x 10 x 150 x $8 = $12,000,000
Step 4: Model operating costs. Annual maintenance ($500K for wooden, $200K for steel), staffing (2-4 operators per shift at $15-25/hour), utilities, and insurance. Total annual operating cost for a mid-tier coaster: $800K-$1.5M.
Step 5: Calculate NPV. Discount net annual cash flows (revenue minus operating costs) at your required rate of return (typically 8-12% for entertainment infrastructure) over the asset’s useful life. Subtract total capital cost to derive NPV. A positive NPV confirms the investment clears your hurdle rate.
For financial forecasting models that handle multi-year capital project analysis, pre-built templates save significant modeling time and reduce formula errors.

A defensible roller coaster ROI model requires all five components; omitting throughput degradation scenarios is the most common analytical gap.
Cost Drivers and Variables That Determine Your Final Investment
Seven variables drive the widest cost variance within each coaster category. Understanding these lets operators and investors stress-test their financial models before committing capital.
- Track length: Cost scales roughly linearly with track length. A 3,000-foot wooden coaster costs approximately 40% more than a 2,100-foot layout from the same manufacturer.
- Height: Structural costs increase non-linearly above 100 feet. Each 50-foot increment above 150 feet adds disproportionate foundation and support column costs.
- Element complexity: Inversions, launches, and multi-launch sequences each add $500K-$2M to steel coaster costs.
- Site conditions: Rocky terrain, high water tables, or constrained urban sites can double civil engineering costs relative to a greenfield suburban site.
- Manufacturer lead time and demand: Booking a top-tier manufacturer during a high-demand period adds 10-20% to the base price.
- Theming intensity: A coaster with minimal theming costs 5-8% of total project budget on aesthetics. A fully themed IP-licensed attraction can spend 20-30% on theming alone.
- Regulatory jurisdiction: Some states and countries require third-party engineering certification for every design element, adding $200K-$500K in compliance costs.
For forecasting capital expenditure across multiple park attractions, a structured model that captures these variables as adjustable inputs is essential for scenario analysis.
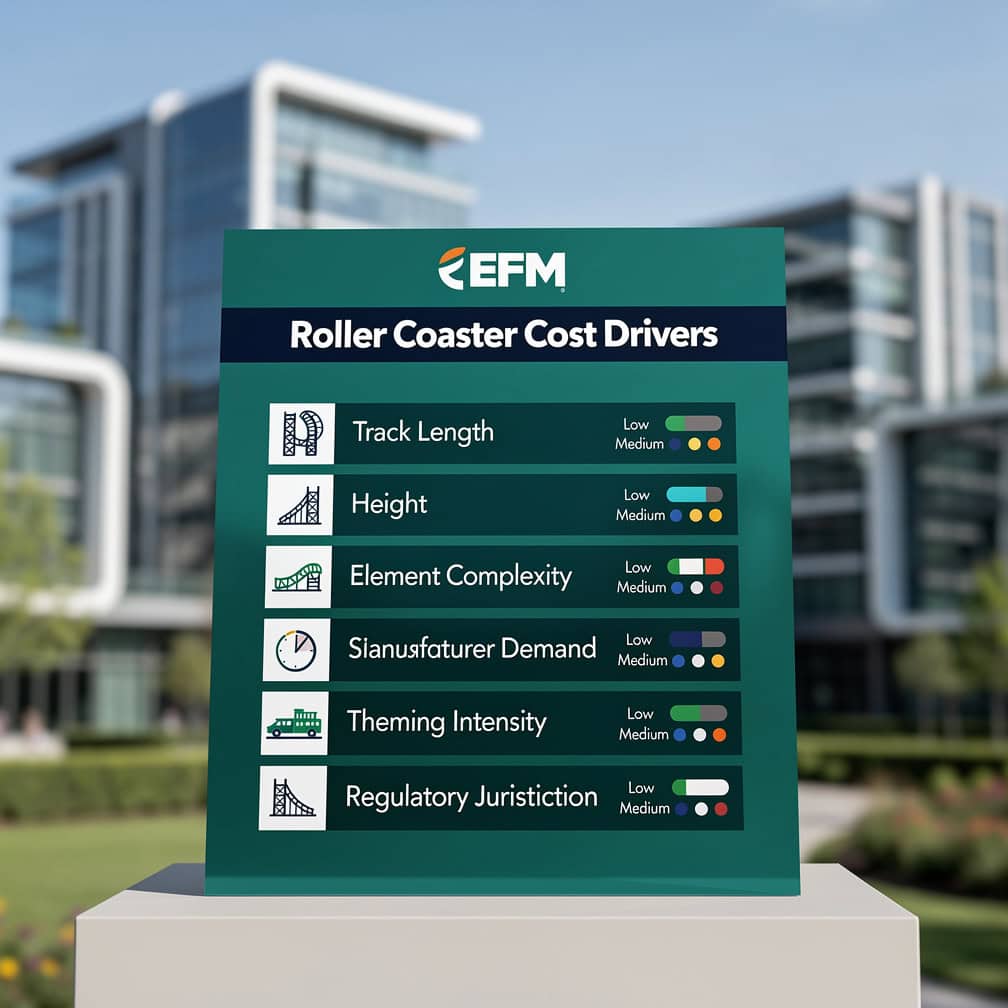
Site conditions and theming intensity are the two most frequently underestimated cost drivers in roller coaster project budgets.
Risk Management: Controlling Cost Overruns in Multi-Million Dollar Coaster Projects
Cost overruns in roller coaster construction follow predictable patterns. Identifying them in advance is the core function of a well-structured risk management plan.
Common Pitfall 1: Underestimating site preparation costs. Fix: Commission a full geotechnical survey before finalizing the project budget. Budget $150K-$300K for the survey; it routinely prevents $1-3M in surprise costs.
Common Pitfall 2: Omitting contingency reserves. Fix: Lock in a 10-15% contingency line item before the project is approved. Any value engineering that reduces the base cost should flow to contingency, not back to the operating budget.
Common Pitfall 3: Ignoring financing carry costs. Fix: Model interest during construction as a capital cost. A $20M project financed at 6% over an 18-month construction period carries $1.8M in interest before the ride opens.
Common Pitfall 4: Using unadjusted historical cost benchmarks. Fix: Adjust all historical project costs to current dollars using the ENR Construction Cost Index before using them as comparables. The Voyage’s 2006 costs are not a valid benchmark for a 2025 project without inflation adjustment.
Common Pitfall 5: Failing to model throughput degradation. Fix: Model attendance and throughput at 100%, 80%, and 60% of design capacity. A coaster that only achieves 70% of projected ridership due to operational downtime or weather can turn a positive NPV project negative.
For capital project financial modeling that incorporates sensitivity analysis and scenario planning, structured templates with pre-built risk variables reduce the chance of missing a critical cost driver.
Omitting contingency reserves and using unadjusted historical benchmarks are the two highest-probability, high-impact risks in roller coaster project budgeting.
Frequently Asked Questions
How much does it cost to build a roller coaster in 2025?
The cost depends heavily on coaster type and scale. A major wooden roller coaster runs $5-10 million for the ride itself, with total project costs of $9-18 million once site preparation, installation, and infrastructure are included. A major steel coaster costs $10-25 million for the ride, with total project costs reaching $18-45 million. Large wooden coasters scale to $25-40 million in total project cost, while large steel coasters reach $35-60 million. Premium hypercoasters and giga coasters start at $50 million and can exceed $200 million for the largest installations. All figures should be treated as 2024-2025 benchmarks; projects planned for 2026-2027 should apply a 3-5% annual construction cost escalator to account for ongoing inflation in materials and labor.
What percentage of a roller coaster project budget goes to the ride itself?
Ride and attraction procurement typically accounts for 25-45% of a park’s total project budget. The ArieForce One project illustrates this precisely: the $13 million coaster represented 72% of the $18 million total project cost, which is above the typical range due to the project’s relatively straightforward site conditions. On more complex projects with extensive theming or challenging site conditions, the ride can represent as little as 25% of total cost. This means that for every dollar you budget for the coaster, you should plan for $1.20-$3.00 in additional project costs. Financial models that use only the manufacturer quote as the capital cost will systematically understate total investment by 55-75%.
How do you calculate ROI for a roller coaster investment?
ROI for a roller coaster uses net present value (NPV) analysis. Start with total project cost as the initial capital outflow. Then model annual net cash flows: throughput (riders per hour) multiplied by operating hours, operating days, and incremental revenue per rider, minus annual operating costs including maintenance, staffing, insurance, and utilities. Discount those annual net cash flows at your required rate of return (8-12% is typical for entertainment infrastructure) over the asset’s 20-30 year useful life. For example, a coaster generating $12M in annual incremental revenue against $1.2M in operating costs produces $10.8M in annual net cash flow. At a 10% discount rate over 25 years, the present value of that cash flow stream is approximately $98M, which would justify a total project cost well above $50M.
What are the annual maintenance costs for a roller coaster?
Wooden roller coasters require approximately $500,000 per year in maintenance, plus periodic structural rebuilds that can exceed $1 million per event. These rebuilds typically occur every 8-12 years and involve replacing significant portions of the track and structure. Steel coasters carry lower annual maintenance costs, typically $150,000-$300,000 per year for mid-tier installations, but require periodic wheel assembly replacements, brake system overhauls, and track section replacements that can spike costs in specific years. Any financial model for a roller coaster investment must include a maintenance cost escalator of 3-4% per year and a capital reserve fund for periodic rebuilds. Omitting these costs from a TCO analysis will overstate project returns by 15-25% over a 20-year horizon.
How long does it take to build a roller coaster, and how does that affect financing costs?
Construction timelines for roller coasters range from 12 months for smaller steel installations to 24-36 months for large custom wooden or premium steel coasters. During construction, the project generates no revenue while consuming capital and accruing interest on any debt financing. A $30M project financed at 6% annual interest over an 18-month construction period carries $2.7M in interest before the first rider boards. This carry cost must be included in the total capital cost for NPV calculations. Longer timelines also increase exposure to material cost inflation: a 24-month project that experiences 5% annual steel price inflation on a $15M steel procurement contract adds $750,000 in unbudgeted cost. Locking in material prices through fixed-price manufacturer contracts is the primary mitigation strategy.
What financing structures do theme parks use for roller coaster projects?
Theme parks use four primary financing structures for major coaster projects. Direct capital deployment from operating cash flow or equity is common for smaller projects under $15M. Debt financing through commercial construction loans or revolving credit facilities is standard for mid-tier projects, with loan-to-cost ratios of 50-70% typical for established operators. Municipal incentive bonds or tax increment financing (TIF) districts are available in some jurisdictions where parks can demonstrate significant economic impact. Manufacturer-arranged financing, where the coaster manufacturer provides installment payment terms, is available from some European manufacturers and can reduce upfront capital requirements. For parks evaluating multiple financing scenarios, a financial forecasting model that compares after-tax cost of capital across structures is essential for selecting the optimal approach.
How do hypercoasters and giga coasters justify their $50-200 million price tags?
Hypercoasters and giga coasters justify their premium through three financial mechanisms. First, they drive disproportionate incremental attendance: a signature giga coaster can generate 10-15% incremental park attendance in its first full season, translating to tens of millions in additional gate, food, beverage, and merchandise revenue. Second, they extend the park’s competitive moat by creating a multi-year window where no regional competitor can match the attraction without a comparable capital commitment. Third, they support premium pricing: parks with signature coasters consistently charge 8-15% higher gate prices than comparable parks without them. At $100M total project cost and a 10% discount rate, a giga coaster needs to generate approximately $11M in annual net incremental cash flow to break even on an NPV basis, which is achievable for parks with 2M+ annual visitors where the coaster drives meaningful attendance and per-capita spending uplift.
Conclusion
Roller coaster construction costs span a $5M-$200M+ range, but the financial planning discipline required is consistent across all project sizes: model total project cost (not just ride procurement), build a rigorous TCO analysis that captures 25 years of maintenance escalation, and stress-test your throughput assumptions before committing capital. The gap between a $13M coaster and an $18M total project is not a rounding error; it is a 38% understatement of capital deployment that will distort every downstream ROI calculation.
I recommend downloading the Capital Project Financial Model from eFinancialModels to build custom ROI projections for your roller coaster or theme park attraction investment. The template includes pre-built depreciation schedules, maintenance cost escalators, throughput-based revenue drivers, and sensitivity analysis across key assumptions, giving you a defensible financial model from day one of your project evaluation.

























































