
0 ITEMS

Aquaponics Business Model: $5K–$15K Startup Cost Breakdown
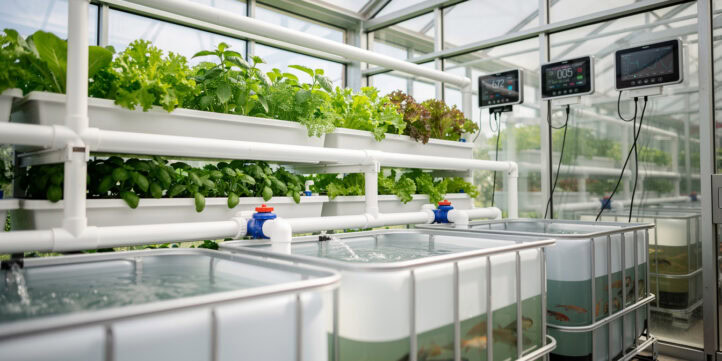
An aquaponics business combines fish farming (aquaculture) and soil-less plant growing (hydroponics) into one closed-loop system that generates two revenue streams simultaneously: fish sales and produce sales.
Key Takeaways
- A hobby-scale aquaponics system costs $5,000–$15,000 to set up, with IBC tanks ($200–$800), grow beds ($300–$1,200), and water quality sensors ($300–$2,000) as the three largest line items.
- Two revenue streams, fish and produce, produce blended gross margins of 45–65% when you sell direct-to-consumer at farmers markets versus 20–35% at wholesale.
- First-year operators should budget for 15–25% below optimal yields due to the learning curve, and plan for system cycling of 4–6 weeks before any harvest is possible.
- Breakeven arrives at months 4–9 for hobby-scale operations and months 12–18 for commercial farms; Year 2 net margins of 15–25% are achievable with disciplined cost control.
- The US aquaponics market is growing at a compound annual growth rate (CAGR) of roughly 13–14% through 2030, driven by USDA-tracked organic produce demand and the local food movement.
- SBA microloans cover $10,000–$25,000 for equipment; SBA 7(a) loans cover $50,000–$150,000 for lease plus working capital, typically at 7–10% interest.
- Adding a second system in Year 3 doubles output but increases fixed costs by only about 30%, making scale the most powerful lever in aquaponics unit economics.
Aquaponics Business Model Fundamentals: The Two-Revenue-Stream Ecosystem
An aquaponics system earns money from two biological outputs at the same time: fish protein and plant produce. Fish waste, rich in ammonia, feeds beneficial bacteria (specifically nitrifying bacteria such as Nitrosomonas and Nitrobacter) that convert ammonia first into nitrite, then into nitrate, a form plants absorb directly. The plants filter the water, which cycles back to the fish tanks clean. This nitrogen cycle is the engine of the business model.
The dual-revenue structure is what separates aquaponics from pure hydroponics or pure aquaculture. A 100-square-foot system stocked with 50–100 tilapia can produce 10–40 pounds of leafy greens per month alongside periodic fish harvests. Tilapia reach market weight of 1–2 pounds in 6–9 months. Leafy greens like lettuce and basil are ready in 4–6 weeks, giving you a faster cash cycle on the plant side while fish inventory matures.
Three scale tiers define the business:
- Backyard hobby: $5,000–$15,000 setup, $500–$1,500/month revenue potential
- Urban micro-farm: $15,000–$50,000 setup, $3,000–$8,000/month revenue potential
- Commercial greenhouse: $100,000+ setup, $20,000+/month revenue potential
Choose your tier before you buy a single tank. Capital requirements, regulatory obligations, and customer acquisition strategies differ dramatically across these three categories.
Scale tier determines capital requirements, regulatory obligations, and customer acquisition strategy — choose before buying equipment.
Market Opportunity: US Aquaponics Industry Size, Growth, and Regulatory Landscape
The US aquaponics market is expanding rapidly, fueled by consumer demand for locally grown, pesticide-free food. According to the USDA Economic Research Service, organic food sales in the United States exceeded $67 billion in 2023, with leafy greens and fresh herbs among the fastest-growing categories. The aquaponics segment specifically is projected to grow at a CAGR of approximately 13–14% through 2030, reaching an estimated total addressable market of $1.5–$2.5 billion in the US alone, based on industry tracking by the USDA Agricultural Marketing Service.
Regulatory complexity is the most underestimated barrier to entry. Requirements vary significantly by state:
- California: Requires an Aquaculture Registration from the California Department of Fish and Wildlife plus compliance with the State Water Resources Control Board for discharge.
- Texas: Aquaculture dealers need a license from Texas Parks and Wildlife; produce sold at retail may trigger Cottage Food Law exemptions up to $50,000 in annual sales.
- New York: Commercial aquaculture requires a permit from the DEC; farms selling over $25,000 in produce annually may need FDA Produce Safety Rule compliance.
- Florida: One of the more permissive states; aquaculture certificates are issued by the Florida Department of Agriculture and Consumer Services, and many small operations qualify for agricultural exemptions.
The FDA Produce Safety Rule (part of FSMA, the Food Safety Modernization Act) applies to farms with more than $25,000 in average annual produce sales over a 3-year period (FDA). Budget $500–$3,000 for permits and business licenses in your startup cost model, and add a legal review line of $500–$1,500 if you operate in a high-regulation state.

Regulatory complexity varies dramatically by state: California requires DFW registration while Florida offers simpler agricultural certificates.
Startup Cost Waterfall: Itemized Equipment and Licensing ($5K–$15K Base System)
A hobby-to-micro-farm system’s startup costs break into eight distinct line items. Every number below reflects a 100–500 gallon system capable of supporting 50–200 fish.
| Line Item | Low Estimate | High Estimate | Notes |
|---|---|---|---|
| IBC Tote Tanks | $200 | $800 | 275-gallon food-grade totes |
| Air Pumps and Stones | $150 | $300 | Redundant backup unit recommended |
| Grow Beds and Media | $300 | $1,200 | Hydroton clay pebbles or gravel |
| Plumbing and Fittings | $200 | $500 | Bell siphons, bulkheads, PVC |
| Water Quality Sensors | $300 | $2,000 | pH, ammonia, DO, temperature |
| Initial Fish Stock | $100 | $400 | 50–150 tilapia fingerlings |
| Seedlings and Seeds | $50 | $200 | Lettuce, basil, kale starts |
| Permits and Licenses | $500 | $3,000 | State-dependent |
| Total | $1,800 | $8,400 | Add 20–40% contingency |
Apply a 20–40% contingency buffer on top of the equipment subtotal. First-time builders consistently underestimate plumbing labor, replacement parts during cycling, and the cost of fish mortality in the first 60 days. A realistic all-in budget for a functional hobby system is $5,000–$15,000 once you include contingency, initial feed supply, and a basic insurance policy.
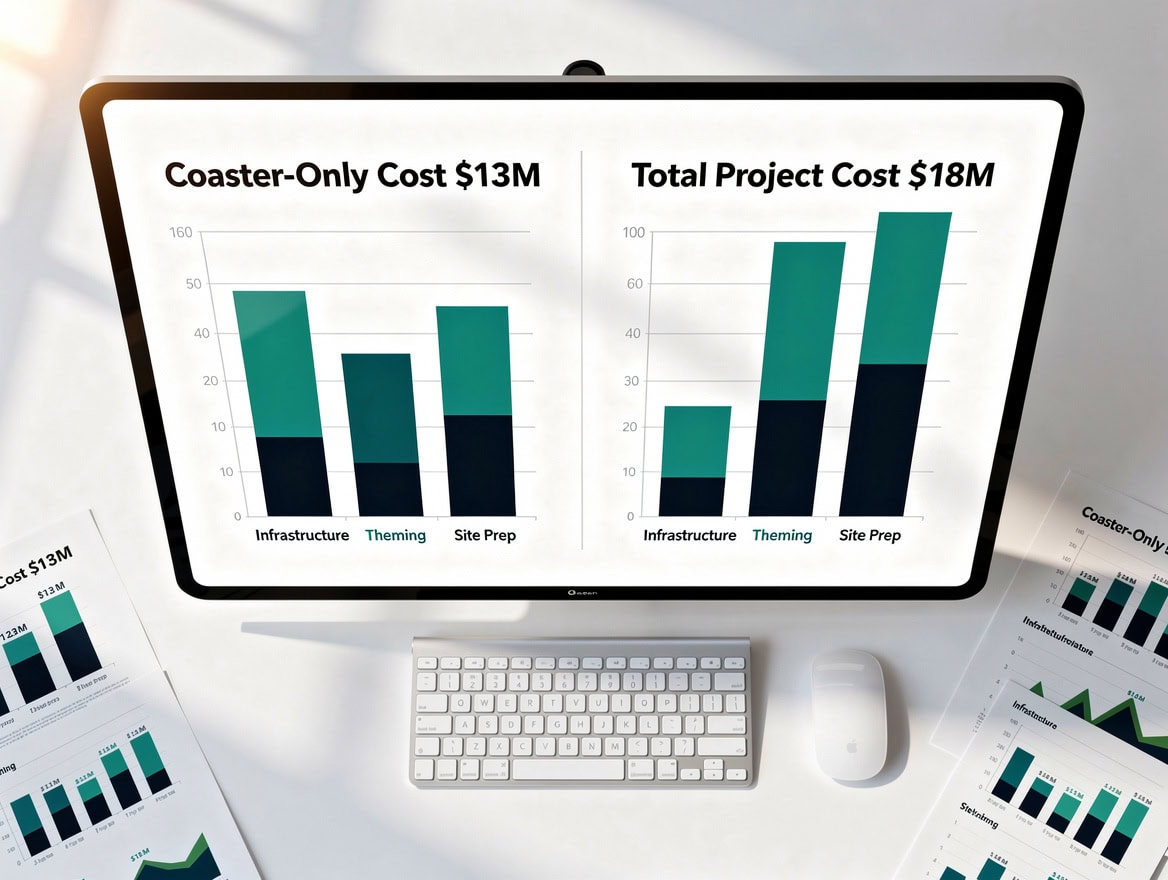
Water quality sensors ($300–$2,000) and permits ($500–$3,000) are the two most variable line items in the startup cost waterfall.
Monthly Operating Expenses: Feed, Utilities, Labor, and Maintenance by Scale
Monthly operating costs for an aquaponics system are predictable once the system stabilizes, but they scale non-linearly with fish count and grow bed area.
| Expense | Hobby (50 fish) | Micro-Farm (200 fish) | Commercial (500+ fish) |
|---|---|---|---|
| Fish Feed | $50–$75/mo | $100–$150/mo | $300–$600/mo |
| Electricity | $40–$60/mo | $80–$120/mo | $200–$500/mo |
| Water Top-Up | $10–$15/mo | $20–$30/mo | $50–$150/mo |
| Labor (DIY vs. hired) | $0–$200/mo | $400–$800/mo | $2,000–$5,000/mo |
| Maintenance Reserve | $30–$50/mo | $50–$75/mo | $150–$300/mo |
| Total Monthly OpEx | $130–$400/mo | $650–$1,175/mo | $2,700–$6,550/mo |
Electricity is the most volatile cost. A 100-gallon system running a submersible pump, air pump, and grow lights consumes roughly 150–300 kWh per month. At the US average residential electricity rate of approximately 16.02 cents per kWh (U.S. Energy Information Administration), that translates to $24–$48 per month in electricity alone for the smallest systems, rising sharply if you add supplemental lighting for year-round production.
Labor deserves special attention. DIY operators at hobby scale can manage daily feeding, water testing, and harvesting in 30–60 minutes per day. At micro-farm scale, expect 15–25 hours per week of skilled labor at $15–$25 per hour, or $900–$2,500 per month. Hiring part-time help before revenue justifies it is the single fastest way to destroy early-stage margins.
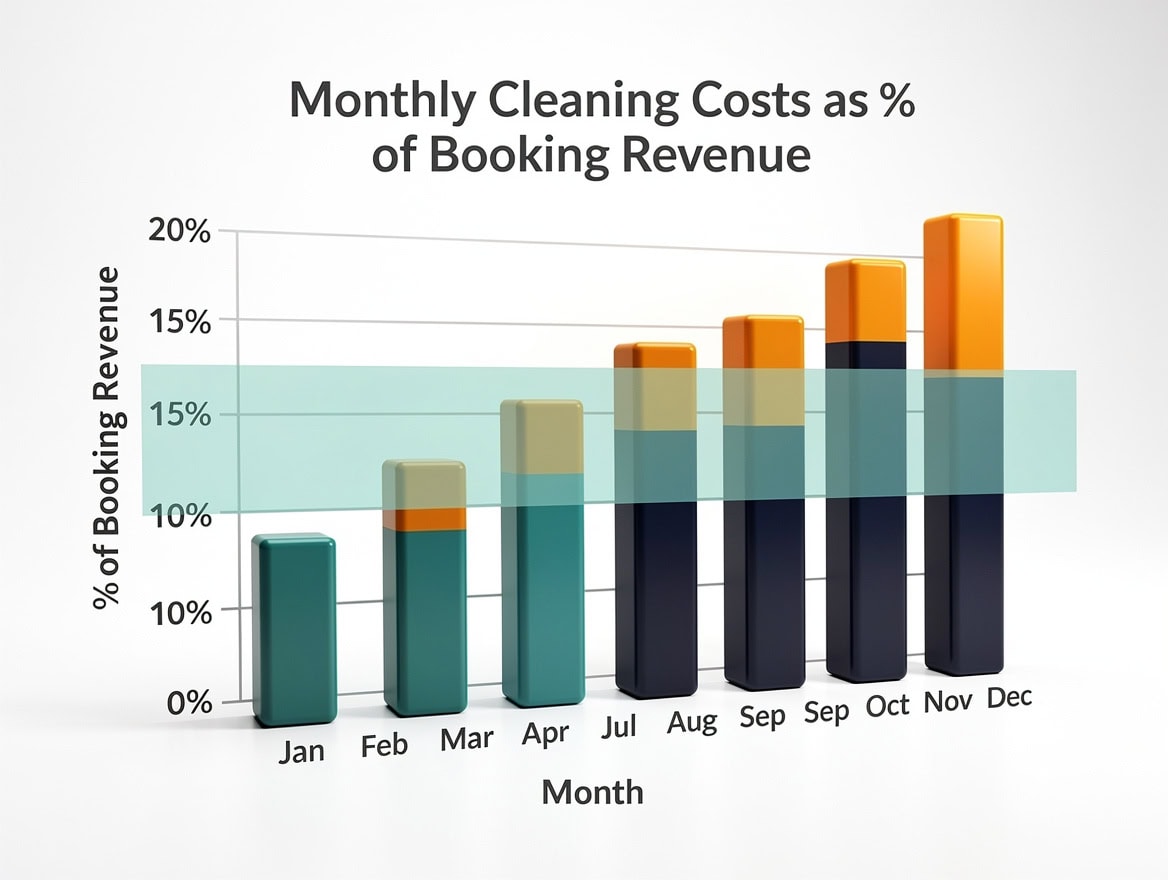
Labor is the largest and most controllable operating cost: DIY at hobby scale saves $400–$800/month versus hiring part-time help.
Revenue Model: Fish and Produce Pricing, Wholesale vs. DTC Margins
Aquaponics revenue comes from two streams with very different margin profiles depending on your sales channel.
Fish Revenue:
Tilapia at market weight (1–2 lbs) sells for $4–$7 per pound wholesale and $8–$12 per pound direct-to-consumer. A 100-gallon system stocked at moderate density (50 fish) produces roughly one harvest cycle every 6–9 months. At 80% survival rate and 1.5 lb average market weight, that’s 60 lbs of fish per cycle, or $240–$420 wholesale and $480–$720 DTC per harvest.
Produce Revenue:
Leafy greens from a 100-square-foot grow bed yield 10–40 lbs per month depending on species and light conditions. Wholesale pricing runs $3–$6 per pound; farmers market pricing runs $8–$15 per pound. At a conservative 20 lbs per month and $10 per pound DTC, that’s $200 per month from produce alone, or $2,400 per year from a single 100-square-foot bed.
Blended Gross Margin by Channel:
| Channel | Fish Margin | Produce Margin | Blended Margin |
|---|---|---|---|
| Wholesale | 20–30% | 25–35% | 22–32% |
| Farmers Market (DTC) | 55–65% | 60–70% | 57–67% |
| Restaurant Direct | 35–45% | 40–50% | 37–47% |
| CSA Subscription | 50–60% | 55–65% | 52–62% |
The DTC channel delivers the highest margins but also the highest customer acquisition costs. Expect to spend $15–$40 per farmers market customer and $200–$800 per CSA subscriber. Restaurant and grocer accounts take 2–4 months to onboard but provide predictable weekly volume once established.
Farmers market DTC delivers 57–67% blended gross margins versus 22–32% wholesale — the channel mix is the single biggest margin lever.
Three-Year Unit Economics: Launch to Breakeven to 20%+ Net Margin
Here is a worked numerical example for a hobby-scale system targeting the farmers market channel.
Assumptions:
- Setup cost: $10,000 (mid-range)
- Monthly OpEx: $300 (DIY labor, 50 fish)
- Monthly produce revenue (starting Month 5 after cycling): $400
- Fish harvest revenue (Month 9): $600 one-time
- Year 1 yield penalty: 20% below optimal (learning curve)
Year 1 Cash Flow Summary:
- Months 1–4: System cycling, zero revenue, $300/month OpEx burn = $1,200 total burn
- Months 5–8: Produce revenue $320/month (80% of $400 due to yield penalty), OpEx $300/month, net cash flow = +$20/month
- Month 9: Fish harvest adds $480 (80% of $600), cumulative net = roughly breakeven on monthly OpEx
- Total Year 1 cash outflow (setup + OpEx + yield losses): approximately $13,200
- Total Year 1 revenue: approximately $2,040
- Year 1 net loss: approximately $11,160 (primarily the capital investment)
Year 2 Targets:
- Full yield achieved, monthly produce revenue: $500
- Two fish harvests: $1,200 total
- Annual revenue: $7,200
- Annual OpEx: $3,600
- Gross profit: $3,600 (50% margin)
- After depreciation ($1,000/year on $10K system over 10 years): Net income $2,600
- Net margin: 36% (hobby scale, DIY labor)
Year 3 Scale Scenario (adding a second system):
- Second system capital cost: $8,000 (experience reduces setup cost 20%)
- Fixed costs increase only 30% (shared infrastructure, same operator)
- Revenue doubles to approximately $14,400
- OpEx rises to $5,400
- Net income: approximately $7,000
- Net margin: 49%
The payback period on the initial $10,000 investment, at Year 2 net income of $2,600, is approximately 3.8 years. Adding the second system in Year 3 compresses the blended payback to under 3 years on total invested capital.
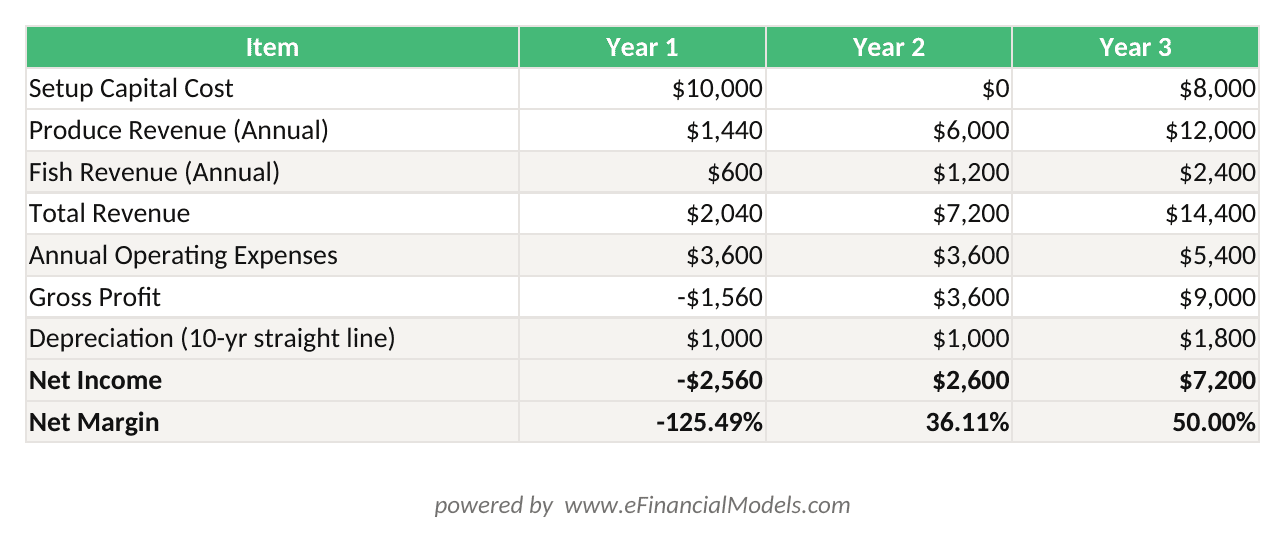
Year 1 cumulative loss of ~$11,160 is primarily the $10,000 capital investment; Year 2 net margin reaches 36% with DIY labor and DTC pricing.

Adding a second system in Year 3 doubles revenue but increases fixed costs by only 30%, compressing blended payback to under 3 years.
Financing Your Aquaponics Farm: SBA Loans, Angel Funding, and Agricultural Grants
Aquaponics qualifies for agricultural financing under USDA and SBA programs, but you need to structure your application correctly.
SBA Microloan Program: Loans of $10,000–$25,000 for equipment purchases, working capital, and inventory. Interest rates typically run 8–13%. No collateral required below $20,000. Aquaponics qualifies as agriculture under SBA’s NAICS code 111419 (Other Food Crops Grown Under Cover). According to the SBA, the average microloan amount in fiscal year 2023 was approximately $16,000 (SBA).
SBA 7(a) Loan Program: Covers $50,000–$150,000 for lease deposits, greenhouse construction, and working capital. Interest rates run 7–10% (prime plus 2.25–4.75%). Expect to provide 10–20% equity injection and collateral (equipment, real property). Approval timelines run 60–90 days.
Angel Investors and Agtech Pre-Revenue Valuations: Pre-revenue aquaponics proof-of-concept systems typically attract angel valuations of $100,000–$500,000, depending on system size, location, and founding team experience. Agtech-focused angel networks such as AgFunder track deal flow in this space.
Grant Programs:
- USDA SARE (Sustainable Agriculture Research and Education): Grants of $7,500–$30,000 for farmer-led research projects, including aquaponics trials.
- USDA NIFA Beginning Farmer and Rancher Development Program: Competitive grants for training and education; aquaponics operations qualify (USDA NIFA).
- State-level agricultural development grants vary; check your state’s Department of Agriculture for matching fund programs.
For startup financial models that structure SBA loan applications, pre-built templates save 20–40 hours of spreadsheet work and arrive in a format lenders recognize.
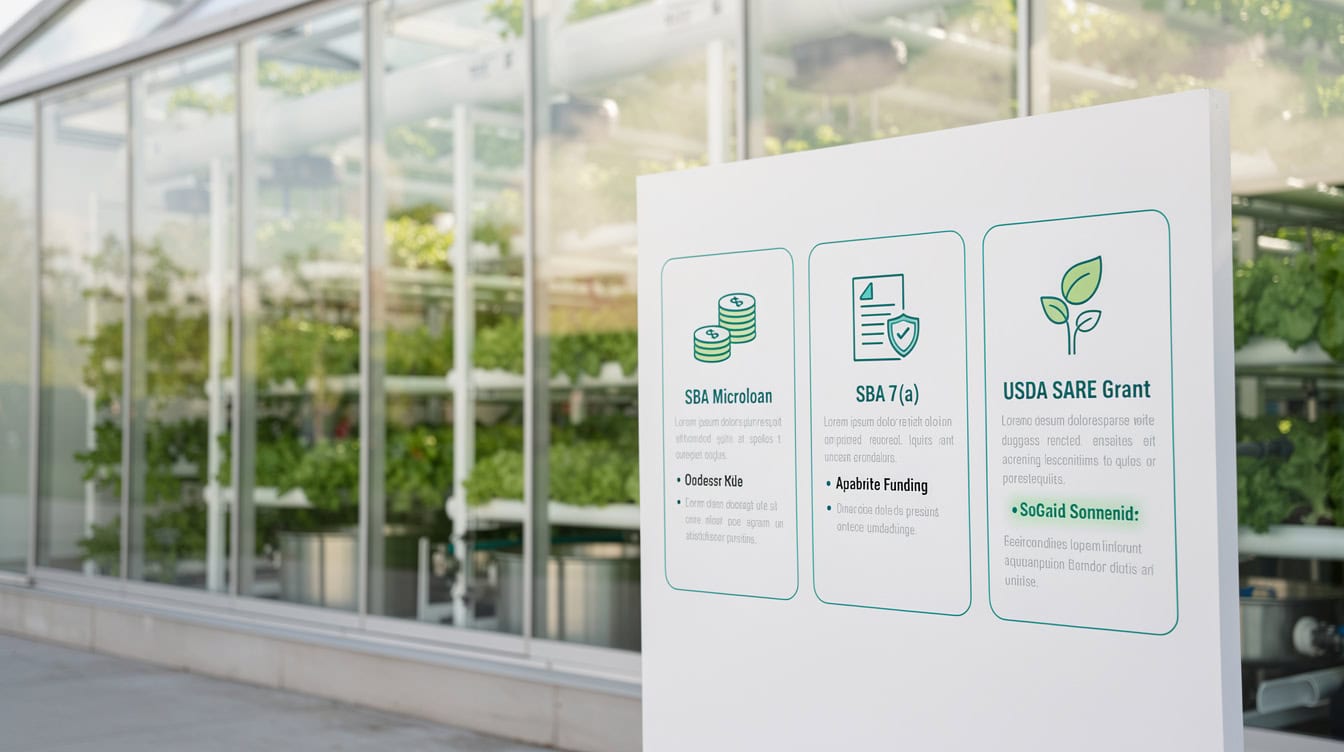
USDA SARE grants provide non-dilutive capital for proof-of-concept systems — apply before seeking SBA debt to reduce leverage.
The 5-Year Pro Forma: Cash Flow, Sensitivity Analysis, and ROI Scenarios
A bankable aquaponics pro forma covers five years with three levels of granularity: monthly for Year 1, quarterly for Years 2–3, and annual for Years 4–5.
Core Model Structure:
| Section | Key Outputs |
|---|---|
| Revenue Schedule | Fish harvest by cycle, produce by month, channel mix |
| OpEx Model | Feed, electricity, water, labor, maintenance |
| Capital Schedule | Setup costs, depreciation, replacement reserves |
| Cash Flow Statement | Monthly burn, breakeven month, cumulative cash |
| Sensitivity Table | Fish mortality (5–15%), yield variance (±20%), price erosion (10–30%) |
| IRR and Payback | Project-level IRR, equity IRR, discounted payback period |
| Scale Milestones | 1-system, 3-system, 10-system scenarios |
Sensitivity Analysis: Three Key Variables
Fish mortality rate is the highest-variance input. At 5% mortality, a 100-fish system delivers 95 fish to harvest. At 15% mortality (common in Year 1), you deliver only 85 fish, reducing fish revenue by 10.5% and potentially triggering a restocking cost of $50–$150. Model all three scenarios: base (10% mortality), optimistic (5%), and stress (15%).
Crop yield variance of plus or minus 20% swings monthly produce revenue by $80–$160 on a $400 base. Price erosion of 10–30% matters most in saturated local markets; if three other aquaponics farms open within your farmers market radius, expect DTC pricing pressure within 18–24 months.
For a DCF model framework that handles these sensitivity inputs with pre-built scenario toggles, a structured template reduces modeling errors and speeds up investor presentations.
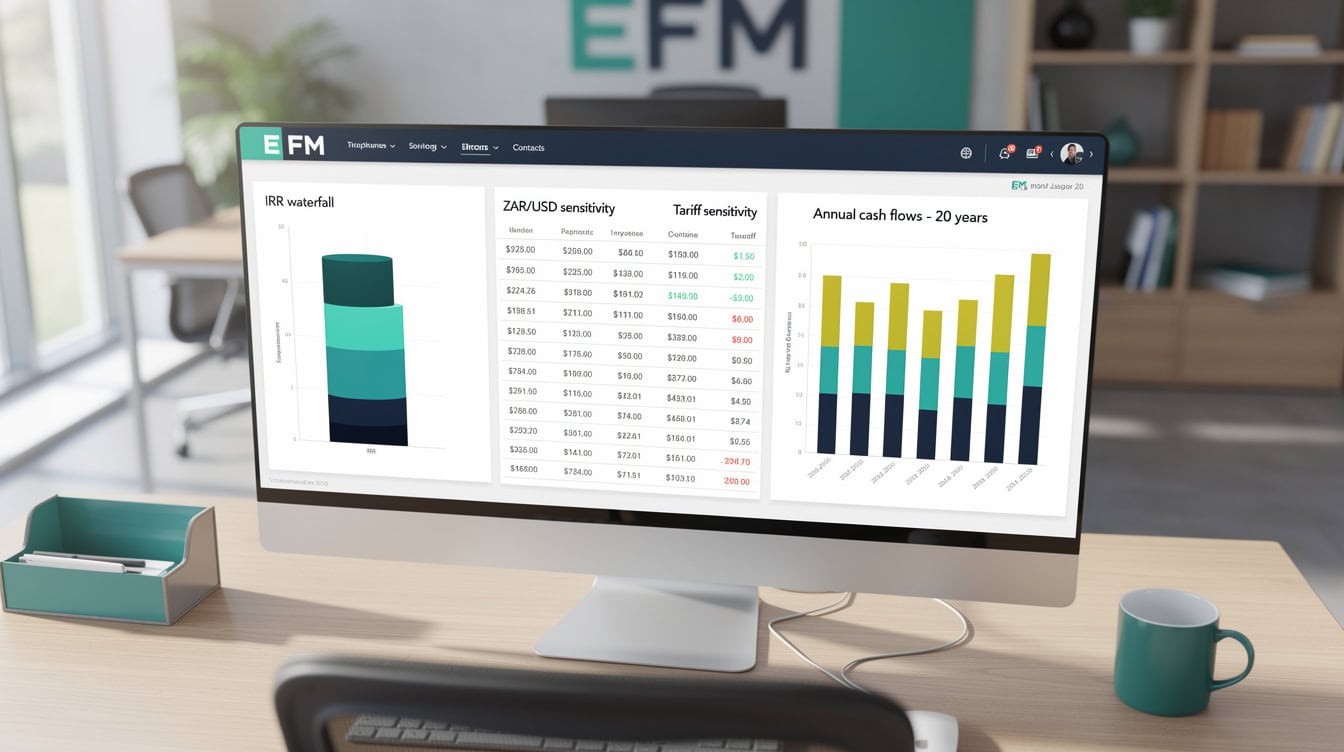
Fish mortality rate is the highest-variance input: moving from 5% to 15% mortality reduces fish revenue by 10.5% and triggers restocking costs.
Critical Success Factors: System Cycling, Customer Acquisition, and Scaling
The four operational milestones that determine whether an aquaponics business reaches profitability are system cycling, first harvest, customer acquisition, and wholesale onboarding.
System Cycling (Weeks 1–6): Before any fish or plants enter the system, beneficial bacteria must colonize the biofilter. This process, called the nitrogen cycle, takes 4–6 weeks. You can accelerate it by seeding with established media from a mature system or using commercial bacterial supplements. Do not stock fish before ammonia and nitrite levels stabilize at near-zero. Rushing this step causes mass fish mortality and restarts your timeline.
First Harvest Windows:
- Leafy greens (lettuce, basil, kale): 4–6 weeks from transplant
- Tilapia to market weight: 6–9 months from fingerling
Customer Acquisition Costs by Channel:
- Farmers market: $15–$40 per customer (booth fees, samples, signage)
- CSA subscriber: $200–$800 per subscriber (marketing, trial boxes, referral programs)
- Restaurant account: $300–$1,200 per account (sales calls, samples, relationship time)
- Wholesale grocer: $500–$2,000 per account (broker fees, compliance paperwork, slotting)
Restaurant and grocer accounts require 2–4 months of lead time before the first purchase order. Build that lag into your cash flow model or you’ll run short on working capital in months 10–14.
For service businesses and food production operations that need a structured cash flow model with customer acquisition cost tracking, EFM’s template library covers both wholesale and DTC revenue architectures.
The 4–6 week nitrogen cycling period is non-negotiable: stocking fish before ammonia stabilizes causes mass mortality and resets the entire timeline.
Common Mistakes and How to Fix Them
Five financial mistakes destroy aquaponics businesses before they reach Year 2.
1. Underestimating fish mortality costs. First-year operators lose 15–25% of fish stock to disease, oxygen depletion, or pH swings. Fix: budget a restocking reserve of $50–$150 per quarter and model 15% mortality in your base case, not your optimistic case.
2. Pricing at wholesale when DTC is available. Wholesale margins of 20–30% rarely cover fixed costs at hobby scale. Fix: start at farmers markets and CSA before approaching grocers. Build your DTC customer base first, then use wholesale as overflow capacity.
3. Ignoring the cycling period in cash flow. Founders often model revenue starting in Month 1. The system produces zero revenue for 4–6 weeks minimum. Fix: start your revenue line in Month 5 at the earliest and model 80% of theoretical yield for the first 6 months.
4. Skipping liability insurance. A fish disease outbreak that contaminates produce, or a customer illness claim, can end the business. General liability for a small farm runs $400–$800 per year. Fix: include it in your startup cost waterfall as a non-negotiable line item.
5. Scaling before the first system is profitable. Adding a second system before Month 18 typically stretches working capital past the breaking point. Fix: use the three-statement model framework to confirm positive monthly cash flow for at least 3 consecutive months before committing capital to expansion.
Frequently Asked Questions
How much does it cost to start an aquaponics business?
A hobby-scale aquaponics system costs $5,000–$15,000 all-in, covering IBC tanks ($200–$800), grow beds and media ($300–$1,200), water quality sensors ($300–$2,000), plumbing ($200–$500), air pumps ($150–$300), fish stock ($100–$400), seedlings ($50–$200), and permits ($500–$3,000). Add a 20–40% contingency buffer for first-time builders. Urban micro-farms in the $15,000–$50,000 range require greenhouse or indoor facility costs on top of equipment. Commercial operations exceed $100,000 once you factor in land lease, climate control, and staffing. Always model three scenarios: conservative, base, and optimistic, before committing capital.
When does an aquaponics farm break even?
Breakeven timing depends on scale and sales channel. Hobby-scale operations selling at farmers markets typically break even on monthly operating costs between months 4 and 9, once the system cycles and produce harvests begin. Commercial farms with higher fixed costs (lease, full-time labor, compliance) typically need 12–18 months to cover monthly OpEx. Full payback on the initial capital investment takes 3–5 years at hobby scale and 4–7 years at commercial scale, depending on whether you sell wholesale or DTC. The fastest path to breakeven is maximizing DTC produce sales, which carry 60–70% gross margins versus 25–35% wholesale.
What fish species work best for an aquaponics business?
Tilapia is the most common commercial choice because it tolerates a wide pH range (6.5–8.5), grows quickly (market weight in 6–9 months), and commands $4–$12 per pound depending on channel. Catfish is a strong alternative in the southern US, with similar growth rates and strong regional demand. Trout works in cooler climates (55–65°F water) and fetches premium pricing of $6–$10 per pound wholesale. Avoid species with narrow temperature tolerances in your first system. Fish mortality in Year 1 averages 15–25% for new operators, so choose a hardy, fast-growing species that gives you margin for error while you build system management skills.
What SBA loans are available for aquaponics farms?
Aquaponics qualifies as agriculture under NAICS code 111419 (Other Food Crops Grown Under Cover), making it eligible for SBA microloans ($10,000–$25,000 at 8–13% interest) and SBA 7(a) loans ($50,000–$150,000 at 7–10% interest). The SBA microloan program requires no collateral below $20,000 and is administered through nonprofit intermediary lenders. The 7(a) program requires 10–20% equity injection and collateral. According to the SBA, the average microloan in fiscal year 2023 was approximately $16,000. USDA SARE grants ($7,500–$30,000) and NIFA Beginning Farmer grants provide non-dilutive capital that does not require repayment, making them ideal for proof-of-concept systems.
How do I price aquaponics produce for maximum profit?
Price your produce based on channel, not just cost. At farmers markets, leafy greens command $8–$15 per pound, compared to $3–$6 per pound wholesale. Basil and specialty herbs fetch the highest per-pound prices ($12–$20 at retail) and grow quickly (4–6 weeks), making them the highest-margin crop per square foot. Build your pricing model around a target gross margin of 55–65% for DTC and 25–35% for wholesale. Factor in booth fees ($25–$75 per market day), packaging ($0.20–$0.50 per unit), and customer acquisition costs ($15–$40 per new customer) when calculating true DTC profitability. CSA subscriptions at $25–$50 per week per household provide predictable revenue but require upfront marketing investment of $200–$800 per subscriber.
What are the biggest regulatory risks for aquaponics startups?
The FDA Produce Safety Rule applies to farms averaging more than $25,000 in annual produce sales over 3 years, requiring water testing, worker training, and recordkeeping. State aquaculture permits vary widely: California requires registration with the Department of Fish and Wildlife, while Florida issues aquaculture certificates through the Department of Agriculture. Some states classify aquaponics as hydroponics (simpler path), while others require full aquaculture licensing (more complex). USDA organic certification for aquaponics produce is possible but contested; the National Organic Standards Board has debated hydroponic and aquaponic eligibility since 2017. Budget $500–$3,000 for permits and $500–$1,500 for legal review in high-regulation states.
How does a 5-year aquaponics pro forma model work?
A 5-year aquaponics pro forma models revenue and costs at three levels of granularity: monthly cash flow for Year 1 (capturing the cycling period, first harvests, and early customer acquisition), quarterly for Years 2–3 (showing the path to 15–25% net margin), and annual for Years 4–5 (modeling scale scenarios). Key inputs include fish stocking density, harvest cycles per year, produce yield per square foot, channel mix (wholesale vs. DTC), and three sensitivity variables: fish mortality rate (5–15%), crop yield variance (plus or minus 20%), and price erosion (10–30%). The model outputs monthly cash burn, breakeven month, IRR, and payback period. A pre-built template with these inputs and scenario toggles saves 20–40 hours of modeling time and produces a format that SBA lenders and angel investors recognize immediately.
Conclusion
Aquaponics is a financially viable business model when you build it on accurate unit economics rather than sustainability optimism. The numbers are clear: a $10,000 hobby system can reach monthly cash flow breakeven by Month 7, achieve 36% net margins in Year 2 with DIY labor, and double output in Year 3 by adding a second system at only 30% incremental fixed cost. The path from concept to bankable business runs through itemized startup costs, a realistic operating expense model, a dual-channel revenue strategy, and a sensitivity-tested pro forma that lenders can underwrite.
I recommend downloading the Aquaponics Farm 5-Year Pro Forma Template from EFM, a pre-built Excel model with monthly cash flow for Year 1, quarterly projections for Years 2–3, sensitivity tables for mortality rate and yield variance, and IRR and payback period calculations across three scale scenarios. It’s the fastest way to turn your aquaponics concept into a document an SBA loan officer or angel investor will take seriously.

























































