
0 ITEMS

Golf Simulator Business Profit: 5-Year Financial Model
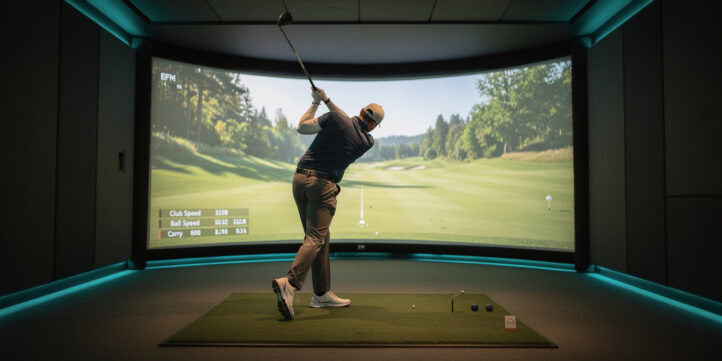
A golf simulator business can generate $80,000 to $150,000 in annual revenue per bay, but only if you build the financial model before you sign the lease.
Key Takeaways
- A single simulator bay priced at $45-75 per hour can produce $80,000-$150,000 in annual gross revenue at 50-70% occupancy.
- Initial capex ranges from $550,000 for a 3-bay urban location to $1.2 million or more for a 10-bay suburban facility, covering hardware, buildout, and working capital.
- Industry benchmark cost structure targets: COGS 35-45%, labor 25-30%, rent/occupancy 8-12%, technology maintenance 3-5%, marketing 5-8%, leaving a target EBITDA margin of 15-25%.
- Break-even timelines differ sharply by scale: a 3-bay urban location typically reaches profitability in 18-24 months, while a 10-bay suburban facility takes 24-36 months.
- Membership programs priced at $200-$400 per month per member can shift 20-40% of revenue to recurring income, dramatically improving cash flow predictability.
- Food and beverage operations attached to simulator bays typically contribute 15-25% of simulator revenue at higher margins than bay rentals alone.
- Sensitivity analysis shows that moving occupancy from 40% to 60% capacity has a larger EBITDA impact than a $10 per hour price increase across most market scenarios.
Golf Simulator Business Financial Model: What the Template Covers
A complete golf simulator financial model translates your location, bay count, and pricing assumptions into a 5-year monthly pro forma with automated linkages between inputs and outputs. The sections below walk through each module in the order you should build them: unit economics first, then the full P&L, then capex, break-even, and sensitivity analysis.
The U.S. golf industry generated approximately $84 billion in total economic impact according to the National Golf Foundation Source, and indoor simulator venues now capture a growing share of that spending as year-round alternatives to outdoor play. The global indoor golf market is projected to grow at a compound annual growth rate of roughly 8-10% through 2028 according to industry research firm Grand View Research Source, driven by urbanization, weather-independent demand, and technology improvements in launch monitor accuracy.
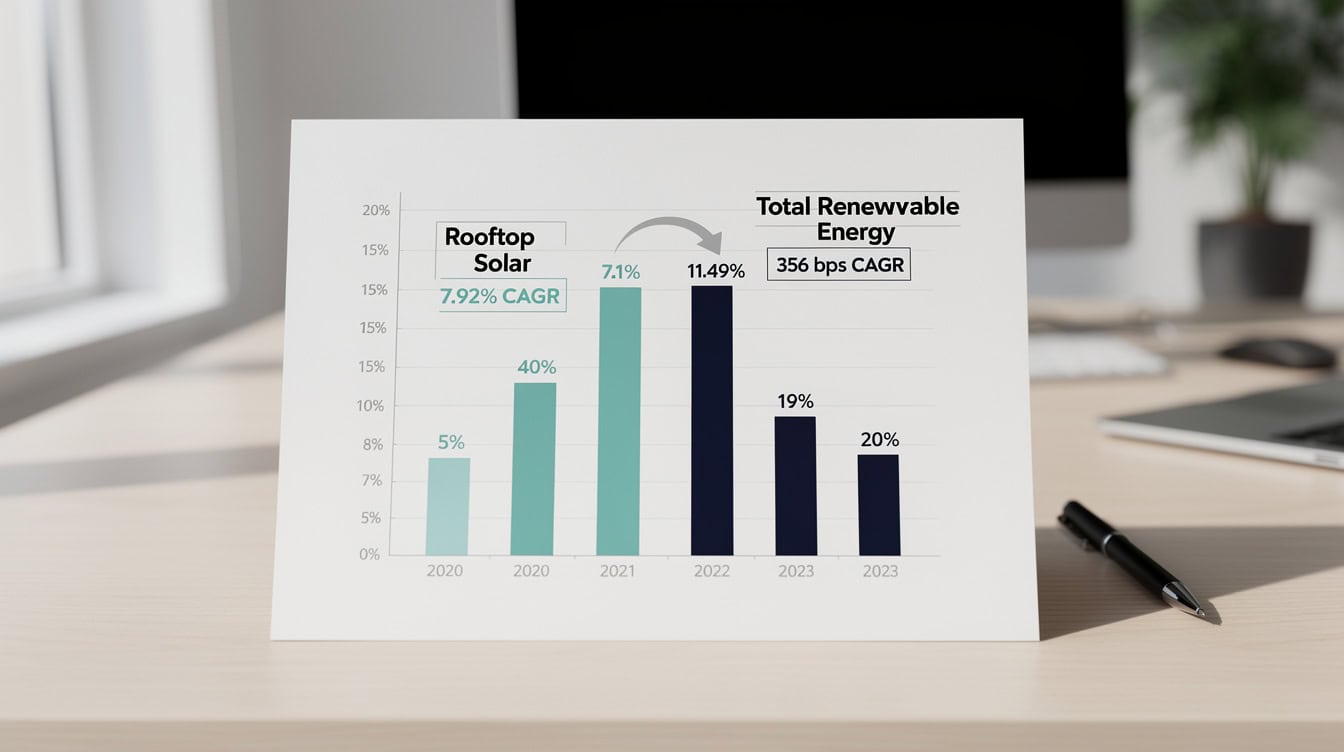
The global indoor golf market is growing at 8-10% CAGR, driven by urbanization and year-round demand.
Unit Economics Per Bay: Revenue Assumptions and Pricing Strategy
Unit economics (the revenue and cost performance of a single bay, treated as the repeatable building block of your business) determine whether your concept scales profitably. Start here before modeling the full facility.
Hourly Rate Assumptions by Market
Urban markets in high-cost cities command $65-$75 per hour for prime-time slots (4 pm to 10 pm on weekdays, all day on weekends). Suburban markets typically price at $45-$60 per hour. Off-peak daytime slots (10 am to 4 pm weekdays) often run 20-30% below prime-time rates to stimulate demand from retirees, remote workers, and golf lesson clients.
Membership Program Structures
A well-designed membership program converts one-time visitors into predictable monthly revenue. Three tiers work well for most facilities:
- Off-Peak Membership: $200/month, unlimited access 10 am to 4 pm weekdays only.
- Standard Membership: $300/month, 8 hours of prime-time access per month plus unlimited off-peak.
- Unlimited Membership: $400/month, unrestricted access with priority booking.
At 40% membership mix (meaning 40% of total bay hours are consumed by members), a 5-bay facility can lock in roughly $18,000-$24,000 in monthly recurring revenue before a single walk-in books a session.
Per-Bay Annual Revenue Potential
Here’s the math for a single bay in a suburban market:
- Available hours per year: 12 hours/day x 365 days = 4,380 hours
- Prime-time hours (assume 6 hours/day): 2,190 hours at $55/hour = $120,450
- Off-peak hours (assume 6 hours/day): 2,190 hours at $40/hour = $87,600
- Blended gross at 60% occupancy: (0.60 x $120,450) + (0.60 x $87,600) = $72,270 + $52,560 = $124,830 per bay per year
Food and beverage (F&B) attach rates of 15-25% of simulator revenue add another $18,700-$31,200 per bay annually, bringing total per-bay revenue potential to $143,000-$156,000 in a well-run suburban facility.
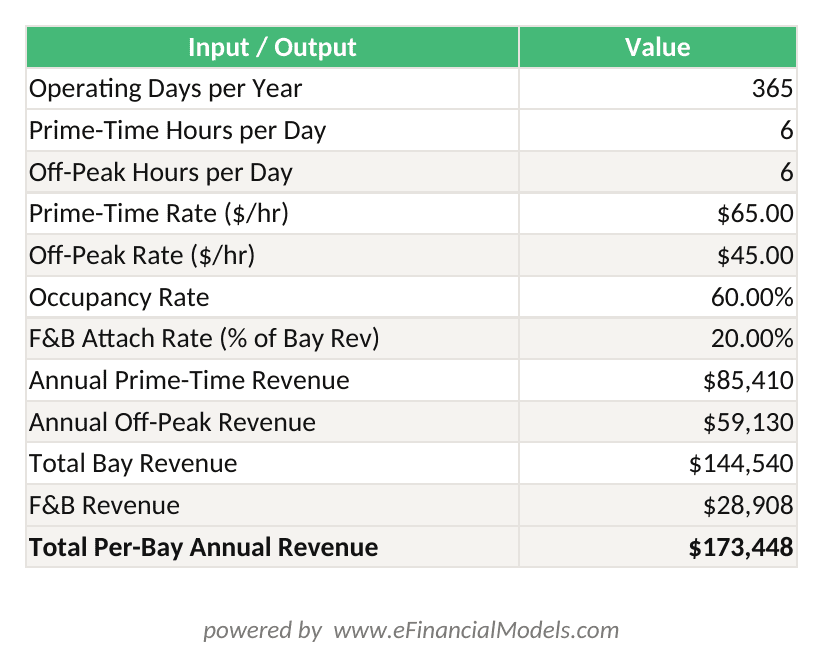
Per-bay annual revenue = (Prime-time hours × rate + Off-peak hours × rate) × occupancy + F&B attach. At 60% occupancy and $55 blended rate: $124,830 bay revenue + $24,966 F&B = $149,796 total.
Per-bay revenue calculation: 60% occupancy at a $55 blended rate yields $124,830 before F&B attach.
Pro Forma P&L Benchmarks: Industry-Standard Cost Structure
The pro forma P&L (profit and loss statement, meaning a forward-looking income statement built on assumptions rather than historical data) for a golf simulator business follows a recognizable hospitality cost structure with a few technology-specific line items.
| Cost Line | % of Revenue | Notes |
|---|---|---|
| COGS | 35-45% | F&B product cost, consumables |
| Labor | 25-30% | Front desk, instructors, management |
| Rent/Occupancy | 8-12% | Lease, CAM, utilities |
| Tech Maintenance | 3-5% | Simulator service contracts, software |
| Marketing | 5-8% | Digital ads, events, referral programs |
| G&A | 3-5% | Insurance, accounting, admin |
| EBITDA Target | 15-25% | Before depreciation and debt service |
EBITDA (earnings before interest, taxes, depreciation, and amortization) is the standard profitability metric investors use to value entertainment venues because it strips out financing structure and non-cash charges, making facilities comparable regardless of how they were funded.
Labor deserves special attention. A 3-bay facility can operate with 2-3 part-time staff plus one manager, keeping labor near the low end of the 25-30% range. A 10-bay facility requires dedicated front-of-house staff, a head instructor, and potentially a food and beverage manager, pushing labor toward 28-30% of revenue.
Target EBITDA of 15-25% requires disciplined control of labor (25-30%) and rent (8-12%) as the two largest variable cost lines.
Capex Investment Calculator: Initial Build-Out Costs by Bay Count
Capex (capital expenditure, meaning the upfront investment in physical assets before the business opens) is the largest financial risk in a golf simulator venture. Underestimating it is the single most common reason new facilities run out of cash before reaching stabilized occupancy.
Itemized Capex by Component
| Component | Per Bay (Budget) | Per Bay (Premium) | 3-Bay Total | 10-Bay Total |
|---|---|---|---|---|
| Simulator Hardware | $40,000 | $80,000 | $120k-$240k | $400k-$800k |
| Bay Construction/Buildout | $50,000 | $100,000 | $150k-$300k | $500k-$1M |
| Furniture & Fixtures | $15,000 | $25,000 | $45k-$75k | $150k-$250k |
| POS & Booking Systems | $5,000 | $10,000 | $5k-$10k | $10k-$20k |
| Working Capital (3-6 months) | — | — | $80k-$120k | $200k-$350k |
| Total Range | $400k-$745k | $1.26M-$2.42M |
Simulator hardware tiers matter financially. Budget-tier systems (TrackMan iO, Uneekor QED) run $40,000-$50,000 per bay and deliver accurate ball-flight data sufficient for most recreational players. Premium systems (Full Swing Pro, Foresight GCQuad with enclosure) run $70,000-$80,000 per bay and justify higher hourly rates in competitive urban markets. The $30,000 per-bay premium typically requires an additional $8-$12 per hour in pricing to achieve the same return on invested capital.
SBA 7(a) loans (the U.S. Small Business Administration’s primary loan guarantee program for small businesses) cover up to $5 million and are commonly used for golf simulator buildouts, with loan terms of 10 years for equipment and up to 25 years for real estate components according to the SBA Source. Equipment financing from simulator manufacturers or third-party lenders can cover 70-80% of hardware costs at rates of 6-10% over 5-7 year terms.
A 10-bay suburban facility requires $1.2M-$2.4M in total capex versus $400K-$745K for a 3-bay urban location.
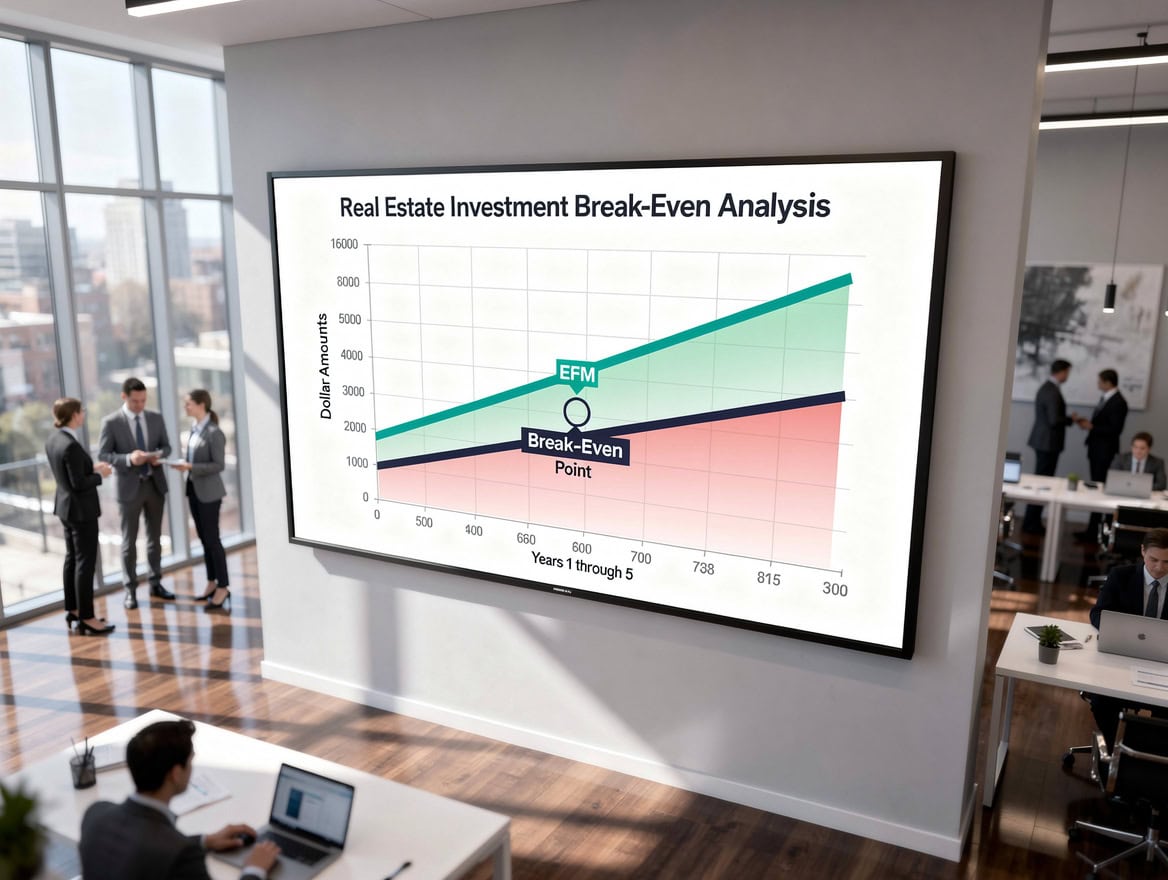
Break-Even Analysis: Timeline to Profitability by Facility Size
Break-even analysis identifies the revenue level at which total costs equal total revenue, and the timeline to reach that point from opening day. For golf simulator businesses, the break-even calculation must account for a ramp-up curve (the gradual increase in occupancy as the facility builds its customer base) rather than assuming full occupancy from day one.
Typical Ramp-Up Curve: Month-by-Month Occupancy
- Months 1-3: 20-30% occupancy (soft launch, word-of-mouth building)
- Months 4-6: 35-45% occupancy (marketing campaigns gaining traction)
- Months 7-12: 45-55% occupancy (membership base forming, repeat visits)
- Year 2: 55-65% occupancy (stabilized operations)
- Year 3+: 65-75% occupancy (mature facility with strong membership base)
Break-Even Scenarios
| Scenario | Investment | Monthly Fixed Costs | Break-Even Occupancy | Timeline |
|---|---|---|---|---|
| 3-Bay Urban | $550,000 | $28,000 | 48% | 18-24 months |
| 5-Bay Suburban | $850,000 | $42,000 | 45% | 20-28 months |
| 10-Bay Suburban | $1,200,000 | $75,000 | 42% | 24-36 months |
Larger facilities reach break-even occupancy at a lower percentage because fixed costs are spread across more revenue-generating bays. However, they require more absolute revenue dollars to cover those fixed costs, which is why the timeline is longer despite the lower percentage threshold.
Urban 3-bay locations typically reach break-even occupancy 6-8 months ahead of larger suburban facilities due to lower fixed cost thresholds.
Sensitivity Analysis: Occupancy, Pricing, and Dayparts
Sensitivity analysis shows how EBITDA changes when you adjust one variable at a time, holding all others constant. This is the most important planning tool for stress-testing your assumptions before committing capital.
EBITDA Impact: 5-Bay Suburban Facility at Year 2
| Occupancy Rate | $45/hr Pricing | $55/hr Pricing | $65/hr Pricing |
|---|---|---|---|
| 40% | 4% EBITDA | 9% EBITDA | 14% EBITDA |
| 50% | 10% EBITDA | 16% EBITDA | 21% EBITDA |
| 60% | 16% EBITDA | 22% EBITDA | 28% EBITDA |
| 70% | 21% EBITDA | 28% EBITDA | 34% EBITDA |
The table reveals two critical insights. First, moving from 40% to 60% occupancy at $55/hour improves EBITDA by 13 percentage points, while moving from $45 to $65/hour at 50% occupancy improves EBITDA by 11 percentage points. Occupancy has the larger lever. Second, the 15-25% EBITDA target is achievable at 50-60% occupancy with mid-range pricing, which is a realistic goal for a well-marketed facility in year 2.
Daypart optimization (shifting revenue toward high-margin prime-time hours) can improve EBITDA by 3-5 percentage points without changing total occupancy. Strategies include dynamic pricing software, corporate league programs that fill weekday evenings, and membership tiers that deliberately push casual players toward off-peak slots.
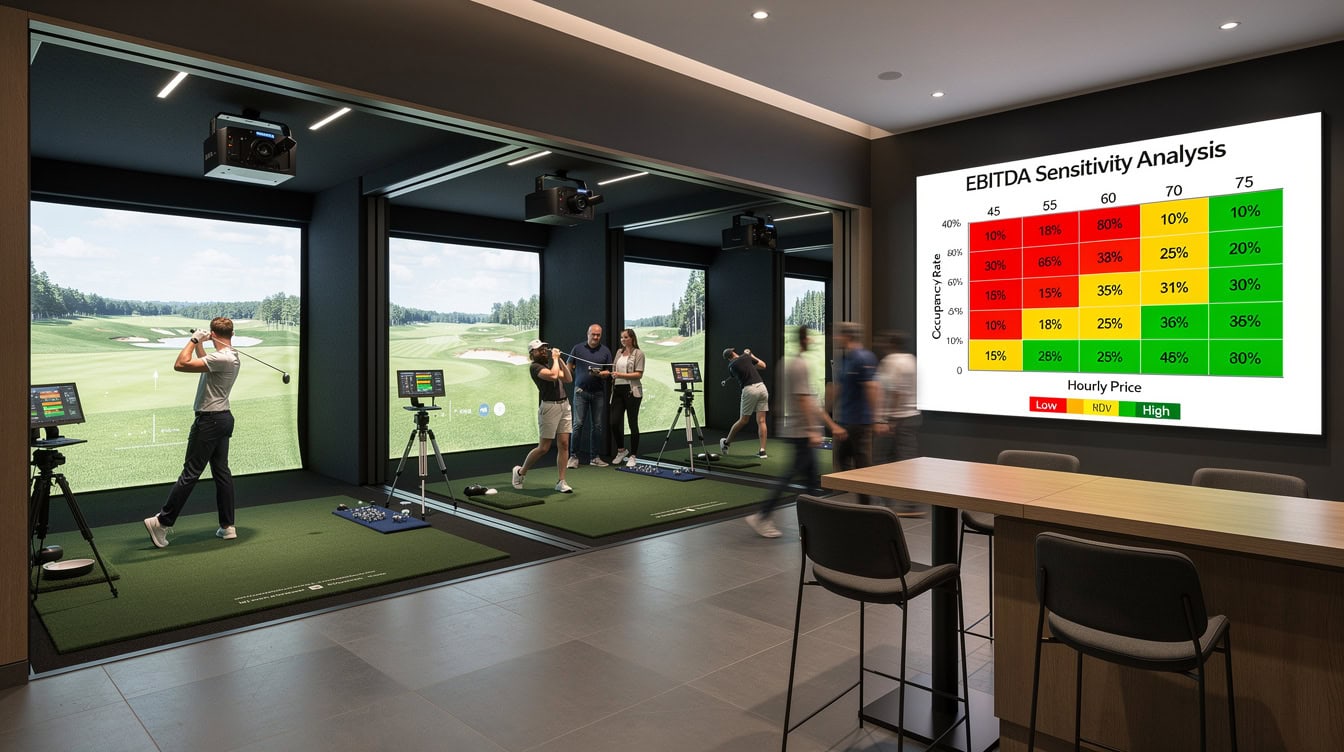
Moving from 40% to 60% occupancy at $55/hour improves EBITDA by 13 percentage points, outpacing a $20/hour price increase.
Case Study Comparison: 10-Bay Suburban vs. 3-Bay Urban
Real-world performance benchmarks help calibrate your own assumptions. The two scenarios below use conservative ramp-up curves and mid-range pricing.
Side-by-Side Financial Comparison
| Metric | 10-Bay Suburban | 3-Bay Urban |
|---|---|---|
| Initial Investment | $1,200,000 | $550,000 |
| Year 1 Revenue | $980,000 | $220,000 |
| Year 2 Revenue | $1,580,000 | $380,000 |
| Year 3 Revenue | $2,100,000 | $480,000 |
| Year 3 EBITDA | $462,000 (22%) | $86,400 (18%) |
| Break-Even Month | Month 28 | Month 20 |
| 5-Year IRR | 24% | 19% |
10-Bay Suburban Assumptions: $55/hour blended rate, 62% year-3 occupancy, 30% membership mix at $300/month average, F&B contributing 20% of simulator revenue, 4,500 sq ft at $22/sq ft NNN lease.
3-Bay Urban Assumptions: $68/hour blended rate, 58% year-2 occupancy, 35% membership mix at $350/month average, no dedicated F&B (beverage service only), 1,800 sq ft at $45/sq ft NNN lease in a major metro.
The urban 3-bay model reaches break-even faster and requires less capital, but its absolute EBITDA ceiling is lower. The suburban 10-bay model delivers higher total returns but demands stronger pre-opening marketing and a longer cash runway. Neither model is universally superior: the right choice depends on your available capital, local market density, and operator experience.
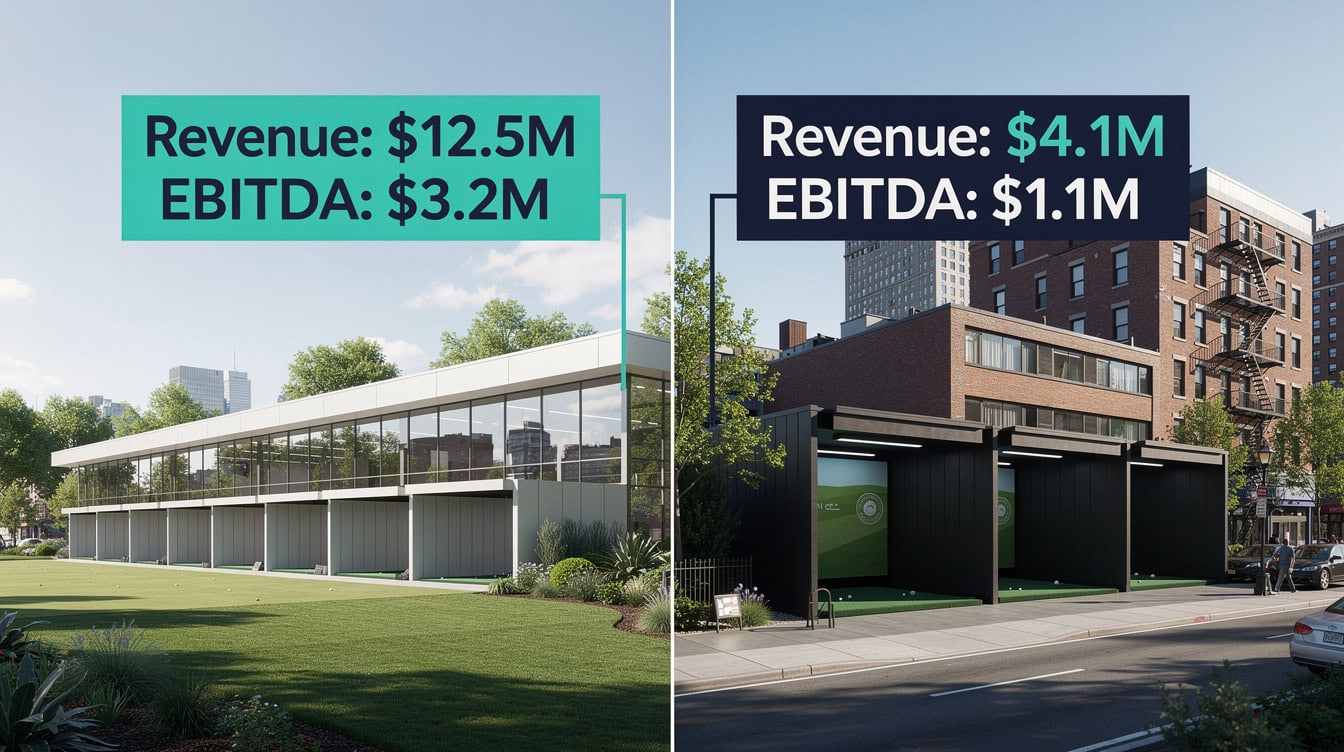
The 10-bay suburban model delivers 22% EBITDA at year 3 versus 18% for the 3-bay urban model, but requires 2x the capital and 8 more months to break even.
Revenue Diversification: Beyond Bay Rentals
A golf simulator business that relies entirely on hourly bay rentals is exposed to occupancy risk. Diversifying into adjacent revenue streams improves both EBITDA and business valuation multiples.
- Golf Lessons and Coaching (10-15% of revenue): A PGA-certified instructor charging $100-$150 per hour for private lessons generates $60,000-$90,000 annually at 10 lessons per week. Lessons also drive simulator bookings because students return to practice.
- Corporate Event Packages: A 4-hour corporate outing for 12 players at $1,200-$2,000 per event fills off-peak weekday slots that are hardest to sell at retail rates.
- League and Tournament Hosting: Weekly leagues at $25-$40 per player per session create recurring weeknight revenue and build community loyalty. A 12-team league with 4 players per team generates $1,200-$1,920 per week.
- Food and Beverage Operations: Full F&B service (bar, light menu) targets 20-25% of simulator revenue. Beverage-only service (beer, wine, non-alcoholic) targets 10-15%. F&B gross margins of 65-75% on beverages make this the highest-margin revenue line in the business.
- Retail Pro Shop: Club fittings, grip replacements, and branded merchandise can contribute 5-8% of total revenue with minimal incremental labor cost.
For operators building out their service business financial model, the golf simulator’s multi-stream revenue structure closely resembles other hospitality and entertainment venue models.
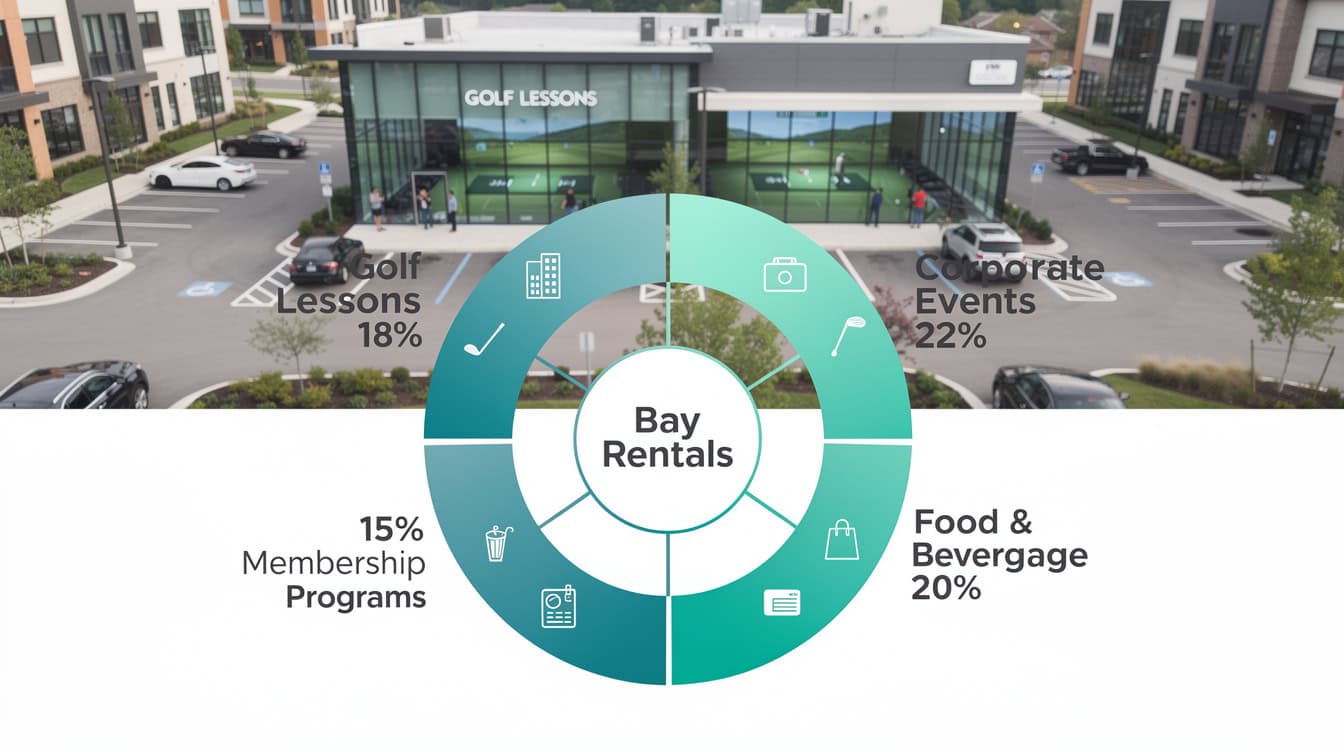
F&B operations at 65-75% beverage margins are the highest-margin revenue line available to golf simulator operators.
How to Use the Downloadable Financial Model Template
The EFM Golf Simulator Financial Model is a pre-wired Excel workbook with 5-year monthly projections, automated formula linkages, and a scenario comparison dashboard. You don’t need to build formulas from scratch: enter your assumptions in the blue input cells and the model calculates revenue, costs, EBITDA, cash flow, and break-even automatically. Excel supports up to 1,048,576 rows and 16,384 columns per worksheet Source, meaning the monthly pro forma can accommodate decades of granular data without hitting structural limits.
Template Input Sections
- Market Assumptions Tab: Enter bay count, hourly rates by daypart, operating hours, and occupancy ramp-up curve by month.
- Membership Module: Input membership tier pricing, target member count by month, and churn rate assumption.
- Revenue Diversification Tab: Toggle F&B, lessons, events, and retail on or off with percentage-of-simulator-revenue assumptions.
- Capex Calculator: Enter hardware tier, buildout cost per bay, and working capital months to generate a total investment figure.
- P&L Benchmarks Tab: Pre-loaded with industry-standard percentages; override any line item with your specific market data.
- Scenario Dashboard: Compare base case, upside, and downside scenarios side by side with dynamic charts ready for investor presentations.
Entrepreneurs building a business plan for a golf simulator facility will find the template’s monthly cash flow waterfall particularly useful for identifying the months when additional working capital may be needed during the ramp-up phase.
For operators who also plan a food and beverage component, restaurant business financial model templates provide complementary F&B-specific projections that can be linked to the simulator model.

The EFM Golf Simulator Financial Model includes pre-wired formulas across 6 input tabs with automated linkages to the P&L, cash flow, and investor dashboard.
Common Mistakes in Golf Simulator Financial Planning
Avoid these five errors that consistently derail new facility projections.
- Assuming full occupancy from month one. Real facilities average 20-30% occupancy in the first quarter. Build a ramp-up curve into your model or you’ll run out of cash before reaching break-even.
- Ignoring technology replacement costs. Simulator hardware has a 5-7 year useful life. Budget 3-5% of revenue annually for maintenance contracts and plan a hardware refresh at year 5-6, which can cost $30,000-$60,000 per bay.
- Underpricing off-peak slots. Setting off-peak rates too low trains customers to expect discounts and cannibalizes prime-time demand. A 20-25% off-peak discount is sufficient; deeper discounts rarely generate enough incremental volume to compensate.
- Omitting pre-opening marketing costs. A 3-month pre-opening marketing campaign ($15,000-$30,000) is essential for building a membership waitlist before opening day. Operators who skip this step spend the first 6 months educating the market instead of filling bays.
- Treating all markets identically. A $65/hour rate that works in Manhattan will price out customers in a mid-size Midwest city where the competitive rate is $45/hour. Always validate pricing against local competitors before finalizing your model.
For a broader framework on profitability analysis across service businesses, EFM’s resource library covers the methodology in detail.
Frequently Asked Questions
How much does a golf simulator business make per year?
A single-bay golf simulator operating at 60% occupancy with a blended rate of $55 per hour generates approximately $124,000 in bay revenue annually, plus $18,000-$31,000 from food and beverage attach. A 5-bay facility at the same metrics produces $710,000-$775,000 in total annual revenue. Actual results vary significantly by market: urban facilities with higher hourly rates but smaller footprints often match the absolute revenue of larger suburban facilities. Year 1 revenue typically runs 40-50% below stabilized year 3 revenue due to the occupancy ramp-up curve. The National Golf Foundation reports that indoor golf participation has grown consistently over the past decade, supporting long-term demand assumptions.
What are the realistic startup costs for a golf simulator business?
Startup costs range from approximately $400,000 for a minimal 3-bay build with budget-tier simulators to over $2 million for a 10-bay premium facility. The three largest cost categories are simulator hardware ($40,000-$80,000 per bay), bay construction and buildout ($50,000-$100,000 per bay including flooring, impact netting, projection screens, and HVAC modifications), and working capital to cover 3-6 months of operating expenses before the business reaches break-even occupancy. SBA 7(a) loans and equipment financing from simulator manufacturers are the two most common funding sources according to the SBA Source. Always add a 10-15% contingency buffer to your buildout estimate.
What occupancy rate do I need to break even?
Break-even occupancy depends on your fixed cost base and pricing. For a 5-bay suburban facility with $42,000 in monthly fixed costs and a $55/hour blended rate, break-even occurs at approximately 45% occupancy, which equals about 2,970 bay-hours sold per month across all 5 bays. Here’s the math: 5 bays x 12 hours/day x 30 days = 1,800 available bay-hours per month. At 45% occupancy, that’s 810 hours sold x $55 = $44,550 in bay revenue, which covers fixed costs with a small buffer. Membership revenue and F&B sales lower the break-even occupancy threshold by contributing revenue that doesn’t scale linearly with bay hours.
How do membership programs affect golf simulator business profitability?
Membership programs improve profitability in three ways. First, they convert variable revenue into predictable monthly recurring revenue, which reduces cash flow volatility and makes debt service more manageable. Second, members typically visit more frequently than walk-in customers, improving occupancy during off-peak hours without additional marketing spend. Third, members generate higher lifetime value: a member paying $300/month for 18 months contributes $5,400 in revenue versus a walk-in customer who might spend $200 total across 5 visits. A membership mix of 30-40% of total revenue is the target for a mature facility. Pricing memberships at $200-$400 per month positions them as a value proposition versus paying $55/hour for 6+ hours of monthly play.
What is the typical EBITDA margin for a golf simulator business?
Industry benchmarks target 15-25% EBITDA margin at stabilized operations (year 2-3). Facilities at the low end of this range (15-18%) typically have higher rent as a percentage of revenue (urban locations), lower membership penetration, or limited F&B operations. Facilities at the high end (22-25%) combine suburban rent economics, strong membership programs generating 30-40% of revenue, and active F&B service contributing 20%+ of simulator revenue at 65-75% beverage margins. EBITDA margin below 15% signals either a pricing problem, an occupancy problem, or a cost structure that needs restructuring before the business can service its debt and generate investor returns.
How long does it take for a golf simulator business to become profitable?
Most golf simulator facilities reach operating profitability (positive monthly EBITDA) between months 12 and 18, assuming a competent pre-opening marketing campaign and a realistic ramp-up curve. Full payback of the initial investment (the point at which cumulative cash flow turns positive) takes 3-5 years depending on facility size, financing structure, and market conditions. A 3-bay urban location with $550,000 in initial investment and strong year-2 revenue of $380,000 at 18% EBITDA generates $68,400 in annual EBITDA, implying a simple payback period of approximately 8 years on EBITDA alone. However, debt financing reduces the equity payback period significantly: if $350,000 of the $550,000 is financed at 8% over 7 years, the equity invested is only $200,000, and the payback on equity can occur in 3-4 years.
Does climate affect golf simulator business revenue?
Yes, climate is a significant demand driver. Facilities in cold-weather markets (upper Midwest, Northeast, Canada) experience peak demand from October through April when outdoor golf is impossible, and a meaningful summer slowdown when golfers return to outdoor courses. Facilities in year-round golf markets (Florida, Arizona, Southern California) face less seasonal variation but also compete with outdoor courses for the same customers year-round. Cold-weather markets typically see 30-40% higher winter occupancy than summer occupancy, which means cash flow planning must account for a summer trough. Membership programs are especially valuable in cold-weather markets because they smooth revenue across the seasonal cycle.
Conclusion
Building a profitable golf simulator business starts with a rigorous financial model, not a passion for the sport. The unit economics are compelling: a single bay at $55/hour and 60% occupancy generates over $124,000 in annual revenue, and a 5-bay facility can reach 20%+ EBITDA margins by year 3 with the right membership program and F&B strategy. The risks are real too: undercapitalized buildouts, optimistic occupancy assumptions, and missing the ramp-up curve are the three most common failure modes.
I recommend downloading the EFM Golf Simulator Business Financial Model to build your investor-ready 5-year pro forma with pre-wired formulas, scenario comparison dashboards, and customizable assumptions for your specific market, bay count, and pricing strategy. It’s the fastest way to move from concept to a bankable business plan.

























































