
0 ITEMS

Frozen Food Business Plan Financial Model Excel Template
The Frozen Food Store Financial Model helps entrepreneurs, business owners, consultants, analysts, and founders turn a frozen food retail concept into a structured financial forecast. Instead of building complex spreadsheets from scratch, users can enter their own assumptions and review projected revenue, startup costs, operating expenses, payroll, cash flow, profitability, and funding needs in one connected model. It is designed for planning a new frozen food store, evaluating an expansion, preparing a business plan, or building financial projections for lenders, investors, and internal decision-making. The model is built around the practical drivers of a frozen food shop, including foot traffic, customer conversion, repeat purchasing behavior, product mix, average prices, inventory costs, and staffing needs. Users can adjust assumptions for frozen entrees, frozen ingredients, frozen desserts, and other store-specific revenue streams to understand how sales volume and pricing affect gross margin and long-term profitability. This makes it easier to test whether the store can support rent, utilities, wages, marketing, inventory purchases, and other recurring expenses while still moving toward sustainable profit. For launch planning, the template helps organize the upfront investment required to open the store, including equipment, freezers, shelving, build-out, renovation, deposits, licenses, and working capital. It also supports monthly and annual forecasting over a multi-year horizon, allowing users to review cash flow timing, profit and loss results, balance sheet movement, break-even analysis, payback period, and investor return metrics. By connecting inputs to outputs through pre-built formulas, the model helps identify cash shortages, estimate funding requirements, and evaluate whether the business plan is financially realistic. The Frozen Food Store Financial Model is fully editable and can be used in Microsoft Excel or Google Sheets, making it accessible for both financial and non-financial users. It provides a clean structure for scenario planning, chart review, KPI tracking, and professional reporting, helping users present their assumptions and results more clearly. Whether you are preparing a lender package, pitching investors, comparing growth options, or deciding if a frozen food store is worth launching, this financial model template gives you a practical framework for better planning and more confident decision-making.
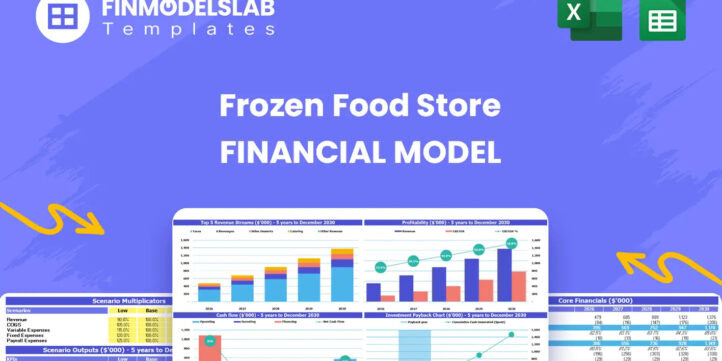


Financial Model Overview
The Frozen Food Store Financial Model is a ready-to-use financial model template designed to help users plan, evaluate, and present the financial performance of a frozen food retail business. It brings together the key assumptions needed to forecast store revenue, product margins, inventory costs, staffing, overhead, startup investment, cash flow, profitability, and investor returns over a multi-year period. For a frozen food store, accurate planning is especially important because the business depends on the right mix of customer traffic, freezer capacity, product pricing, stock management, and recurring operating expenses. This template gives entrepreneurs, store owners, consultants, analysts, and business plan writers a structured way to replace rough estimates with a more organized financial forecast. Users can customize the assumptions to match their own location, pricing strategy, product categories, staffing plan, supplier costs, and funding structure, then use the outputs to support budgeting, funding discussions, stakeholder presentations, and day-to-day decision-making.
All-in-One Dashboard
The all-in-one dashboard gives users a central view of the Frozen Food Store Financial Model by combining the most important inputs and outputs in one place. It is designed to help users quickly understand how the business is expected to perform without searching through every calculation sheet. Inputs may include assumptions for customer traffic, conversion rates, repeat purchases, product pricing, cost of goods sold, payroll, rent, marketing, utilities, and capital expenditure. Outputs can include projected revenue, gross profit, EBITDA, net profit, cash balance, break-even timing, payback period, and return indicators. For planning and presentation purposes, this dashboard is useful because it creates a clear summary of the business case and allows decision-makers to see how operating assumptions flow into financial results. A founder can use it to check whether the store concept is financially viable, while a consultant or analyst can use it to present a concise financial snapshot to clients, lenders, or investors.
Low Base High Scenario Analysis
The Low Base High scenario analysis section helps users model uncertainty by comparing three different versions of the frozen food store forecast. Instead of relying on one fixed projection, users can test a conservative case, an expected case, and an optimistic case by adjusting key assumptions such as daily visitors, visitor-to-buyer conversion, average order size, repeat customer rate, price growth, inventory cost inflation, staffing levels, and marketing effectiveness. The outputs show how changes in these assumptions affect revenue, profit margins, cash flow, and overall financial performance. This component is valuable because frozen food retail performance can be influenced by local competition, seasonal shopping patterns, supplier pricing, consumer demand, and promotional activity. By reviewing low, base, and high cases side by side, users can identify downside risk, evaluate upside potential, and prepare a more credible business plan. It also supports funding conversations by showing lenders and investors that the business has been tested under different operating conditions rather than only under ideal assumptions.
Professional Charts
The professional charts component converts financial calculations into clear visual reports that are easier to interpret and present. These charts may display revenue growth, profit trends, cash flow movement, margin development, expense composition, funding needs, customer growth, and other important financial metrics across the forecast period. For a frozen food store, visual reporting is especially helpful because owners and stakeholders often need to understand how inventory costs, store traffic, payroll, and fixed overhead interact over time. The chart outputs can be used in business plans, pitch decks, lender meetings, board updates, or internal planning sessions. Instead of presenting only rows of numbers, users can communicate trends and financial milestones in a more accessible format. This helps highlight whether sales growth is strong enough to cover recurring expenses, whether profitability improves as the store scales, and whether cash reserves remain adequate through the launch and growth stages. The result is a more polished and stakeholder-friendly way to explain the financial plan.
ROE Components and DuPont Analysis
The ROE components and DuPont analysis section helps users examine the drivers behind return on equity in a more detailed way. Rather than showing only a single return percentage, this component breaks performance into underlying elements such as profitability, asset efficiency, and financial leverage. Inputs and linked calculations may draw from net income, revenue, total assets, equity, debt assumptions, margins, and balance sheet projections. For a frozen food store, this analysis can help users understand whether returns are being driven by healthy margins, efficient use of store assets, appropriate inventory turnover, or the financing structure of the business. It is useful for investors and analysts because it explains not only what return the business may generate, but why that return occurs. Store owners can also use this section to identify operational improvements, such as improving gross margin through supplier negotiations, increasing sales per square foot, or managing assets more efficiently. This makes the model more useful for strategic planning and not just basic forecasting.
Revenue Inputs
The revenue inputs section is where users build the core sales assumptions for the frozen food store. This component may include daily foot traffic, visitor-to-buyer conversion rates, new customer counts, repeat customer behavior, units per order, average selling prices, product category mix, and annual growth assumptions. For a frozen food store, revenue is often shaped by the combination of in-store visitors, purchasing frequency, frozen product variety, promotional activity, and the perceived convenience of the store location. Users can customize assumptions for frozen entrees, frozen ingredients, frozen desserts, or other product lines to reflect their own sales strategy. The outputs flow into the revenue forecast and affect gross profit, cash flow, inventory planning, and profitability. This section is useful because it forces the business plan to be built from operational drivers rather than top-down guesses. Entrepreneurs can test whether their traffic and conversion assumptions are realistic, consultants can adjust the model for different retail concepts, and investors can review the logic behind projected sales growth.
Bank-Ready Reports
The bank-ready reports component provides structured financial outputs that can be shared with lenders, investors, partners, and other stakeholders. These reports typically include projected profit and loss, cash flow, balance sheet, summary metrics, and supporting schedules in a clean and understandable format. For a frozen food store seeking financing, lenders often want to see whether the business can generate enough cash to cover expenses, repay debt, maintain working capital, and withstand changes in revenue or cost assumptions. This section helps organize the forecast into a format that supports credit review and funding discussions. Inputs from revenue, expenses, payroll, capital expenditures, working capital, and financing assumptions feed into the reports automatically, reducing the need to manually rebuild financial statements. The value of this component is that it turns the model into a practical funding document, not just an internal spreadsheet. Users can present the financial plan with greater clarity and show how startup investment, operating performance, and cash generation are expected to develop over time.
Revenue Breakdown
The revenue breakdown section provides a detailed view of how total store sales are generated across product categories and revenue streams. Instead of showing only one total revenue line, this component separates the contribution of frozen entrees, frozen ingredients, frozen desserts, and any additional product categories the user chooses to include. Inputs may include price per unit, sales volume, customer mix, units per transaction, repeat purchase assumptions, category growth rates, and seasonal adjustments. The outputs help users see which categories drive the largest share of revenue, which products may contribute stronger margins, and where marketing or merchandising efforts should be focused. For a frozen food store, this is especially important because freezer space, supplier selection, and inventory purchasing decisions should be aligned with expected sales performance. A detailed revenue breakdown also improves credibility in a business plan by showing that sales projections are based on specific retail drivers. It helps users make better decisions about pricing, product range, promotions, and category expansion.
KPI Dashboard
The KPI dashboard tracks the key performance indicators that matter most for monitoring the frozen food store’s financial and operational health. Metrics may include revenue growth, gross margin, EBITDA margin, net profit margin, cash balance, customer conversion rate, repeat customer share, average order value, inventory-related cost measures, payroll as a percentage of revenue, and return indicators. These KPIs help translate the full financial forecast into a more practical management view. For store owners, the dashboard can support monthly reviews by showing whether the business is moving toward its targets. For consultants and analysts, it provides a concise way to explain performance trends and compare results against assumptions or benchmarks. Inputs are pulled from the underlying revenue, cost, payroll, and financial statement calculations, while outputs are shown in a format suitable for quick interpretation. This component is useful because it helps users focus on the drivers that influence profitability and cash flow, rather than getting lost in detailed spreadsheet tabs.
Startup Cost and Operating Expense Planning
The startup cost and operating expense planning section helps users estimate how much capital is required to open and operate the frozen food store. Startup inputs may include commercial freezers, store build-out, renovation, shelving, display units, point-of-sale systems, signage, licenses, opening inventory, security deposits, professional fees, initial marketing, and working capital reserves. Operating expense inputs may include rent, utilities, insurance, payroll, marketing, maintenance, software, packaging, supplies, payment processing fees, and other recurring costs. The outputs help users separate one-time launch expenses from ongoing monthly obligations, which is essential for determining funding needs and managing liquidity. For a frozen food store, this component is particularly important because refrigeration equipment, reliable freezer infrastructure, and initial inventory can require significant upfront investment. By organizing these costs in one place, the model helps users avoid underestimating the cash needed before opening. It also supports better budgeting by showing how fixed and variable expenses affect the path to profitability over time.
Break-Even Payback and Funding Needs Analysis
The break-even, payback, and funding needs analysis section helps users understand when the frozen food store may become financially self-sustaining and how much capital may be required to reach that point. Inputs may include startup investment, fixed operating costs, variable costs, gross margin, sales volume, customer traffic, pricing, financing assumptions, and projected cash flow. The outputs can show the month when revenue covers total costs, the time required to recover the initial investment, and the minimum funding needed to avoid cash shortfalls during launch and growth. This component is useful for entrepreneurs because it gives a clear milestone for evaluating whether the business model is realistic. It is also important for investors and lenders because break-even timing and payback period help assess risk, capital efficiency, and repayment potential. For a frozen food store, understanding break-even is especially valuable because profitability depends on reaching enough sales volume to cover rent, payroll, utilities, inventory costs, and equipment-related expenses. By highlighting these thresholds, the model supports stronger decision-making before committing capital.
File types:
Excel – Single-User: .xlsx
Excel – Multi-User: .xlsx
Free Demo – .xlsx
Similar ProductsOther customers were also interested in...

 HenrySheykin
Solar Panel Manufacturing Plant Business Plan Fina...
The Solar Panel Manufacturing Financial Model helps users turn a solar factory concept into a struct... Read more
Coal Mining Financial Model Excel Template
The Coal Mining Financial Model helps users turn a mining project concept, expansion plan, or invest... Read more
Metal Mining Business Financial Model Excel Templa...
The Metal Mining Financial Model Financial Model Template helps users turn a mining project concept ... Read more
Food Production Financial Model Excel Template
The Food Manufacturing Financial Model helps entrepreneurs, founders, consultants, analysts, and bus... Read more
Clothing Line Business Financial Model Excel Templ...
The Clothing Line Financial Model helps founders, apparel entrepreneurs, consultants, analysts, and ... Read more
T-Shirt Printing Business Financial Model Excel Te...
The T-Shirt Printing Financial Model helps entrepreneurs, founders, business owners, consultants, an... Read more

Gold Mining Business Financial Model Excel Templat...
The Gold Mining Financial Model Financial Model Template helps users turn a gold mining project into... Read more
Biodiesel Manufacturing Business Financial Model E...
The Biodiesel Manufacturing Financial Model helps entrepreneurs, founders, business owners, consulta... Read more
Organic Fertilizer Production Financial Model Exce...
The Organic Fertilizer Production Financial Model helps users turn a fertilizer plant concept into a... Read more
Drone Manufacturing Financial Model Excel Template
The Drone Manufacturing Financial Model Financial Model Template helps turn a UAV production concept... Read more
You must log in to submit a review.