
0 ITEMS

Arcade Business Plan Financial Model Excel Template
The Arcade Financial Model helps users turn an arcade, game room, or family entertainment center concept into a structured financial forecast. Instead of starting with a blank spreadsheet, entrepreneurs and planners can work from a ready-to-use model built around the commercial drivers of an arcade business, including game play sessions, food and beverage sales, event bookings, merchandise, customer traffic, pricing, and operating capacity. The template supports financial planning by connecting revenue assumptions with startup costs, operating expenses, payroll, cash flow, profitability, and investment needs in one organized workbook. This template is designed for arcade founders, business owners, consultants, analysts, lenders, and anyone preparing a business plan or funding presentation. It gives users a practical way to estimate how much capital may be required to launch, how revenue could grow over time, how staffing and recurring expenses affect margins, and when the business may become financially sustainable. Because the model is editable, users can adjust assumptions for their own venue size, pricing strategy, equipment plan, event focus, food and beverage offering, and local market conditions. The Arcade Financial Model is especially useful for decision-making before launch, expansion, or fundraising. Users can test different assumptions, compare low, base, and high performance cases, review cash flow dynamics, and understand how changes in traffic, pricing, cost structure, or payroll influence profit. The model also helps evaluate break-even timing, expected payback, return metrics, and the financial impact of investing in machines, renovations, kitchen or bar equipment, and other capital expenditures. Built for clarity and presentation, the template includes dashboards, reports, charts, financial statements, and performance metrics that help communicate the arcade business case to stakeholders. It can support conversations with investors, banks, partners, internal teams, and advisors by turning assumptions into a more complete financial story. For users who want a customizable and professional way to plan an arcade business, this financial model template provides the structure needed to forecast revenue, manage costs, assess profitability, and make more confident financial decisions.
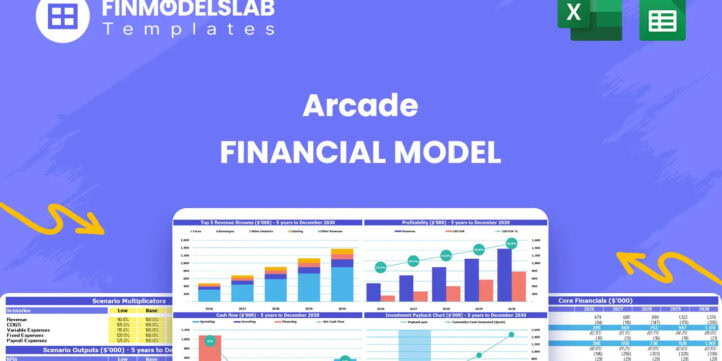


Financial Model Overview
The Arcade Financial Model is a ready-to-use financial model template created for planning, analyzing, and presenting the financial outlook of an arcade, game room, or family entertainment center. It helps users organize the numbers behind the business idea, including arcade game play sessions, food and beverage transactions, event bookings, merchandise sales, startup investment, payroll, operating expenses, cash flow, and profitability. Instead of rebuilding a forecast from scratch, entrepreneurs, business owners, consultants, analysts, and funding teams can start with a structured workbook that is designed around the economics of an arcade venue. The model is useful before launch, during funding preparation, or when evaluating expansion because it connects key assumptions to projected financial results. Users can edit the inputs, test different scenarios, review investor-focused outputs, and prepare a more credible financial plan for decision-making, lender discussions, or stakeholder presentations.
All-in-One Dashboard
The all-in-one dashboard gives users a central place to view core inputs and core outputs for the Arcade Financial Model. It brings together the most important assumptions, such as customer volume, game play pricing, food and beverage spending, event booking activity, operating cost levels, and major startup investment, then links those assumptions to high-level financial results. The dashboard is useful because arcade businesses have several moving parts, and owners need a fast way to see whether traffic, pricing, costs, and profitability are aligned. Instead of moving through multiple sheets to understand the forecast, users can review key figures such as total revenue, gross profit, EBITDA, cash balance, margins, and investment performance in one area. This helps with planning because users can quickly identify whether the model is financially viable, whether the assumptions need adjustment, and whether the arcade can support its fixed costs and growth goals. For presentations, the dashboard also helps simplify the financial story for investors, lenders, partners, and internal decision-makers who want a concise view of the business case.
Low, Base, and High Scenario Analysis
The low, base, and high scenario analysis section helps users evaluate how the arcade business may perform under different operating conditions. An arcade forecast depends heavily on assumptions such as monthly visitor traffic, average game play spend, event booking volume, food and beverage conversion, pricing growth, and cost inflation. This component allows users to compare a conservative case, a realistic planning case, and an upside case so they can understand the range of possible outcomes before committing capital. The outputs may show how revenue, profit, cash flow, payback, and funding needs change when assumptions move up or down. This is valuable for risk management because it helps users identify the minimum level of sales needed to remain stable, the potential upside if marketing and customer demand perform well, and the downside exposure if traffic is slower than expected. Scenario analysis also strengthens funding discussions because investors and lenders often want to see that the business plan has been stress-tested rather than built around a single optimistic forecast.
Professional Charts
The professional charts component turns key financial outputs into presentation-ready visuals that are easier to understand than raw spreadsheet rows. The Arcade Financial Model can translate revenue growth, expense trends, profit margins, cash flow, and investment metrics into charts that help users communicate the business outlook more clearly. This is especially useful for arcade operators preparing pitch decks, loan packages, board updates, or internal planning documents, because visual reports help stakeholders quickly grasp the direction and scale of the forecast. Inputs from the model, including game play revenue, food and beverage sales, event bookings, operating expenses, payroll, capital spending, and cash balances, can feed into visual summaries. The resulting charts help users identify trends, compare performance across years, and explain why certain assumptions matter. For example, a chart showing revenue growth by year can support the market opportunity discussion, while a cash flow chart can highlight liquidity needs and the timing of capital recovery. This component improves decision-making by making complex financial information more accessible, polished, and actionable.
ROE Components and DuPont Analysis
The ROE components and DuPont analysis section helps users understand what drives return on equity in the arcade business. Rather than looking only at a single return percentage, this component breaks performance into underlying factors such as profit margin, asset efficiency, and financial leverage. For an arcade, these drivers matter because the business often requires significant upfront investment in game machines, venue build-out, renovation, kitchen or bar equipment, and other capital assets. DuPont analysis helps users see whether returns are being influenced more by operational profitability, efficient use of assets, or the financing structure of the business. Inputs may include net income, revenue, total assets, equity, debt levels, and projected balance sheet values. The outputs can help evaluate whether the arcade is generating enough profit from its asset base and whether the capital structure supports acceptable investor returns. This section is useful for owners and investors because it adds depth to profitability analysis and helps explain how improvements in pricing, cost control, utilization, or funding strategy may improve overall returns.
Revenue Inputs
The revenue inputs section is where users define the commercial assumptions that drive the Arcade Financial Model. For an arcade, revenue is typically influenced by several streams, including game play sessions, food and beverage transactions, event bookings, parties, group rentals, memberships, merchandise, and other add-on sales. This component allows users to enter assumptions such as starting game session volume, average price per session, expected annual growth, average food and beverage spend, event pricing, event frequency, and customer conversion rates. These inputs flow through the model to generate sales forecasts, profitability projections, cash flow, and investor outputs. The section is useful because revenue forecasting for an arcade must be grounded in realistic traffic and spend-per-visit assumptions rather than broad estimates. By separating the drivers of each revenue stream, users can test pricing strategies, evaluate the effect of higher event volume, assess the impact of food and beverage sales, and understand which streams contribute most to growth. This creates a clearer basis for business planning and makes the forecast easier to explain to lenders, investors, and operating teams.
Bank-Ready Reports
The bank-ready reports component provides lender-friendly financial outputs that can support loan discussions, funding applications, and stakeholder review. Banks and financing partners typically want to see organized projections, clear assumptions, cash flow visibility, profitability expectations, and evidence that the business can cover its obligations. This section helps present the arcade forecast in a structured format, including projected income statements, cash flow statements, balance sheets, debt-related outputs, and financial summaries. Inputs from revenue, startup costs, operating expenses, payroll, capital expenditures, and financing assumptions feed into these reports so users can present a complete financial picture. For arcade businesses, bank-ready reporting is especially important because startup funding may be needed for machines, leasehold improvements, deposits, furniture, signage, kitchen equipment, initial inventory, and working capital. The reports help users show how borrowed funds may be used, when the business is expected to generate positive cash flow, and whether projected operating performance can support repayment. This component saves time and improves credibility by turning the forecast into a more professional funding document.
Revenue Breakdown
The revenue breakdown section gives users a detailed view of each revenue stream inside the arcade business. Rather than showing only total sales, this component separates income sources such as game play sessions, food and beverage transactions, event bookings, parties, merchandise, memberships, and other optional revenue categories. The model can use assumptions such as unit volumes, average selling prices, seasonal changes, growth rates, and customer behavior to calculate monthly and annual revenue by stream. This is useful because an arcade venue may rely on a mix of high-volume game play and higher-ticket events, and each stream can have different margins, capacity limits, and growth opportunities. A clear breakdown helps users identify which revenue categories drive the most value, which assumptions require closer validation, and where marketing or operational improvements could have the biggest financial impact. It also supports decision-making around pricing, promotions, event packages, food and beverage strategy, and expansion planning. For investors and lenders, this section makes the revenue forecast more transparent and easier to evaluate.
KPI Dashboard
The KPI dashboard focuses on performance metrics and benchmarks that help users measure the health of the arcade business over time. While the all-in-one dashboard provides a broad financial summary, the KPI dashboard is more focused on operational and financial indicators that can guide management decisions. These may include revenue per visitor, average spend per game session, event revenue per booking, food and beverage contribution, gross margin, EBITDA margin, cash runway, payback period, return metrics, cost ratios, and utilization-related measures. Inputs from the forecast feed into the dashboard to help users monitor whether the business is performing in line with expectations. This component is valuable because arcade operators need more than annual profit figures to manage the business effectively. They need to understand whether customer spend is increasing, whether operating expenses are staying within target ranges, whether staffing levels are efficient, and whether revenue streams are performing against benchmarks. The KPI dashboard helps turn the financial model into a management tool, allowing users to track progress, identify issues early, and present performance clearly to stakeholders.
Startup and Operating Cost Planner
The startup and operating cost planner helps users estimate the investment required to launch and run the arcade business. Startup costs may include arcade game machines, venue build-out, renovation, lease deposits, signage, furniture, point-of-sale systems, kitchen and bar equipment, licenses, permits, insurance, initial inventory, pre-opening marketing, professional fees, and working capital reserves. Operating expenses may include rent, utilities, repairs and maintenance, payment processing fees, software subscriptions, insurance, cleaning, marketing, supplies, cost of goods sold, and other recurring costs. This component allows users to separate one-time capital expenditures from ongoing monthly expenses, which is important for understanding both funding needs and long-term profitability. The outputs help estimate total launch capital, monthly overhead, variable costs, and the cash required before the business becomes self-sustaining. For an arcade, this section is particularly useful because equipment and build-out costs can be significant, and underestimating them can create funding gaps. A structured cost planner supports budgeting, investor conversations, loan requests, and operational decision-making by making the full cost structure visible before major commitments are made.
Break-Even Analysis
The break-even analysis section helps users identify when the arcade business is expected to cover its costs and begin generating profit. It connects revenue assumptions, gross margins, fixed operating expenses, payroll, startup costs, and cash flow timing to estimate how much sales volume is needed to reach break-even. For an arcade, break-even may depend on game session traffic, event bookings, food and beverage sales, pricing, rent, staffing, machine costs, and other recurring expenses. This component helps users understand the relationship between customer volume and financial sustainability, making it easier to set realistic sales targets and launch priorities. Outputs may include break-even month, required monthly revenue, required number of game sessions, contribution margin, and the effect of changes in price or cost structure. The analysis is useful for planning because it shows whether the business has a practical path to profitability and what must happen operationally to get there. It also strengthens funding presentations because investors and lenders want to know when the business can stop relying on startup capital and begin supporting itself from operating cash flow.
File types:
Excel – Single-User: .xlsx
Excel – Multi-User: .xlsx
Similar ProductsOther customers were also interested in...


 HenrySheykin
Trampoline Park Business Financial Model Excel Tem...
The Trampoline Park Financial Model helps entrepreneurs, founders, consultants, analysts, and busine... Read more
Game Center Business Plan Financial Model Excel Te...
The Game Center Financial Model Financial Model Template helps entrepreneurs, founders, business own... Read more

Bingo Hall Business Plan Financial Model Excel Tem...
The Bingo Hall Financial Model helps users turn a bingo venue concept into a structured, editable fi... Read more
Paintball Financial Model Excel Template
The Paintball Financial Model helps entrepreneurs, founders, consultants, analysts, and business own... Read more
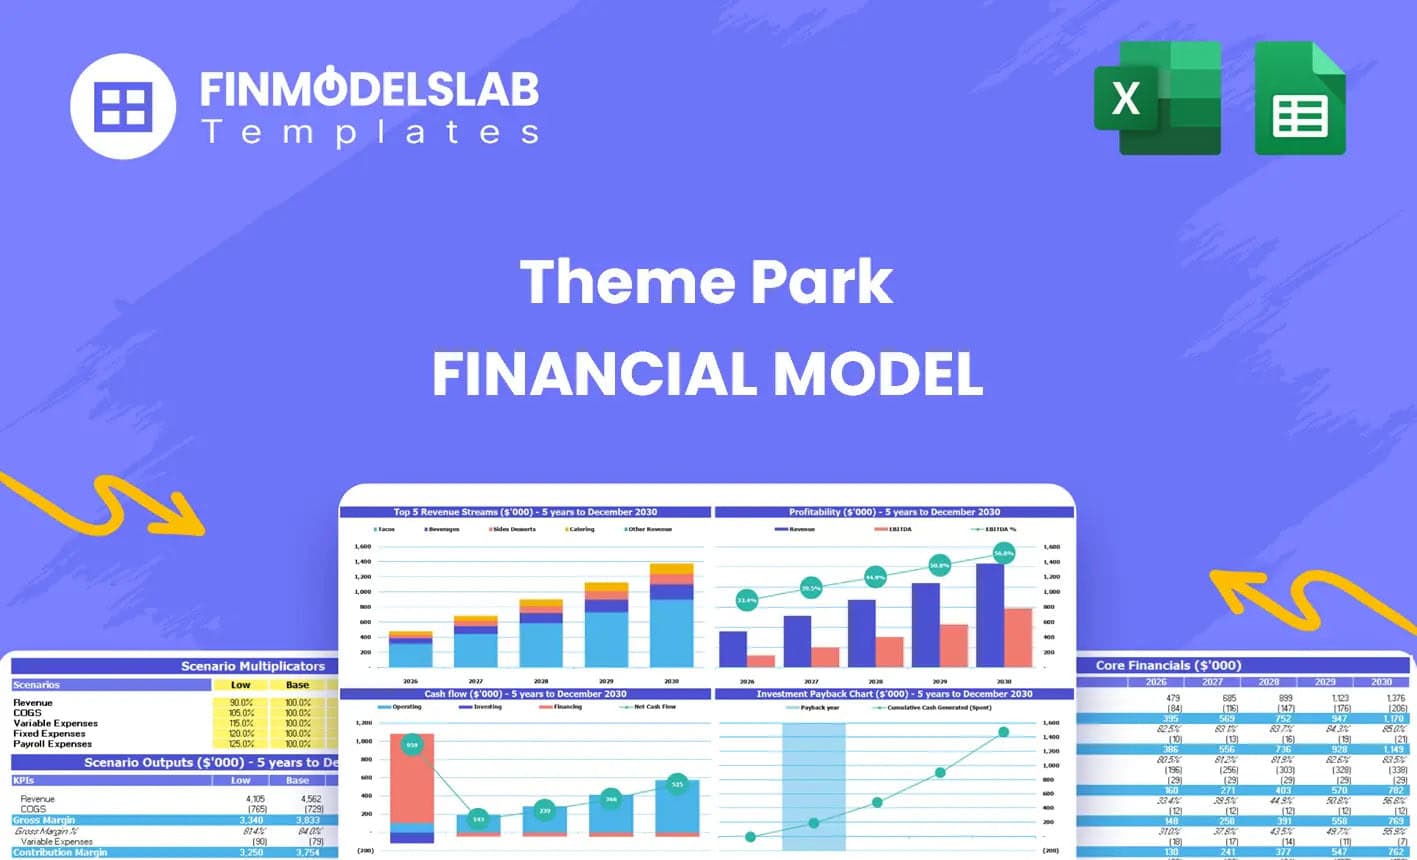
Theme Park Business Plan Financial Model Excel Tem...
The Theme Park Financial Model helps entrepreneurs, developers, operators, consultants, analysts, an... Read more

Skate Park Business Plan Financial Model Excel Tem...
The Skate Park Financial Model helps entrepreneurs, founders, consultants, analysts, and business ow... Read more

 Giorgos
Golf & Entertainment Center – 5 Year Financi...
Financial Model providing an advanced 5-year financial plan for a startup or operating Golf & En... Read more

Escape Room Financial Model – 5 Year Forecast
Financial Model providing an advanced 5-year financial plan for a startup or operating Escape Room B... Read more

Family Entertainment Center – 5 Year Financial M...
Financial Model providing an advanced 5-year financial plan for a startup or operating Family Entert... Read more

Bowling & Billiards Center – Dynamic 10 Year...
Financial Model providing a dynamic up to 10-year financial forecast for a startup or existing Bowli... Read more
You must log in to submit a review.