
0 ITEMS

Maximized Margin and Revenue Pricing Analysis
Determines optimal sales price for highest profitability, based on comparison of sales at two price points.


This tool is used to analyze sales results by comparing the sales data of a product and/or service sold at 2 different prices. This can be useful when a business is investigating the best price points of their products/services to achieve the highest Net Margin.
Instructions:
The user simply enters the selling prices and the number of “Items” sold at a lower and higher price, and the cost to produce the product and/or service. Based on the information entered, formulas will calculate an expected price for both a Maximised Margin and a Maximised Revenue.
Next, the user can enter a Proposed Price, which will then give the quantity to sell, Gross Revenue, and Net Margin of their suggested price.
Note:
Depending on Demand Elasticity (the effect of any loss of demand due to a higher price), the tables and charts then illustrate why striving for higher total Gross Revenue may actually be harming your bottom line Net Margin.
Similar ProductsOther customers were also interested in...



 Anuj
Private Equity Fund Model (Investor Cashflows)
The Private Equity Fund Cashflows Model helps LPs and GPs analyze fund cash flows, returns, and dist... Read more

 Giorgos
Advanced Financial Model with DCF and Valuation
Dynamic 10-Year Financial Model, suitable for any type of business, supporting strategic planning, i... Read more
 Pierre-AlexandreHeur...
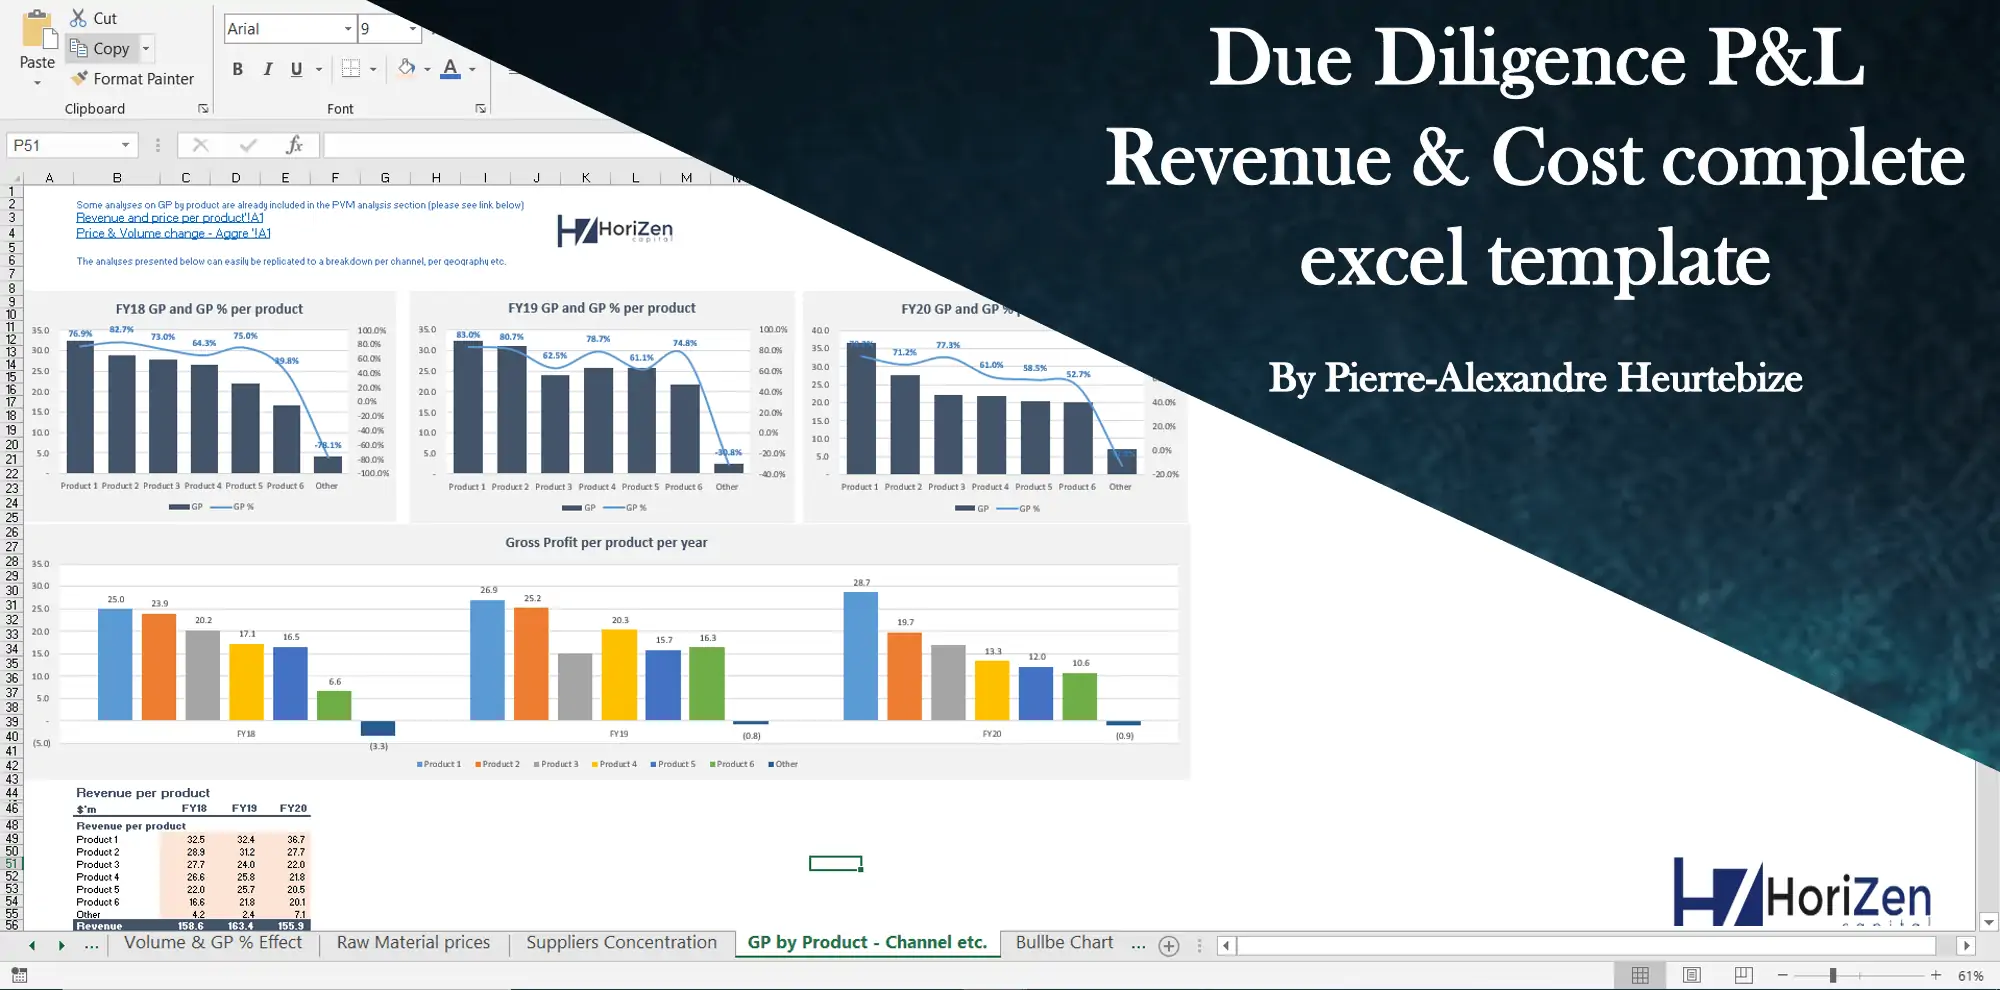
Due Diligence P&L – Exhaustive Revenue a...
Model for in depth understanding of high level profit and loss and revenue analysis. Big-4 like chec... Read more

Startup Company Financial Model – 5 Year Fin...
Highly-sophisticated and user-friendly financial model for Startup Companies providing a 5-Year adva... Read more

 NEETEM
Feasibility Study Template – 10 years Model
Advance Feasibility studies template for 10 years ( Financial model for any projects & Feasibili... Read more
Budgeting & Forecasting Model Template
Budgeting & Forecasting Template suitable for either a Trade or Service company in any type of i... Read more

General Financial Models – All-in-One Bundle
A collection of templates suitable for various types of businesses/industries, covering major accoun... Read more

Investment Financial Models – All-in-One Bundle ...
A collection of templates suitable for investment decisions in various types of businesses/industrie... Read more
You must log in to submit a review.