
0 ITEMS

Excel Grade Book: Weighted Formulas Cut Grading Time

An Excel grade book built with SUMPRODUCT weighted formulas and data validation can replace hours of manual calculation with a single spreadsheet that updates automatically every time you enter a score.
Key Takeaways
- SUMPRODUCT is the single most powerful formula for weighted grade calculation: one formula handles all category weights simultaneously, eliminating manual multiplication across 5+ assignment types.
- A properly structured Excel grade book uses at least 4 worksheets: Student Roster, Grade Categories, Raw Scores, and Summary Dashboard.
- Nested IF statements can assign letter grades automatically across a 6-tier scale (A through F) using a single formula cell per student.
- FERPA (the Family Educational Rights and Privacy Act) requires that digital grade records restrict unauthorized access; password-protecting your Excel workbook and limiting cell editing are minimum compliance steps.
- Data validation rules that restrict score entries to 0-100 eliminate the most common grade book error: accidental text entries in numeric columns.
- Dropping the lowest score from a category requires SUMPRODUCT combined with MIN and COUNT, a 3-function combination most educators don’t know exists in Excel.
- Conditional formatting with a 3-color scale lets you spot at-risk students (below 60%) at a glance across a class of 30 or more.
Foundation: Setting Up Your Excel Grade Book Architecture
A well-structured Excel grade book separates student identity data, grade categories, raw scores, and summary calculations across dedicated worksheets so that formulas stay clean and data stays auditable.
Start by creating 4 worksheets inside one workbook:
- Roster: Student ID, Last Name, First Name, Email, Section
- Categories: Category name, weight percentage, max points per assignment
- Scores: One column per assignment, one row per student, linked to Roster by Student ID
- Summary: Weighted final grade, letter grade, rank, and at-risk flag
Keep Student ID as the primary key (the unique identifier that links rows across worksheets). Never use student names as keys because duplicate names break VLOOKUP and INDEX/MATCH lookups. According to the U.S. Department of Education, student ID numbers are the recommended non-directory identifier for internal academic records. Source
Name your category weight cells using Excel’s Named Ranges feature (Formulas tab, Define Name). For example, name cell C2 on the Categories sheet ExamWeight. Named ranges make formulas readable: =ExamWeightExamAverage is far easier to audit than =Categories!C2Summary!F4.
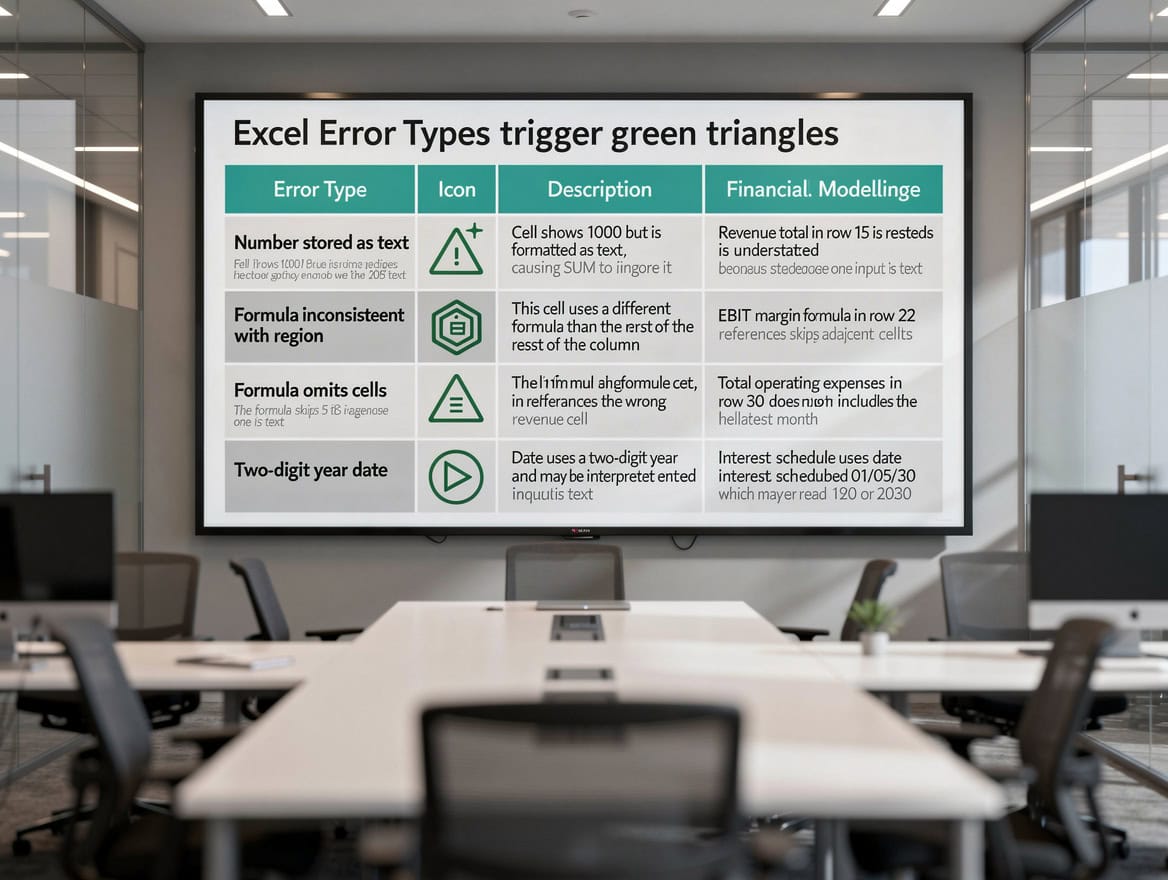
Using Student ID as the primary key across all 4 worksheets prevents name-matching errors and keeps VLOOKUP lookups reliable.
Essential Formulas for Accurate Grade Calculation
Four formulas handle 90% of grade book calculations: AVERAGE, SUMPRODUCT, nested IF, and RANK.EQ.
AVERAGE calculates a simple mean across a row of scores:
=AVERAGE(C2:L2)
This averages scores in columns C through L for the student in row 2.
Nested IF assigns letter grades based on numeric thresholds. Excel supports up to 64 levels of nesting, which is far more than the 6 tiers a standard A-F scale requires. Source
=IF(N2>=90,”A”,IF(N2>=80,”B”,IF(N2>=70,”C”,IF(N2>=60,”D”,”F”))))
Place this in the Letter Grade column (column O) and copy it down for every student row.
RANK.EQ ranks each student’s final grade within the class without sorting the data:
=RANK.EQ(N2,$N$2:$N$31,0)
The 0 argument sorts descending (highest grade = rank 1). The dollar signs create an absolute reference (a cell reference that does not shift when you copy the formula down) so the range stays fixed.
PERCENTILE applies a curve by finding the score at a given percentile:
=PERCENTILE($N$2:$N$31,0.9)

Nested IF evaluates conditions left to right and stops at the first TRUE result, so always start with the highest grade threshold.
Implementing Weighted Grading Systems in Excel
SUMPRODUCT is the correct formula for weighted grade calculation because it multiplies each category average by its weight and sums the results in a single step, with no helper columns required.
Worked Example: 4-Category Weighted Final Grade
Assume the following grade book structure:
| Category | Weight | Student Average |
|---|---|---|
| Exams | 40% | 82 |
| Quizzes | 25% | 91 |
| Homework | 25% | 95 |
| Participation | 10% | 88 |
Here’s the math:
- Exams: 82 × 0.40 = 32.80
- Quizzes: 91 × 0.25 = 22.75
- Homework: 95 × 0.25 = 23.75
- Participation: 88 × 0.10 = 8.80
- Weighted Final = 32.80 + 22.75 + 23.75 + 8.80 = 88.10
The SUMPRODUCT formula that performs this automatically (assuming weights are in B2:B5 and averages are in C2:C5):
Verify your weights sum to 100% with =SUM(B2:B5). If the result is not 1 (or 100%), your weighted grades will be systematically wrong. Excel’s SUMPRODUCT function can handle arrays of up to 255 arguments, meaning you can accommodate far more grade categories than a typical course requires in a single formula. Source
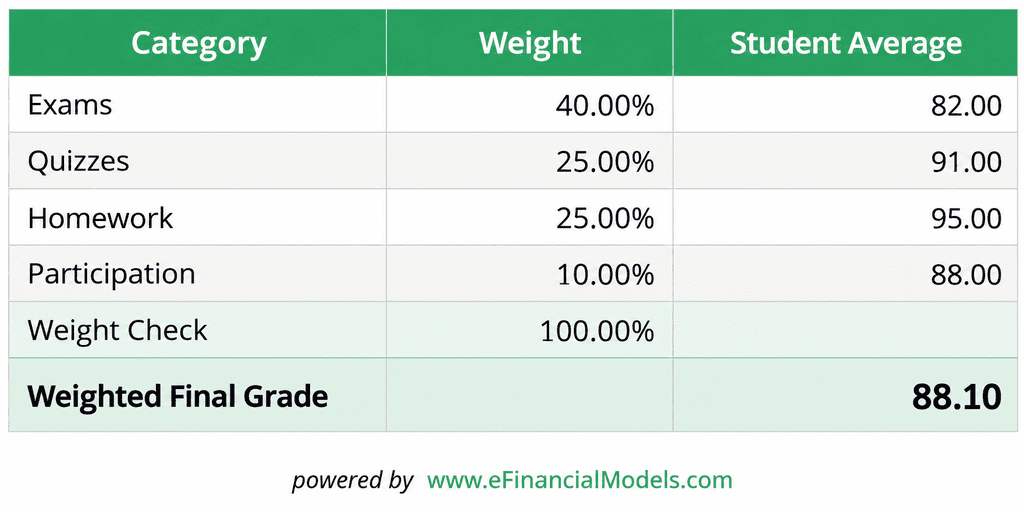
SUMPRODUCT(B2:B5, C2:C5) = 88.10 — the formula multiplies each category average by its weight and sums the results in one step.
SUMPRODUCT multiplies each category average by its weight and sums the results in one formula, eliminating manual multiplication errors.
Data Validation and Error Prevention Techniques
Data validation rules (Excel’s built-in feature that restricts what a user can type into a cell) prevent the most common grade book errors before they corrupt your formulas.
Apply these three validation rules immediately after building your Scores sheet:
- Numeric range for scores: Select the score columns, go to Data, Data Validation, set Allow to “Whole number”, Minimum 0, Maximum 100. This blocks text entries like “absent” from breaking AVERAGE formulas.
- Dropdown for letter grades: On the Summary sheet, set the Letter Grade column to a List validation with values A,B,C,D,F. This prevents typos like “a” or “A+” from appearing in reports.
- Percentage check for weights: On the Categories sheet, add a SUM formula below the weight column and apply conditional formatting to turn it red if the total is not exactly 100%.
Conditional formatting (rules that change a cell’s color based on its value) adds a visual safety net. Apply a 3-color scale to the Final Grade column: red for below 60, yellow for 60-79, green for 80 and above. At-risk students appear in red the moment you enter their scores. Excel’s conditional formatting supports up to 64 conditions per cell range, giving you far more rule flexibility than a typical grade book scenario requires. Source
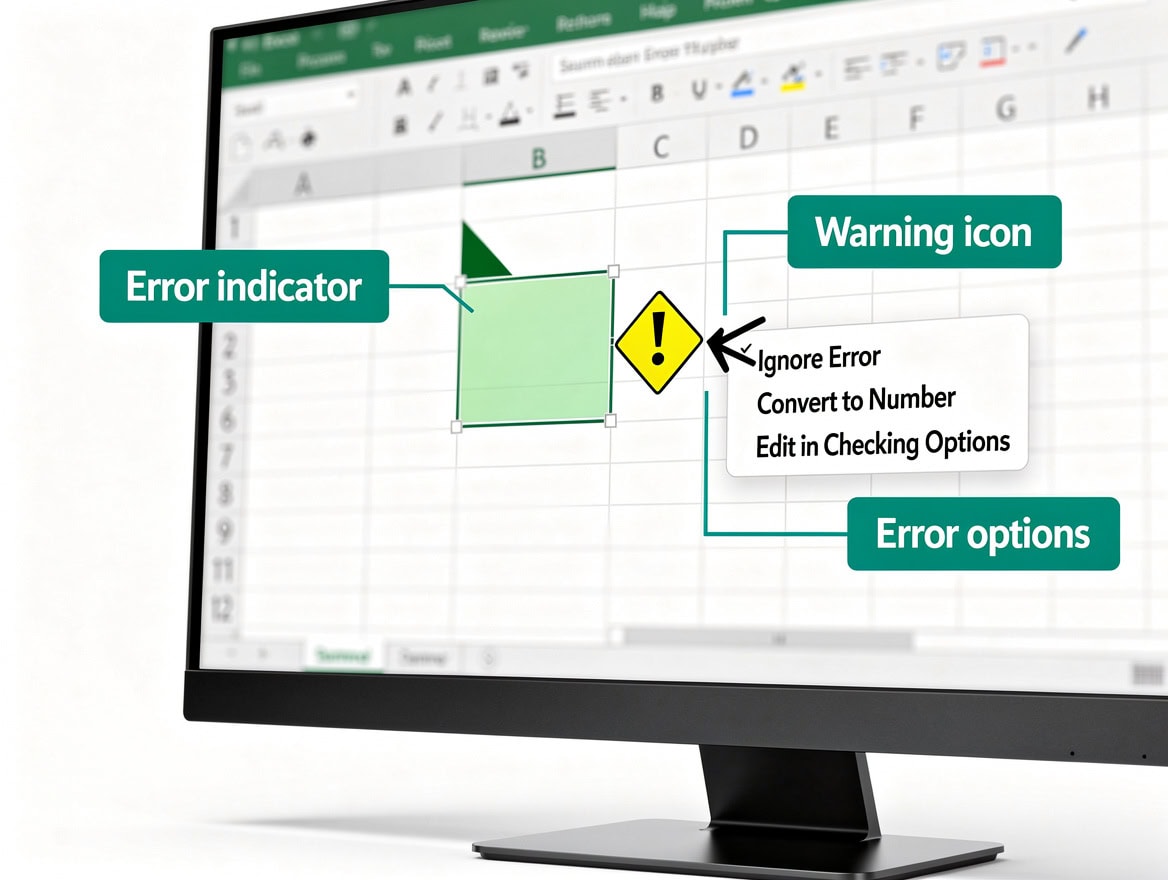
Data validation rules that restrict entries to 0-100 block the most common grade book error: accidental text in numeric score columns.
Automating Repetitive Grade Management Tasks
Excel’s auto-fill, named ranges, and cell protection features eliminate the three most time-consuming manual tasks in grade management: copying formulas, updating semester constants, and preventing accidental overwrites.
Auto-fill formulas: Enter your SUMPRODUCT formula in the first student row, then double-click the fill handle (the small square at the bottom-right of the cell) to copy it instantly to all rows with adjacent data. For a class of 30 students, this takes under 2 seconds.
Named ranges for semester constants: Define names for values that appear in multiple formulas: PassingThreshold (60), ExtraCredit_Cap (5), LatePenaltyPerDay (2). Update the named cell once at the start of each semester and every formula referencing it updates automatically.
Cell protection: Lock formula cells so co-teachers or teaching assistants cannot accidentally overwrite them. Select the formula cells, Format Cells, Protection tab, check Locked. Then go to Review, Protect Sheet, and set a password. Leave only the score-entry cells unlocked. The U.S. National Institute of Standards and Technology recommends password-protecting sensitive educational records as a baseline access control measure. Source
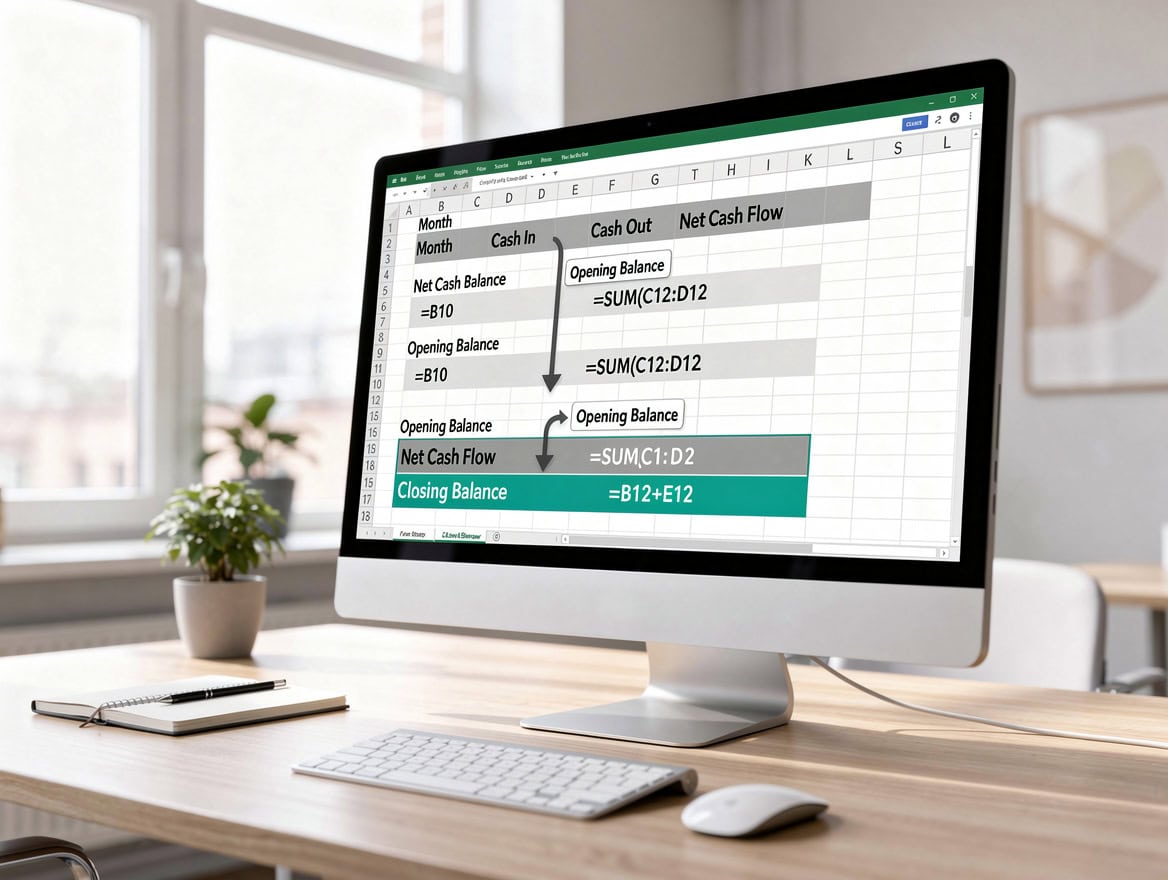
Locking only formula cells lets teaching assistants enter scores freely while preventing accidental overwrites of SUMPRODUCT and IF formulas.
Handling Special Grading Scenarios and Exceptions
Four grading scenarios require formulas beyond basic AVERAGE: dropping the lowest score, adding extra credit, managing incomplete grades, and applying late penalties.
Drop lowest score: Use SUMPRODUCT with MIN to exclude the lowest quiz score from the average:
=(SUM(C2:G2)-MIN(C2:G2))/(COUNT(C2:G2)-1)
This sums all scores, subtracts the minimum, then divides by one fewer than the total count.
Extra credit: Add extra credit points to the numerator only, not the denominator:
=(SUM(C2:G2)+H2)/SUM(MaxPoints)
Where H2 is the extra credit cell and MaxPoints is a named range of maximum possible points. This correctly raises the percentage above 100% without inflating the denominator.
Incomplete grades: Use an IF statement to flag incomplete grades and exclude them from class averages:
=IF(N2=”I”,”Incomplete”,SUMPRODUCT(B2:B5,C2:C5))
Then use =AVERAGEIF(O2:O31,”<>Incomplete”,N2:N31) to calculate class averages that exclude incomplete students.
Late penalties: Apply a per-day deduction with MAX to prevent negative scores:=MAX(0, RawScore - (DaysLate * LatePenaltyPerDay))

The drop-lowest formula subtracts the minimum score from the sum and divides by one fewer than the count, automatically excluding the worst result.
Privacy Protection and FERPA Compliance Strategies
FERPA (the Family Educational Rights and Privacy Act, the 1974 federal law governing student education records) requires that educators protect student grade data from unauthorized disclosure. Digital grade books stored in Excel must meet minimum security standards.
Three FERPA-aligned practices for Excel grade books:
Password-protect the workbook: Use a strong password (12+ characters, mixed case, numbers, symbols) via File, Info, Protect Workbook, Encrypt with Password.
Separate sensitive data: Keep student contact information (email, phone) on a separate, more restricted worksheet from grade data. Share only the grade summary sheet with co-teachers who need it.
Avoid cloud storage without institutional approval: Storing FERPA-protected records on personal cloud accounts (personal Google Drive, personal Dropbox) without institutional data agreements may violate FERPA. Use your institution’s approved storage system. The U.S. Department of Education’s FERPA guidance explicitly covers electronically stored education records. Source
Back up your grade book to your institution’s server after every grading session. A single hardware failure without a backup can mean reconstructing weeks of grade entries.

*Encrypting your Excel grade book with a strong password is the minimum FERPA-aligned access control for electronically stored student records.*
Importing and Exporting Data from LMS Platforms
Canvas, Blackboard, Moodle, and Google Classroom all export grade data as CSV files (comma-separated values, a plain-text format that Excel opens natively), making it straightforward to import LMS data into your Excel grade book.
Importing from Canvas: In Canvas, go to Grades, Export, and download the CSV. Open it in Excel, then use VLOOKUP or INDEX/MATCH to pull scores into your master grade book by matching Student ID columns.
Importing from Google Classroom: Google Classroom exports grades via Google Sheets. Download as .xlsx (File, Download, Microsoft Excel) and copy the score columns into your master workbook.
Exporting back to LMS: Most LMS platforms accept CSV uploads for bulk grade entry. Format your export with the exact column headers the LMS expects (typically Student ID, Assignment Name, Score). Use Excel’s Save As, CSV (Comma delimited) option.
One critical rule: always match on Student ID, never on student name. Name formatting differences between systems (“Smith, John” vs. “John Smith”) cause VLOOKUP mismatches that silently assign grades to the wrong students.

Always match LMS imports to your master grade book by Student ID, not student name, to prevent silent mismatches from name formatting differences.
Excel vs. Dedicated Grade Book Software: When to Switch
Excel is the right tool for grade management in many situations, but dedicated software outperforms it at specific thresholds.
| Factor | Excel Grade Book | Dedicated Software |
|---|---|---|
| Class size | Up to ~150 students | 150+ students |
| Setup time | 2-4 hours | 30-60 minutes |
| LMS integration | Manual CSV import | Automatic sync |
| FERPA controls | Manual (password) | Built-in audit logs |
| Cost | Included with Office | $0-$15/month |
| Formula flexibility | Full control | Limited to presets |
| Collaboration | Shared workbook | Real-time multi-user |
For a single instructor managing 1-3 sections of under 50 students each, Excel provides more flexibility at lower cost. For department-wide grade management or classes exceeding 150 students, dedicated platforms offer automated LMS sync and built-in audit trails that Excel cannot replicate without significant manual effort.

Always match LMS imports to your master grade book by Student ID, not student name, to prevent silent mismatches from name formatting differences.
Frequently Asked Questions
How do I calculate weighted grades in Excel without making errors?
Use SUMPRODUCT instead of manually multiplying each category. The formula =SUMPRODUCT(WeightRange, AverageRange) multiplies each weight by its corresponding average and sums the results in one step. For example, if your weights are in B2:B5 (0.40, 0.25, 0.25, 0.10) and category averages are in C2:C5 (82, 91, 95, 88), the formula returns 88.10. The most common error is weights that don’t sum to 1.0: always verify with =SUM(WeightRange) and confirm it equals exactly 1. If it returns 0.99 or 1.01 due to rounding, your final grades will be systematically off by a fraction of a point across every student.
How do I drop the lowest quiz score automatically in Excel?
Use this formula: =(SUM(C2:G2)-MIN(C2:G2))/(COUNT(C2:G2)-1). It sums all scores in the range, subtracts the minimum value (the lowest score), then divides by one fewer than the count of scores. For 5 quiz scores of 70, 85, 90, 78, and 92, the formula calculates (415-70)/4 = 86.25, correctly excluding the 70. Copy this formula down the column for every student. If a student has a missing score (blank cell), COUNT ignores blanks, so you may need to adjust the denominator using COUNTA or a fixed number depending on your policy for missing assignments.
What is the correct nested IF formula for assigning letter grades in Excel?
The standard 5-tier formula is: =IF(N2>=90,”A”,IF(N2>=80,”B”,IF(N2>=70,”C”,IF(N2>=60,”D”,”F”))))`. Excel evaluates conditions left to right and stops at the first TRUE result, so order matters: always start with the highest threshold. For a plus/minus scale (A+, A, A-), you need 12 tiers, which still fits within Excel’s 64-level nesting limit per Microsoft’s function specifications. Place the formula in the Letter Grade column and use absolute references for the score column if you plan to copy it horizontally as well as vertically.
How do I protect formula cells so teaching assistants can’t overwrite them?
First, select all cells in the worksheet and go to Format Cells, Protection, and uncheck Locked. This unlocks everything. Then select only your formula cells, go back to Format Cells, Protection, and check Locked. Finally, go to Review, Protect Sheet, enter a password, and confirm. Now only the score-entry cells (which you left unlocked) are editable without the password. Teaching assistants can enter scores freely but cannot modify the SUMPRODUCT, letter grade, or ranking formulas. Document the password in your institution’s secure password manager, not in the spreadsheet itself.
How do I make my Excel grade book FERPA-compliant?
FERPA compliance for an Excel grade book requires three minimum steps: encrypt the workbook with a strong password (File, Info, Protect Workbook, Encrypt with Password), store the file only on your institution’s approved server or cloud storage system (not a personal account), and never share a file containing full student names and grades with anyone not authorized to see that student’s record. The U.S. Department of Education clarifies that FERPA applies to electronically maintained education records, including spreadsheets. Additionally, avoid emailing grade files as attachments; use your institution’s secure file-sharing system instead.
Can Excel handle a grade book for 200+ students across multiple sections?
Yes, but it requires careful architecture. Use one worksheet per section rather than one giant sheet, and create a Summary worksheet that pulls data from each section using 3D references or INDIRECT formulas. Excel’s row limit is 1,048,576 rows per Microsoft’s specifications, so raw data volume is not the constraint. Source The real challenge at 200+ students is formula recalculation time and the risk of version conflicts when multiple instructors edit the same file. At this scale, consider using Excel’s Power Query feature to consolidate section data, or evaluate whether a dedicated grade management platform with automatic LMS sync would save more time than the Excel setup requires.
How do I create a progress report from my Excel grade book?
Build a Summary sheet that pulls each student’s current weighted average, letter grade, and assignment completion rate using VLOOKUP or INDEX/MATCH. Then use Excel’s mail merge integration with Microsoft Word: in Word, go to Mailings, Start Mail Merge, Letters, and connect to your Excel file as the data source. Insert merge fields for student name, current grade, and any flagged assignments. Word generates one personalized letter per student in a single merge operation. For a class of 30 students, this produces 30 individualized progress reports in under 5 minutes, compared to writing each one manually.
Conclusion
An Excel grade book built on SUMPRODUCT weighted formulas, data validation rules, and protected formula cells gives you a system that calculates accurately, flags at-risk students automatically, and stays FERPA-compliant with minimal ongoing effort. The architecture described here scales from a single section of 25 students to multi-section loads of 150+, and the same formula logic applies whether you’re managing a K-12 classroom or a university course.
I recommend downloading the Excel Grade Book Template from eFinancialModels, which includes pre-built SUMPRODUCT weighted grade formulas, a 6-tier nested IF letter grade column, conditional formatting for at-risk students, and protected formula cells ready for your first day of class.

























































