
0 ITEMS

DRC Copper-Cobalt Mining: Investment Outlook 2026-2031

No country holds the global energy transition in its hands quite like the Democratic Republic of Congo. It mines nearly three quarters of the world’s cobalt and ranks second in copper, the two metals that batteries and electrified grids cannot do without. For investors, that is both the opportunity and the warning. The geology is world-class, ore grades run several times the global average, and a single complex at Kamoa-Kakula can swing national production numbers on its own. But the returns hinge on variables that sit outside the orebody: the rail and power bottlenecks that decide whether output actually scales, the volatile cobalt by-product credit that can make or break copper economics, and the artisanal mining and sovereign risks that carry real financial weight. This guide works through production forecasts to 2031 under three scenarios, the mine economics behind a representative Katanga operation, and the infrastructure and ESG constraints every defensible investment case has to price in.
Key Takeaways
- The DRC produced 187,000 metric tons of cobalt in 2023, representing 73% of global mined supply — no other country comes close to that concentration of a single critical mineral (USGS Mineral Commodity Summaries 2024).
- Copper output grew 13.6% year-over-year, from 2.2 million MT in 2022 to 2.5 million MT in 2023, making the DRC the world’s second-largest copper producer (USGS Mineral Commodity Summaries 2024).
- Kamoa-Kakula alone targets 600,000+ tonnes of copper per year by 2027, backed by 43 million tonnes of contained copper reserves — enough to sustain production well beyond the 2031 forecast window.
- Mining products accounted for 95% of total DRC exports in 2022, creating extreme macroeconomic sensitivity to commodity price cycles (IMF 2023 Article IV Consultation).
- The artisanal and small-scale mining (ASM) sector employs 1.5 to 2 million people directly, creating supply chain traceability obligations that carry financial materiality for institutional investors.
- Base-case copper production reaches approximately 3.4 million MT by 2031 under a 5% compound annual growth rate assumption; the upside scenario (7% CAGR) pushes output to 3.75 million MT.
- All-in sustaining costs (AISC) for Katanga belt copper operations currently range from $1.50 to $2.20 per pound, providing meaningful margin at copper prices above $3.50/lb.
DRC Mining Sector: Production Scale and Global Market Position
The Democratic Republic of Congo is not merely a significant mining jurisdiction — it is the single most consequential source of two metals central to the global energy transition. In 2023, the DRC produced 187,000 metric tons of cobalt, accounting for approximately 73% of global mined cobalt supply, according to the U.S. Geological Survey Mineral Commodity Summaries 2024. Copper output reached 2.5 million metric tons in 2023, up from 2.2 million metric tons in 2022 — a 13.6% year-over-year increase that reflects accelerating project ramp-ups across the Katanga belt, per USGS Mineral Commodity Summaries 2024.
These two figures define the investment thesis: the DRC holds irreplaceable geological assets at a moment when battery supply chains and grid infrastructure demand both metals at scale. For equity analysts and project finance professionals, the 2026-2031 window represents the period in which several major expansions either deliver or disappoint. The Democratic Republic of Congo Mining Market Study 2026-2031 provides the production forecasts, scenario tables, and mine-economics benchmarks that anchor the analysis throughout this article.
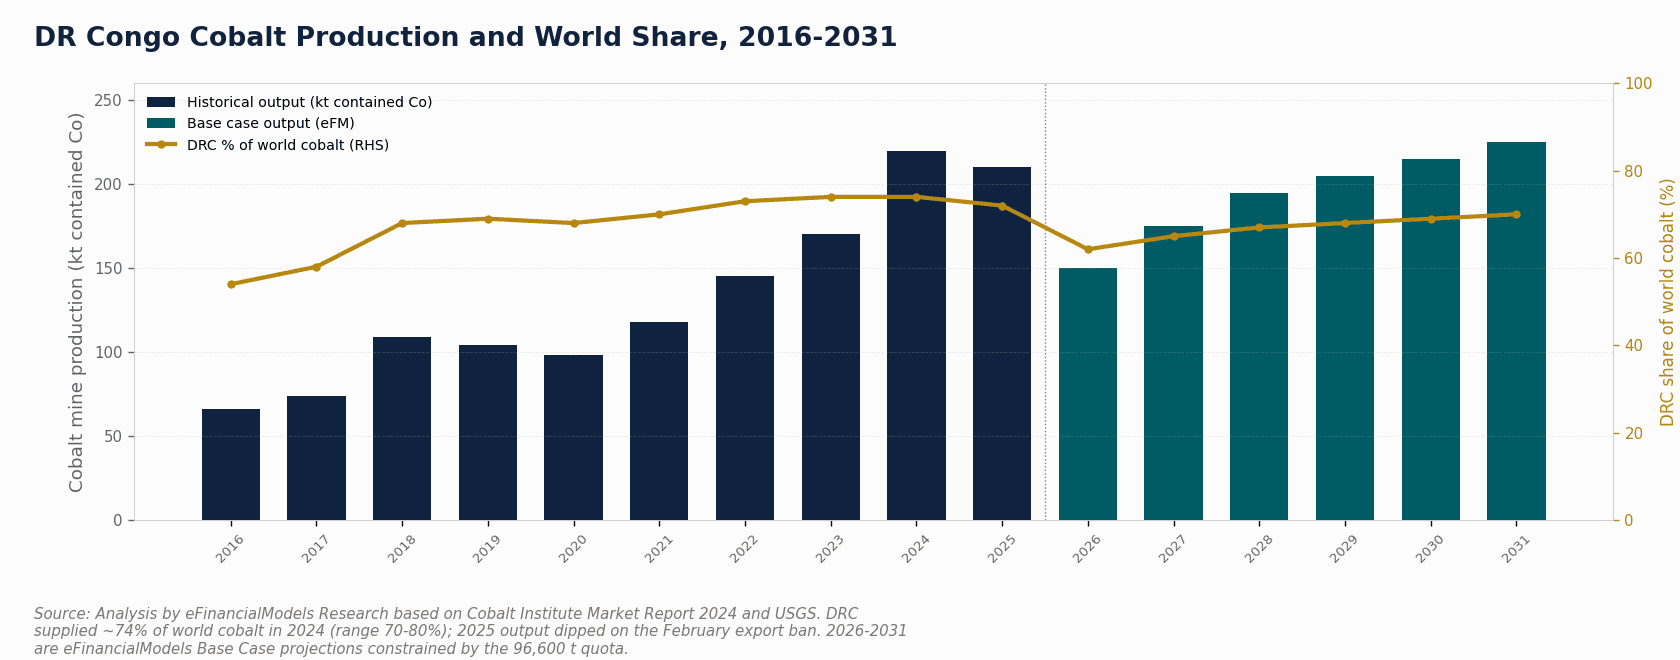
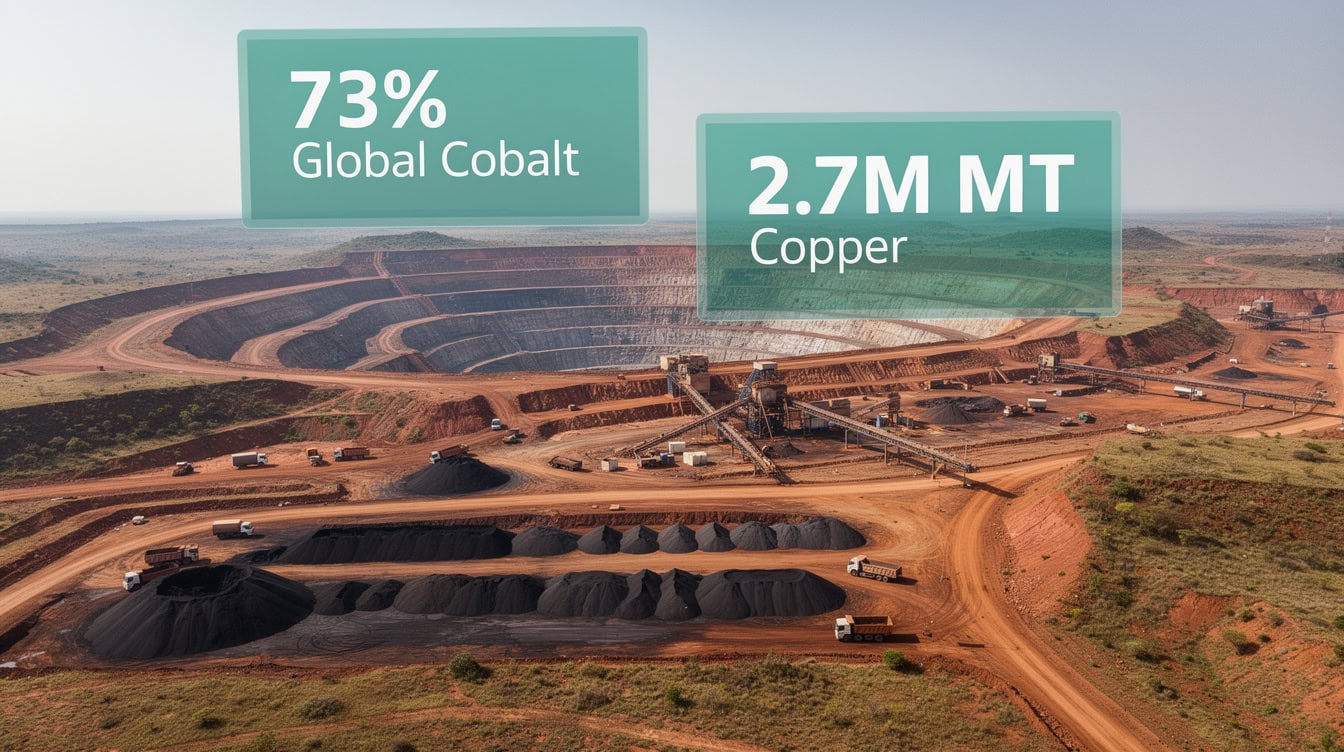
DRC 2023 production: 187,000 MT cobalt (73% of world supply) and 2.5M MT copper, up 13.6% from 2022. Source: USGS Mineral Commodity Summaries 2024.
Cobalt Dominance: 187,000 MT Production and 73% Global Supply Share
The DRC’s cobalt position is structurally dominant in a way that creates both opportunity and concentration risk for downstream buyers. Cobalt (chemical symbol Co, atomic number 27) is a critical co-product of copper mining in the Katanga belt — meaning its production volume is partly a function of copper throughput decisions, not an independently optimized output.
The 187,000 MT figure from USGS 2024 represents refined and mine-level production combined. For financial modeling purposes, analysts should distinguish between:
- Contained cobalt in ore: the gross metal content before processing losses
- Payable cobalt: the portion for which a smelter or refinery pays, typically 85-92% of contained metal
- Recovered cobalt: actual output after hydrometallurgical processing
Cobalt prices are highly volatile. The metal traded above $80,000 per metric ton in early 2022 before collapsing to approximately $25,000-$30,000 per metric ton by late 2023, driven by oversupply from DRC ASM production and inventory builds in China. This price cycle directly affects the co-product credit that makes marginal copper projects economically viable.
For scenario modeling, analysts should apply cobalt price assumptions of $25,000/MT (bear), $40,000/MT (base), and $60,000/MT (bull) for the 2026-2031 period, reflecting battery demand growth offset by continued DRC supply expansion.
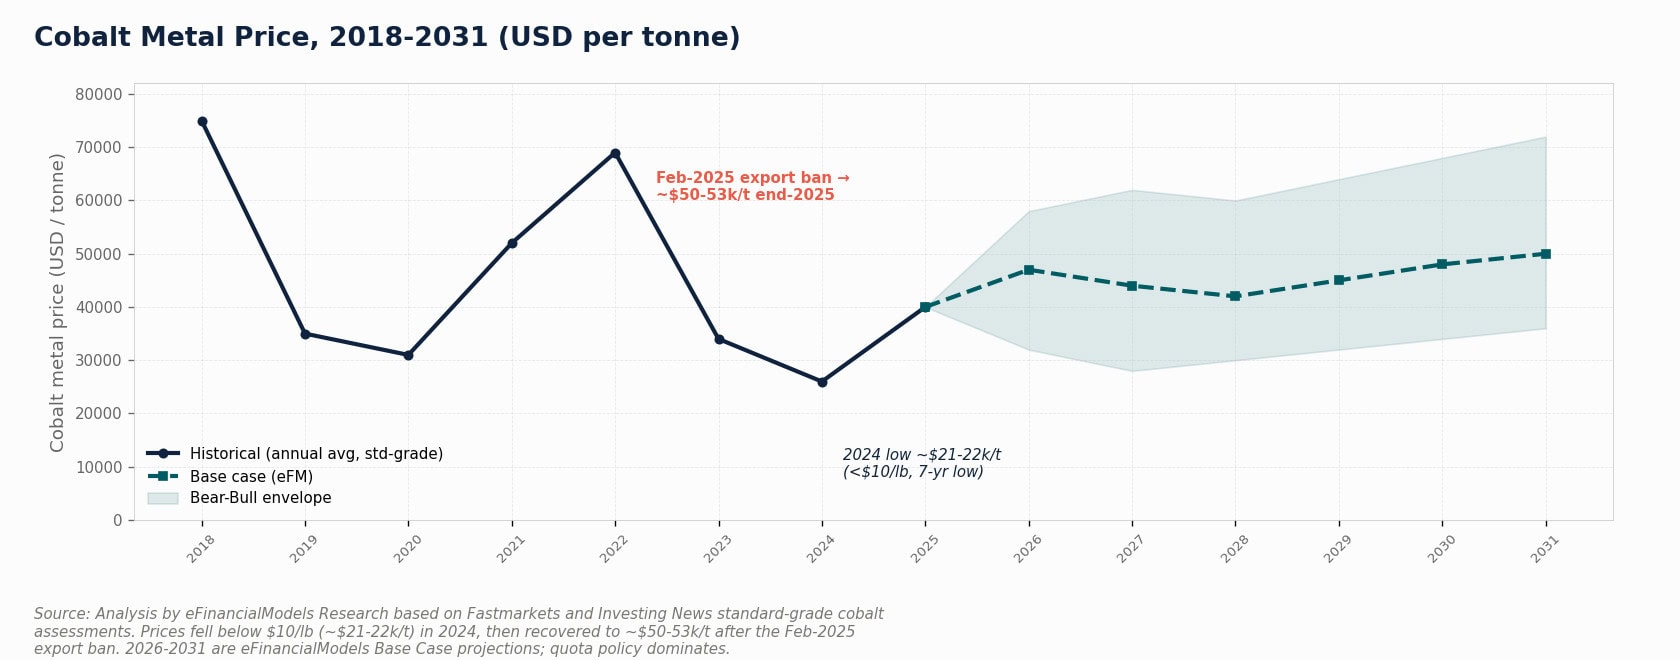
Cobalt prices collapsed from $80,000+/MT in 2022 to ~$25,000/MT by late 2023. The 2026-2031 base case assumes $40,000/MT, with a $25,000-$60,000/MT scenario range.
Copper Production Trajectory: 2.5M MT Baseline and Growth Drivers to 2031
Copper output in the DRC grew at 13.6% in 2023 and is forecast to continue expanding through 2031, driven by three primary catalysts: Kamoa-Kakula Phase 3 and 4 expansions, Glencore’s Katanga operations optimization, and China Molybdenum’s Tenke Fungurume ramp. The 2.5 million MT 2023 baseline, confirmed by USGS Mineral Commodity Summaries 2024, sets the starting point for forward projections.
Applying a transparent compound annual growth rate (CAGR) methodology:
Base case (5% CAGR): 2.5M MT × (1.05)^8 = approximately 3.70M MT by 2031
Upside case (7% CAGR): 2.5M MT × (1.07)^8 = approximately 4.29M MT by 2031
Downside case (2% CAGR): 2.5M MT × (1.02)^8 = approximately 2.93M MT by 2031
The downside scenario reflects infrastructure bottlenecks, power supply constraints, and political risk materializing as production delays rather than outright shutdowns.
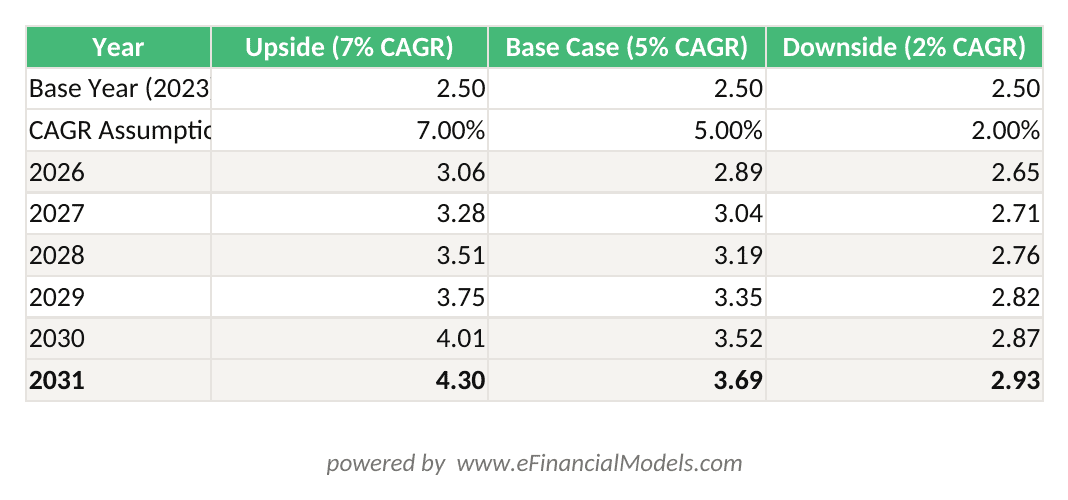
DRC copper output under three CAGR scenarios: base case reaches 3.70M MT by 2031. Formula: =Base_Year(1+CAGR)^Years. Adjust CAGR in B3:D3 to run sensitivity analysis.
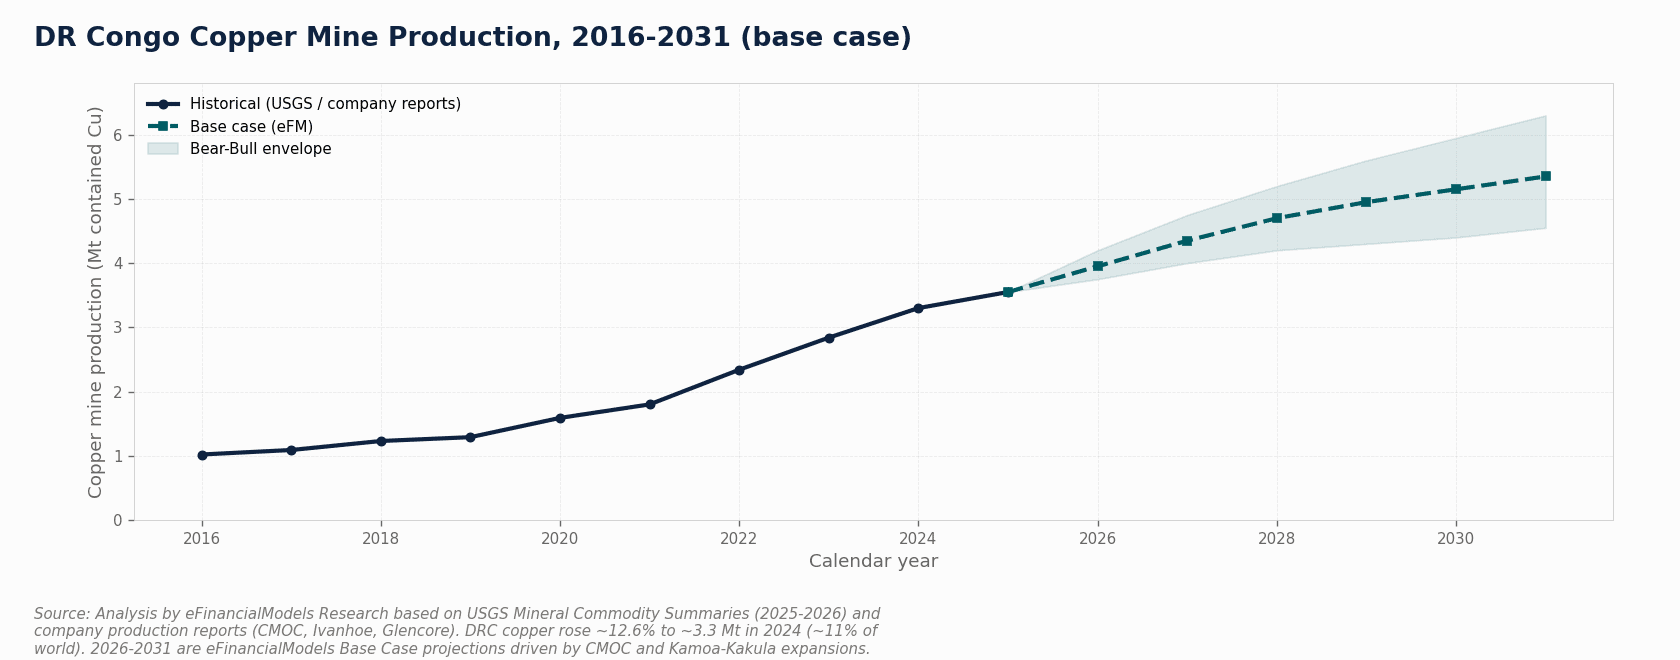
DRC copper output reaches 3.70M MT by 2031 under the base case (5% CAGR), versus 4.29M MT upside and 2.93M MT downside. Kamoa-Kakula Phase 4 is the key swing variable.*
Kamoa-Kakula Complex: Reserve Base, Production Ramp, and Sector Impact
Kamoa-Kakula is the single most important variable in any DRC copper production model through 2031. The complex, operated by Ivanhoe Mines (39.6% interest) in joint venture with Zijin Mining (39.6%) and the DRC government (20%), holds proven and probable reserves of approximately 43 million tonnes of contained copper, as reported in the Ivanhoe Mines NI 43-101 Technical Report. At a 600,000 tonne annual production rate, that reserve base supports over 70 years of mine life — well beyond any reasonable forecast horizon.
The production ramp timeline:
- Phase 1 (2021-2022): 200,000 tonnes/year nameplate capacity
- Phase 2 (2023-2024): 400,000 tonnes/year combined capacity
- Phase 3 (2025-2026): Smelter commissioning, targeting 500,000 tonnes/year
- Phase 4 (2027+): 600,000+ tonnes/year target, per Ivanhoe Mines 2024 guidance
Kamoa-Kakula’s ore grades average approximately 6.0% copper — roughly 3 to 4 times the global average open-pit copper grade of 0.5-0.6%. This grade premium translates directly into lower processing costs per tonne of metal recovered, which is the primary driver of the project’s competitive AISC position.
By 2027, Kamoa-Kakula alone will represent approximately 17% of projected DRC total copper output under the base case, making it the single largest influence on national production statistics.
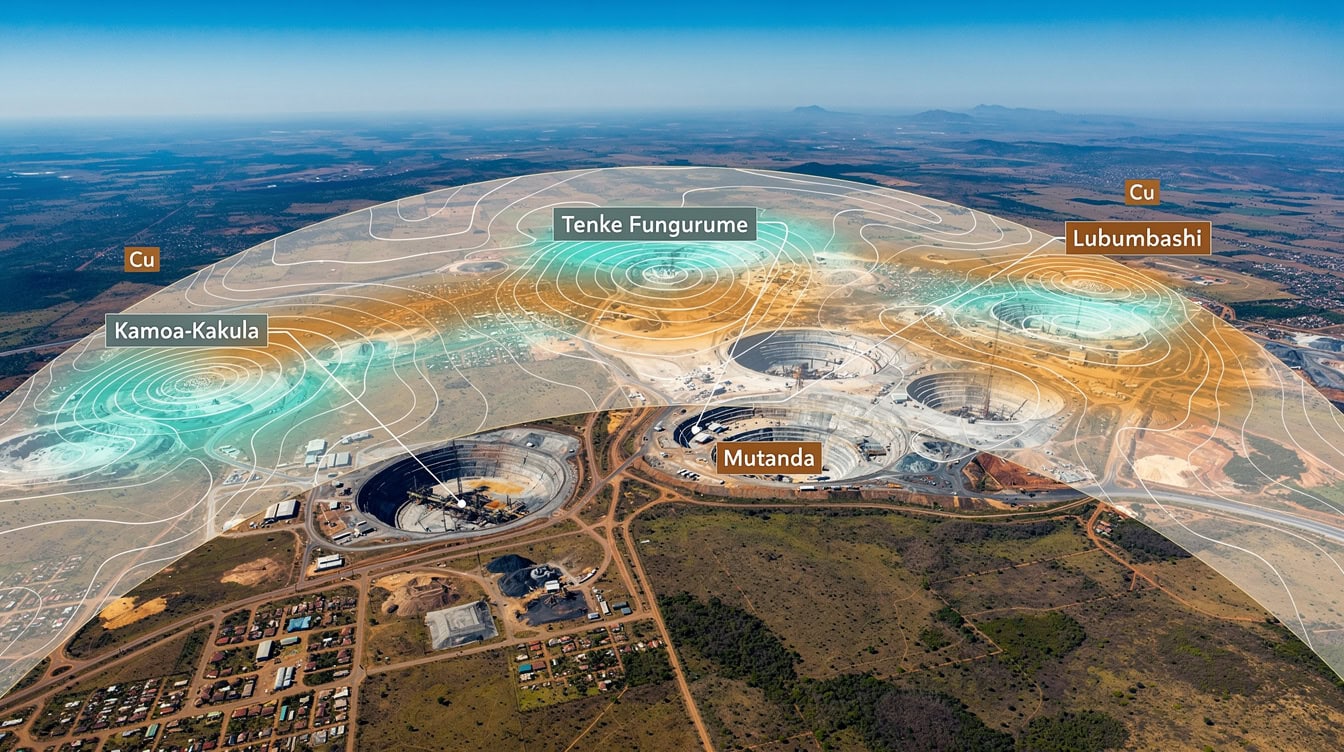
Kamoa-Kakula’s 43M tonne reserve base supports 70+ years at 600,000 t/yr. Phase 4 commissioning in 2027 is the single largest variable in DRC copper production forecasts.
Katanga/Kolwezi Geological Belt: Competitive Advantages and Cluster Economics
The Katanga Copperbelt (also called the Central African Copperbelt) stretches approximately 700 kilometers from southeastern DRC into northwestern Zambia. Its competitive advantages over other global copper jurisdictions are geological, not political.
Key grade and reserve metrics for the Katanga belt:
- Average copper head grade: 2.0-6.0% Cu (versus 0.5-0.6% global open-pit average)
- Average cobalt content: 0.1-0.3% Co as a co-product
- Deposit type: Sediment-hosted stratiform copper (SSC), which supports large, continuous ore bodies amenable to bulk mining methods
- Reserve concentration: The belt hosts an estimated 10% of global copper reserves and over 50% of global cobalt reserves
Cluster economics (the cost savings that arise when multiple mines operate in geographic proximity) are significant in the Kolwezi area. Shared power infrastructure, common road and rail corridors, and a regional skilled labor pool reduce per-unit operating costs for all operators. Glencore’s Mutanda and Katanga operations, China Molybdenum’s Tenke Fungurume, and Ivanhoe’s Kamoa-Kakula all sit within a 200-kilometer radius, enabling shared logistics and contractor markets.
The Katanga belt’s sediment-hosted stratiform copper deposits average 2-6% Cu head grade — up to 10x the global open-pit average — creating a structural cost advantage for all belt operators.
Artisanal and Small-Scale Mining: Employment, Supply Chain Integration, and ESG Materiality
The artisanal and small-scale mining (ASM) sector in the DRC is not a peripheral issue — it is a core financial risk factor for any cobalt supply chain participant. ASM directly employs an estimated 1.5 to 2 million people in the DRC, according to the World Bank’s DRC Growth with Governance in the Mining Sector report. That workforce produces approximately 15-20% of total DRC cobalt output, much of it sold into formal supply chains through négociant (trader) networks.
For institutional investors, ASM creates three categories of financial materiality:
- Traceability liability: The EU Battery Regulation (effective 2024) and US Dodd-Frank Section 1502 require supply chain due diligence. Cobalt sourced from unverified ASM operations creates regulatory and reputational exposure for battery manufacturers and their investors.
- Price discovery distortion: ASM production is highly price-elastic. When cobalt prices spike, ASM output surges, accelerating the price correction. This dynamic compresses the upside scenario for cobalt-leveraged projects.
- Community relations risk: Formal mines operating adjacent to ASM zones face encroachment, illegal mining, and community conflict that can disrupt operations and trigger force majeure events.
The Responsible Minerals Initiative (RMI) and the OECD Due Diligence Guidance for Responsible Supply Chains provide the primary frameworks for ASM risk mitigation. Financial models for DRC cobalt assets should include an explicit ASM risk premium of 50-150 basis points on the discount rate, depending on proximity to known ASM zones.
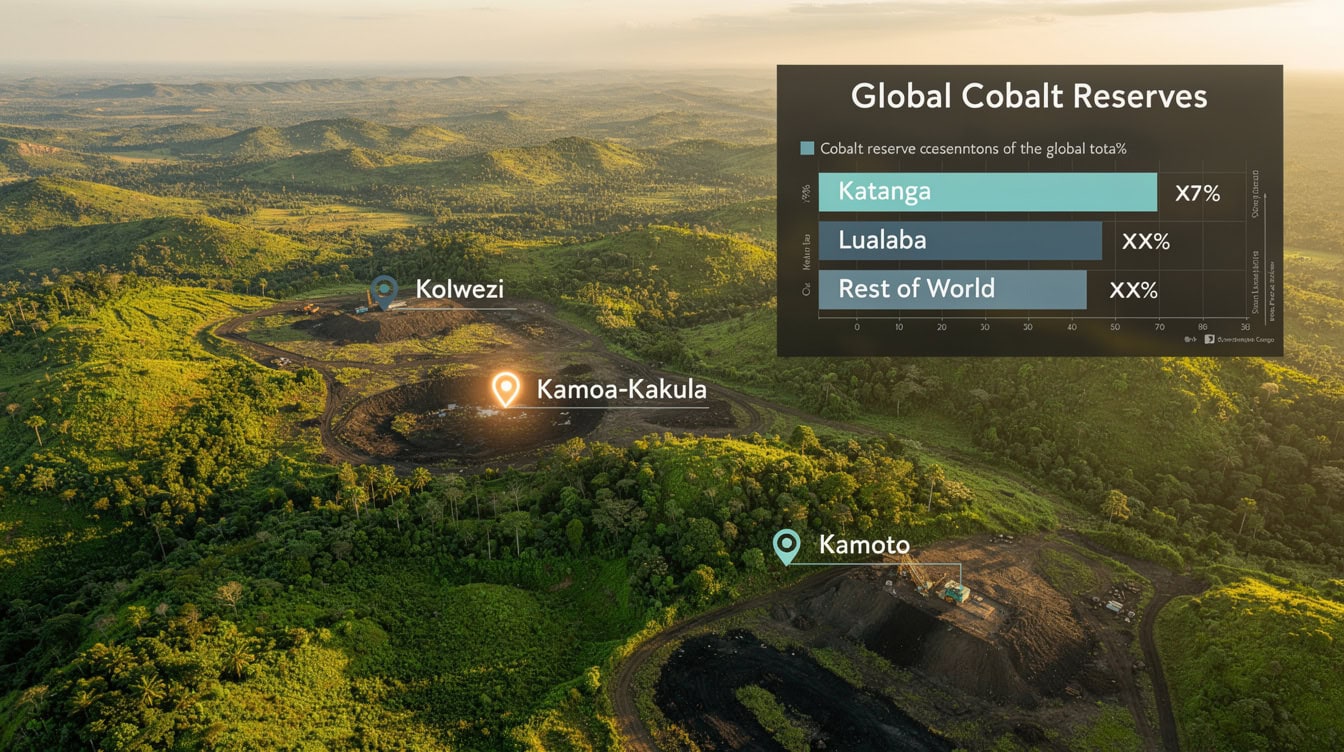
ASM employs 1.5-2M people and produces 15-20% of DRC cobalt. EU Battery Regulation traceability requirements make ASM risk a direct financial liability for cobalt supply chain participants.
Economic Dependence Metrics: Mining’s Contribution to GDP and Export Revenue
The DRC’s economic structure makes it one of the most mining-dependent economies on earth. Mining products represented approximately 95% of total DRC exports in 2022, according to the IMF 2023 Article IV Consultation Staff Report. The mining sector accounts for between 15% and 50% of GDP across the DRC, Zambia, and Zimbabwe, per the Oxford Martin School’s Energy Transitions and Development analysis.
This concentration creates a direct transmission mechanism between commodity prices and sovereign fiscal capacity. A $0.50/lb decline in copper prices reduces DRC export revenues by approximately $1.25 billion annually at current production volumes — equivalent to roughly 3-4% of GDP. For project finance professionals, this means sovereign risk and commodity price risk are not independent variables in DRC models: they are correlated.
Macroeconomic sensitivity implications for financial modeling:
- Royalty and tax regime stability is inversely correlated with commodity price cycles (governments raise rates when prices are high)
- Currency risk is amplified because the Congolese franc tracks commodity export revenues
- Infrastructure investment capacity depends on mining royalty flows, creating a feedback loop between production growth and infrastructure constraint resolution
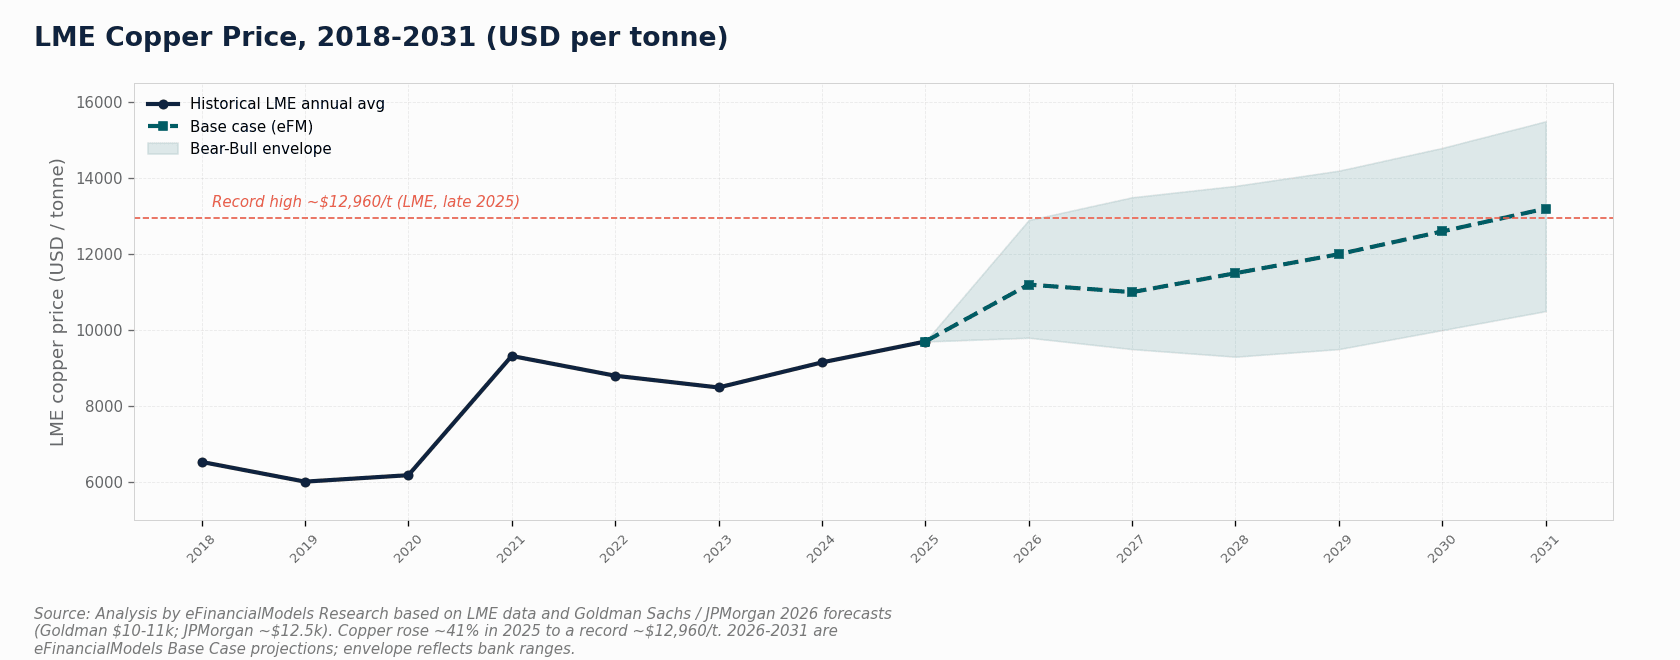
Mining products represent 95% of DRC exports (IMF 2023). A $0.50/lb copper price decline costs approximately $1.25B in annual export revenue — roughly 3-4% of GDP.
2026-2031 Production Forecasts: Scenario Modeling and Key Assumptions
The three-scenario framework below provides the modeling inputs for copper and cobalt production forecasting through 2031. All figures use 2023 actuals as the base year.
| Scenario | CAGR Assumption | 2026E Copper (MT) | 2028E Copper (MT) | 2031E Copper (MT) | Key Driver |
|---|---|---|---|---|---|
| Upside | 7% | 3.06M | 3.50M | 4.29M | Kamoa Phase 4 on schedule, power resolved |
| Base Case | 5% | 2.89M | 3.15M | 3.70M | Kamoa Phase 3 delivers, moderate delays |
| Downside | 2% | 2.65M | 2.76M | 2.93M | Infrastructure/political constraints persist |
| Scenario | CAGR Assumption | 2026E Cobalt (MT) | 2028E Cobalt (MT) | 2031E Cobalt (MT) | Key Driver |
|---|---|---|---|---|---|
| Upside | 4% | 210,000 | 227,000 | 255,000 | ASM growth + formal sector expansion |
| Base Case | 2% | 198,000 | 207,000 | 220,000 | Stable ASM, formal sector ramp |
| Downside | 0% | 187,000 | 187,000 | 187,000 | Price suppression limits ASM activity |
Key modeling assumptions:
- Copper price: $3.80/lb base, $4.50/lb upside, $3.00/lb downside
- Cobalt price: $40,000/MT base, $60,000/MT upside, $25,000/MT downside
- Kamoa-Kakula Phase 4 commissioning: Q3 2027 (base), Q1 2027 (upside), Q4 2028 (downside)
- Power supply: Inga 3 hydroelectric project excluded from base case due to execution uncertainty
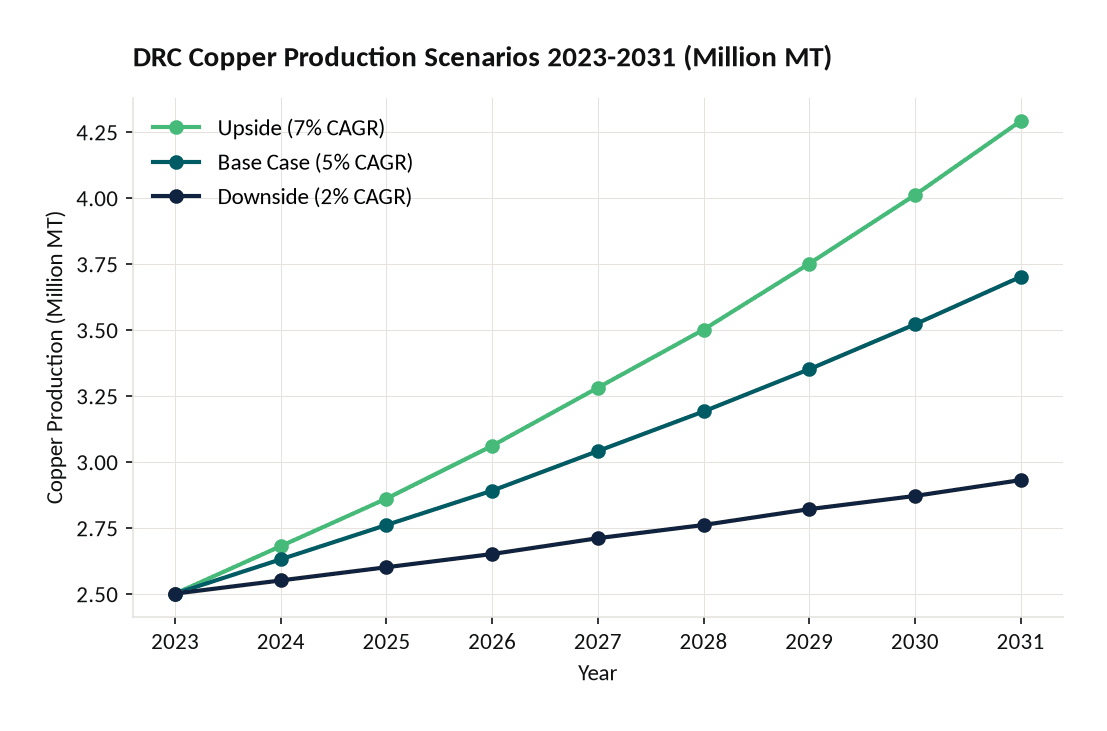
Base case assumes 5% CAGR driven by Kamoa-Kakula Phase 3-4 ramp. Upside requires Lobito Corridor delivery by 2028 and partial Inga 3 power. Downside reflects persistent infrastructure constraints.
Mine Economics and Capital Intensity: CAPEX, AISC, and Breakeven Analysis
Understanding mine economics requires distinguishing between three cost concepts: CAPEX (capital expenditure, the upfront investment to build or expand a mine), AISC (all-in sustaining cost, the total cost per unit of metal produced including sustaining capital), and breakeven price (the metal price at which a project generates zero net present value).
Katanga Belt Representative Economics (copper-cobalt operations):
- CAPEX per tonne of annual copper capacity: $8,000-$15,000 (greenfield), $3,000-$6,000 (brownfield expansion)
- AISC range: $1.50-$2.20/lb copper (net of cobalt by-product credit at $40,000/MT cobalt)
- Breakeven copper price (10% IRR hurdle, 15-year mine life): approximately $2.80-$3.20/lb
- Cobalt by-product credit contribution: $0.30-$0.80/lb copper equivalent, depending on cobalt price assumption
Worked NPV Example: Representative 100,000 tonne/year Katanga Copper Operation
Here’s the math for a simplified NPV calculation on a representative mid-tier Katanga belt copper project:
- Annual copper production: 100,000 MT (220.5M lbs)
- Copper price assumption (base): $3.80/lb
- Cobalt by-product credit: $0.50/lb copper equivalent
- Net realized price: $4.30/lb
- AISC: $1.85/lb
- Operating margin per lb: $4.30 – $1.85 = $2.45/lb
- Annual EBITDA: 220.5M lbs × $2.45 = $540M
- CAPEX (brownfield expansion): $500M
- Mine life: 15 years
- WACC (frontier market mining): 12%
- NPV = -$500M + ($540M × annuity factor at 12% for 15 years)
- Annuity factor = (1 – (1.12)^-15) / 0.12 = 6.811
- NPV = -$500M + ($540M × 6.811) = -$500M + $3,678M = $3,178M
This NPV is highly sensitive to the cobalt by-product credit. Removing the cobalt credit entirely (bear case: $0/lb) reduces annual EBITDA to $430M and NPV to approximately $2,428M — still strongly positive, but 24% lower. This calculation illustrates why copper-cobalt co-product economics must be modeled together, not in isolation.
WACC (Weighted Average Cost of Capital) for DRC mining assets typically ranges from 10% to 15%, reflecting a base rate of 8-10% plus a country risk premium of 2-5% for DRC-specific political and regulatory risk. Analysts should stress-test NPV at WACC rates of 10%, 12%, and 15% to bracket the valuation range.
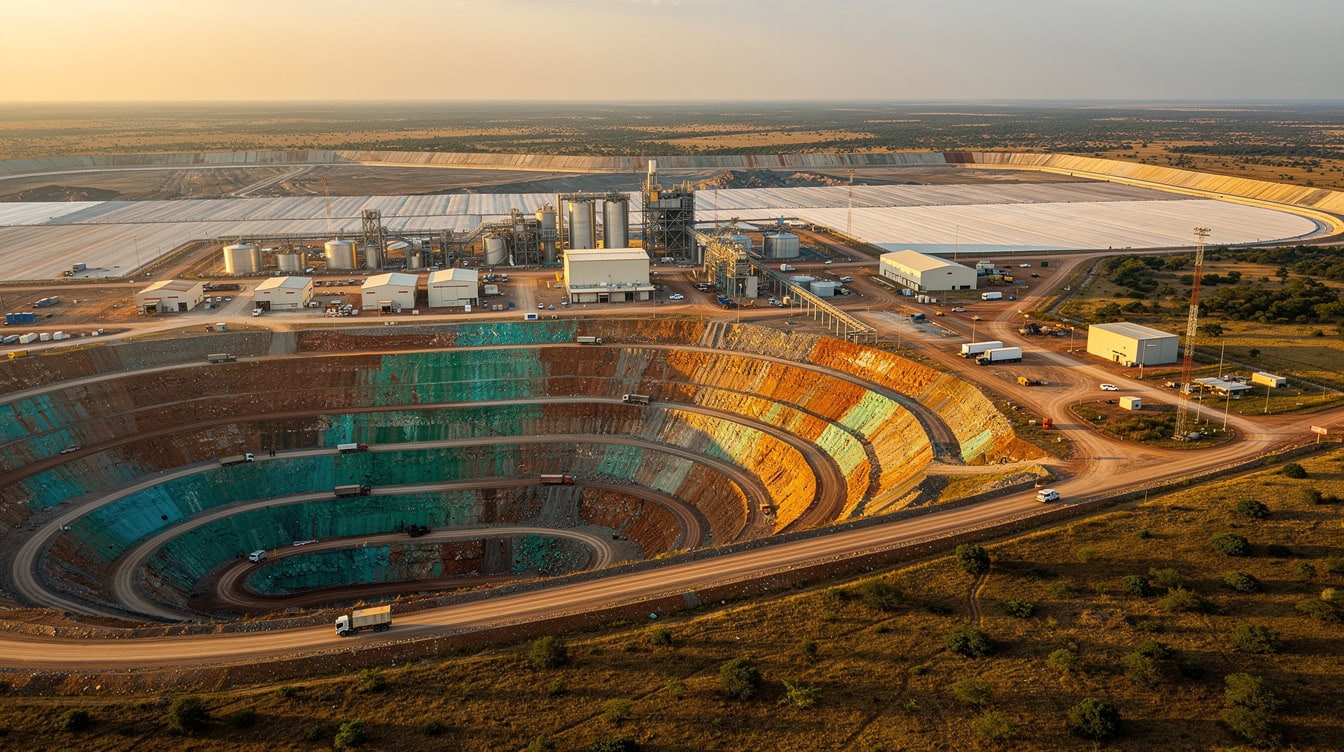
At $3.80/lb copper and $40,000/MT cobalt, a 100,000 t/yr Katanga operation generates $3.18B NPV at 12% WACC. Removing the cobalt credit reduces NPV by 24% to $2.43B.
Infrastructure Constraints and Investment Priorities: Rail, Port, and Power
Infrastructure is the binding constraint on DRC copper-cobalt production growth through 2031. The sector’s geological advantages are well-established; the question for investors is whether logistics and power capacity can scale fast enough to support the production ramp.
Rail and Port Capacity:
The primary export corridor runs from Kolwezi through Zambia to the port of Dar es Salaam (Tanzania) via the TAZARA railway, or south through Zimbabwe to Durban (South Africa). Current rail throughput on the DRC-Zambia corridor is estimated at 3-4 million tonnes per year of copper concentrate equivalent — already near capacity at current production levels. Reaching 3.5-4.0 million MT of copper output by 2031 requires either:
- Rehabilitation and expansion of the Benguela Railway corridor to Lobito, Angola (the Lobito Corridor project, backed by US and EU development finance)
- Significant trucking capacity additions as a bridge solution (higher cost, estimated $150-200/tonne premium versus rail)
The Lobito Corridor rehabilitation, if completed by 2028 as targeted, would add approximately 2-3 million tonnes of annual export capacity and reduce logistics costs by an estimated 30-40% for western Katanga producers.
Power Supply:
The DRC’s hydroelectric potential is enormous — the Congo River basin holds an estimated 100,000 MW of technically exploitable capacity, with the Grand Inga site alone capable of 40,000 MW. Current installed capacity is approximately 2,800 MW, of which roughly 1,500 MW serves the mining sector. The Inga 3 project (4,800 MW planned) has faced repeated delays and financing challenges. For the 2026-2031 forecast window, analysts should assume:
- Base case: No Inga 3 contribution before 2031; mining sector power demand met through a combination of grid supply, captive diesel generation (adding $0.05-0.10/lb to AISC), and small-scale solar/storage
- Upside case: Partial Inga 3 commissioning by 2030, reducing captive generation costs and enabling incremental production expansion
Power constraints add an estimated $0.08-0.15/lb to copper AISC for operations relying on diesel backup, a material cost differential versus Chilean or Peruvian peers with reliable grid access.
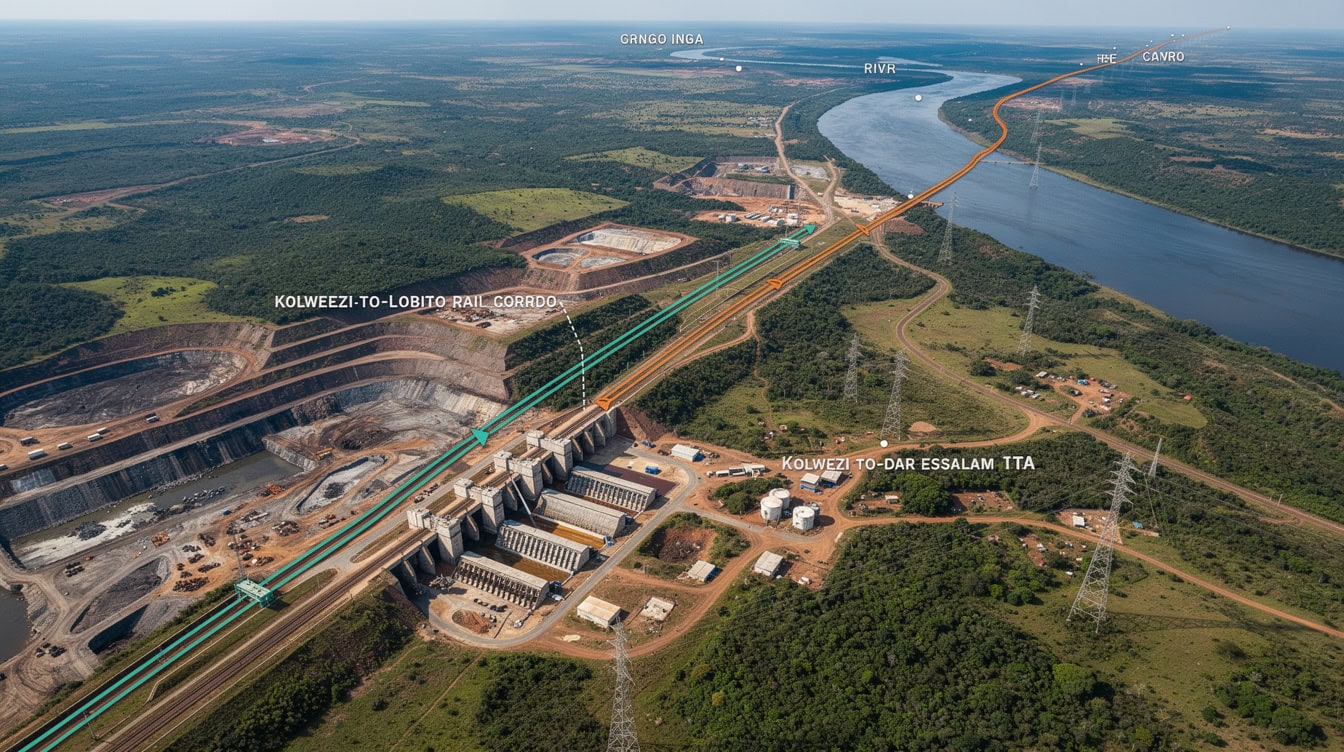
The Lobito Corridor rehabilitation targets 2-3M tonnes of additional annual export capacity by 2028. Current grid power of 2,800 MW is insufficient for a 50%+ production increase without Inga 3.
Frequently Asked Questions
What is the DRC’s current share of global cobalt production, and why does it matter for investors?
The DRC produced 187,000 metric tons of cobalt in 2023, representing approximately 73% of global mined cobalt supply, according to USGS Mineral Commodity Summaries 2024. This concentration matters for investors because it creates a single-country supply risk for battery manufacturers and EV producers. Any production disruption in the DRC — whether from political instability, infrastructure failure, or regulatory change — can move global cobalt prices by 10-20% within weeks. For equity analysts, this means DRC cobalt assets carry both upside leverage to supply disruptions and downside exposure to policy-driven production increases. Portfolio construction should account for this asymmetric risk profile by stress-testing cobalt price assumptions across a $25,000-$60,000/MT range.
How does Kamoa-Kakula’s reserve base affect long-term production modeling beyond 2031?
Kamoa-Kakula holds approximately 43 million tonnes of contained copper in proven and probable reserves, per the Ivanhoe Mines NI 43-101 Technical Report. At a 600,000 tonne annual production rate targeted for 2027, that reserve base supports over 70 years of mine life. For financial models covering 2026-2031, this means terminal value assumptions should reflect a going-concern operation with minimal reserve depletion risk within the forecast window. Analysts should apply a low reserve replacement risk premium — typically 0-50 basis points — compared to 100-200 basis points for operations with less than 20 years of reserve life remaining.
What WACC should I use for DRC copper-cobalt project valuations?
WACC (Weighted Average Cost of Capital) is the blended required return on a project’s debt and equity financing, used as the discount rate in NPV calculations. For DRC mining assets, a WACC of 10-15% is appropriate, built from: a risk-free rate of approximately 4.5% (US 10-year Treasury), an equity risk premium of 5-6%, a country risk premium of 2-5% for DRC-specific political and regulatory risk, and a project-specific beta of 1.2-1.5 for copper-cobalt operations. The lower end of the range (10-11%) applies to large, permitted, producing assets like Kamoa-Kakula. The upper end (13-15%) applies to development-stage or ASM-adjacent projects. Always run sensitivity analysis at WACC +/- 2% to bracket the valuation range.
How does the artisanal mining sector affect formal mine valuations and ESG due diligence?
The ASM sector employs 1.5 to 2 million people in the DRC, per the World Bank, and produces roughly 15-20% of total cobalt output. For formal mine valuations, ASM creates three financial impacts: first, it adds supply-side volatility that compresses cobalt price upside scenarios; second, it creates traceability obligations under the EU Battery Regulation and US Dodd-Frank that require documented supply chain audits (typically costing $50,000-$200,000 per audit cycle for mid-tier operators); and third, proximity to ASM zones increases community relations costs and can trigger operational disruptions. ESG due diligence frameworks should include a site-specific ASM risk assessment, with findings feeding directly into the discount rate and operating cost assumptions in the financial model.
What are the key infrastructure bottlenecks that could delay the 2026-2031 production ramp?
Three infrastructure constraints dominate the risk register for DRC copper-cobalt production growth. Rail and port capacity on the primary export corridors is already near saturation at 2023 production levels; reaching 3.5-4.0 million MT of copper output requires the Lobito Corridor rehabilitation to deliver by 2028. Power supply is the second constraint: current installed capacity of approximately 2,800 MW is insufficient for a 50%+ production increase, and Inga 3 delays mean captive diesel generation will add $0.08-0.15/lb to AISC for affected operations. The third constraint is road infrastructure within the Katanga belt itself, where heavy haul routes require ongoing rehabilitation investment estimated at $200-400 million over the forecast period.
How should I model cobalt as a by-product credit in copper project economics?
Cobalt by-product credit is calculated as: (cobalt production in lbs) × (cobalt price per lb) / (copper production in lbs). For a typical Katanga belt operation producing copper and cobalt at a 10:1 ratio by weight, with cobalt at $40,000/MT ($18.14/lb) and copper at 100,000 MT/year: cobalt production = 10,000 MT/year = 22.05M lbs; copper production = 220.5M lbs; credit per lb copper = (22.05M × $18.14) / 220.5M = $1.81/lb. This credit is substantial — it can represent 30-50% of total revenue for high-cobalt operations. Analysts must apply a payability factor of 85-92% to reflect smelter terms, and should model the credit across the full cobalt price range ($25,000-$60,000/MT) to capture the sensitivity.
What is the breakeven copper price for a representative Katanga belt operation?
Breakeven copper price (at a 10% IRR hurdle) for a representative brownfield Katanga belt copper-cobalt operation is approximately $2.80-$3.20/lb, assuming AISC of $1.85/lb (net of cobalt credit at $40,000/MT cobalt), CAPEX of $500M for 100,000 MT/year capacity, and a 15-year mine life. This compares favorably to the current copper price of approximately $3.80-$4.20/lb, providing a margin of safety of $0.60-$1.40/lb. The breakeven rises to $3.40-$3.80/lb if cobalt prices fall to $25,000/MT, eliminating most of the by-product credit. This sensitivity underscores why copper-cobalt project economics must be modeled with explicit cobalt price scenarios rather than a single point estimate.
Conclusion
The DRC’s copper-cobalt sector offers a rare combination of world-class geology, accelerating production growth, and critical mineral strategic importance — but it demands rigorous financial modeling to separate genuine value from headline risk. The 2026-2031 window is defined by Kamoa-Kakula’s production ramp, infrastructure investment decisions, and commodity price trajectories that will determine whether the base case 3.70 million MT copper output materializes or the downside 2.93 million MT scenario prevails.
For analysts and investors who need investment-grade financial modeling inputs, scenario analysis templates, and mine economics benchmarks for the Katanga/Kolwezi belt, I recommend downloading the DR Congo Copper-Cobalt Mining Market Study 2026-2031. The model includes production forecasts by scenario, AISC benchmarking, NPV/IRR templates calibrated to DRC-specific WACC inputs, and infrastructure constraint sensitivity analysis — everything needed to build a defensible investment case for this market.
























































