Yellow Hydrogen from Solar Energy Financial Model
Deciding whether to invest or not in producing yellow hydrogen from solar energy, one would require this well-prepared and comprehensive financial plan. The Yellow Hydrogen from Solar Energy Financial Model aims to forecast a horizon of 40 years of the financial feasibility and profitability of selling yellow hydrogen and electricity from a solar farm.

Amongst the hydrogen colors, yellow and green hydrogen is considered less environmentally damaging as it is produced with no harmful greenhouse gas emissions. Through water electrolysis, yellow or green hydrogen’s source of electricity is solar energy.
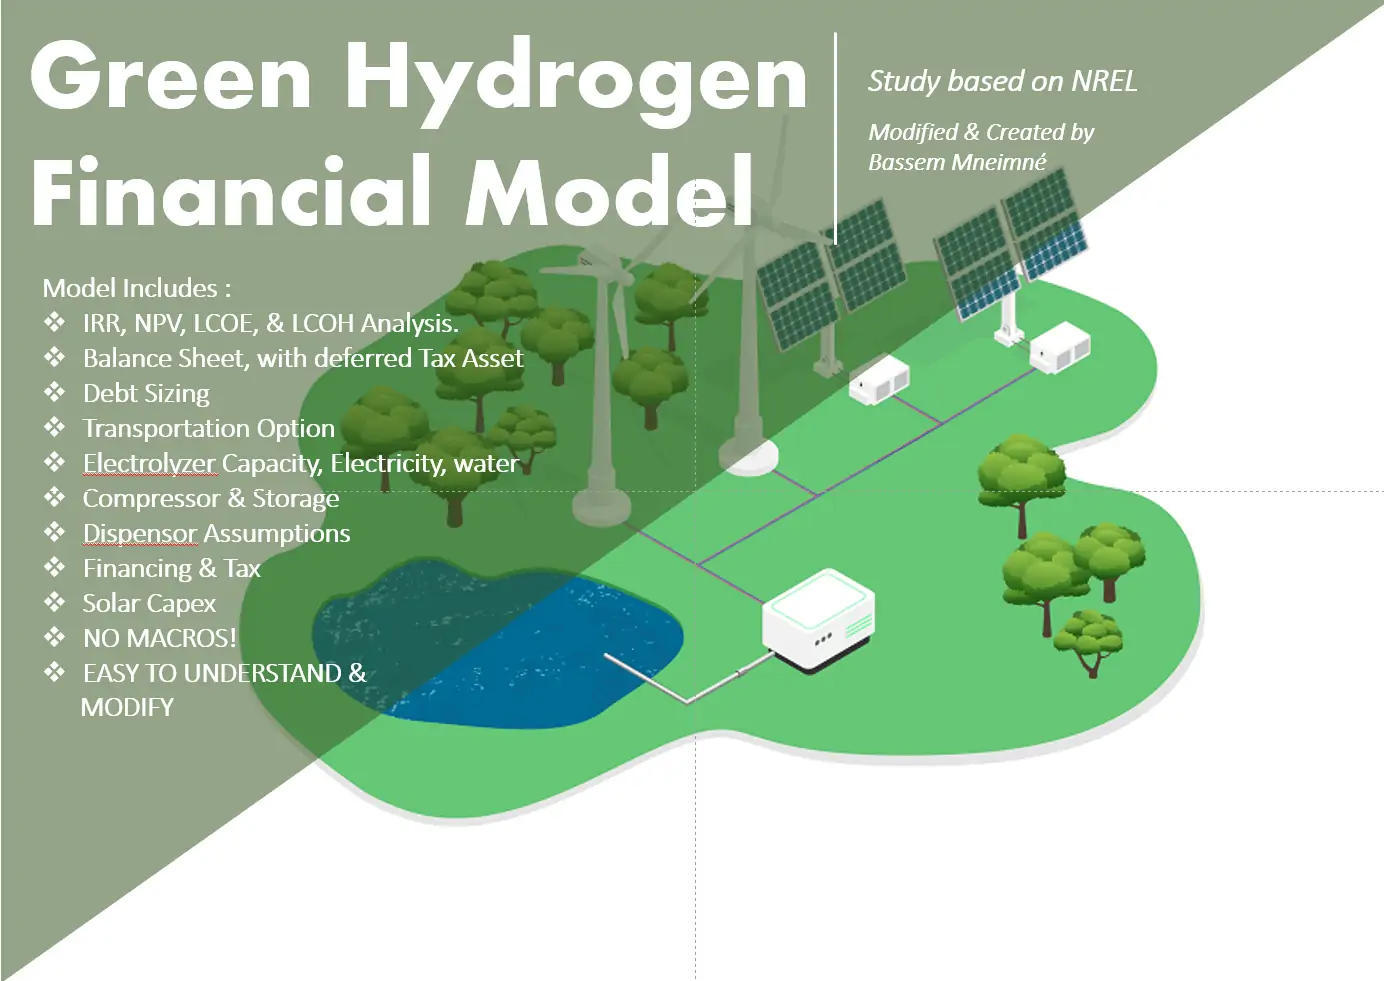
The Yellow Hydrogen from Solar Energy Financial template aims to develop a detailed financial feasibility analysis for a Hydrogen Plant with an adjacent Solar Park from which the required electricity for the production of Hydrogen via hydrolysis can be obtained. The Excel spreadsheet templates include detailed financial forecasts over the project’s lifetime (up to 40 years) based on bottom-up assumptions from the hydrogen plant’s daily design capacity, which will drive the electricity consumption and show the result of the size of the Solar Plant.
Key assumptions include project operations timeline for the solar farm and yellow hydrogen production plant, duration of power purchase agreements, electricity sales, uses and sources of funds, and debt financing. These assumptions are then translated into a financial plan that allows the business owner and management to see how the business should perform from a financial perspective over the following years.
The yellow hydrogen financial plan template also comes with a number of carefully prepared charts and tables to allow for an easy understanding of the feasibility of yellow hydrogen from the solar energy project. Calculations of the relevant financial ratios and financial metrics (such as IRR, Payback Period, NPV, Levelized Cost of Hydrogen,) as well as a debt schedule, are also included.
Why choose this Yellow Hydrogen Financial Model Template?
The main reasons why choose the template are the following ones:
- Financial Feasibility Metrics per Plant– The model calculates the financial feasibility metrics (such as IRR, Payback Period, NPV) for the combined operations (Solar + Hydrogen) and for each plant individually
- Levelized Costs of Electricity and Hydrogen: Calculates Levelized Cost of Hydrogen for the Hydrogen Plant and the Levelized Cost of Electricity for the Solar Park.
- Advanced Tax Models: Both the Hydrogen Plant and the Solar Park can potentially benefit from Tax advantages. The model includes an advanced tax model to consider the effect of a variety of possible tax incentives for such plants.
- Detailed Financial Plans with full transparency on all calculations. The spreadsheet is designed in a logical manner outlining the calculations of revenues and costs in a logical manner which adds to the transparency and understanding of the model.
- Units and Labels Installed capacity for electricity production can be changed between MW and kW, currency can be inputted and changed, and also the label Yellow Hydrogen can be changed to Green Hydrogen. There are many other settings which can be easily adjusted within the model.
Yellow Hydrogen Financial Model Template Structure
This financial model is structured with instructions and formulas that are simple and easy to follow, which allows users to run simulations by varying the input assumptions.
Enumerated below are the components of this financial model template:
Terms contain the cell color codes and the terms and abbreviations used.
Executive Summary and Detailed Summary include charts and graphs to understand better the financial reports and business plan of your Yellow Hydrogen Plant and Solar Farm and to answer significant questions such as:
- Is yellow hydrogen profitable?
- How much does it cost to produce yellow hydrogen from solar energy?
- What should the yellow hydrogen selling price be?
- What is the breakdown of the revenue of the solar farm and yellow hydrogen production plant?
- Are solar farms profitable?
- Which generates a higher profit margin – the yellow hydrogen plant or the solar farm?
These spreadsheets include a 10-year summary of the following:
- Projected Yellow Hydrogen Production from Solar Energy Financial Statements overview – Income Statement, Balance Sheet, and Cash Flows Statement.
- Levered and Unlevered Free Cash Flows calculating key financial feasibility metrics such as the Internal Rate of Return (IRR), Payback Period, Net Present Value (NPV)
- Profitability Ratios and Capital Employed
- Uses & Sources of Funds and Debt Financing
- Lifetime Profit Distribution and Cash Flows
- Investor Summary
- Levelized Cost of Electricity (Solar Farm) and Levelized Cost of Hydrogen (Yellow Hydrogen Production Plant)
- Revenue Breakdown of Yellow Hydrogen Plant and Solar Farm
- Solar Farm and Yellow Hydrogen Plant Capacity Summary
Assumptions that are necessary and applicable in the production of yellow hydrogen from solar energy are presented in this worksheet. Users may test various scenarios and modify easily by updating the marked assumptions in blue or light blue.
- General Settings
- Currency
- Project Details – Name, Location
- Project Timeline – Yellow Hydrogen Production from Solar Energy Operation Years and Plant Lifetime
- Net Working Capital
- Inflation and Price Escalation
- General Tax Assumptions
- Solar Farm Assumptions
- Solar Farm Panel Installed Capacity
- Specific Solar Yield
- Annual Solar Energy Produced
- Photovoltaic (PV) Module Area
- Solar Farm Panels Area
- Electricity Production
- Electricity Sales Allocation
- Electricity Sales Price Assumptions
- Duration of Purchase Power Agreements
- Solar Farm Renewable Energy Certificate
- Advanced Tax Assumptions
- Capital Expenditures, CAPEX Schedule, and Maintenance per year
- Employee Positions and Expenses
- Operating Expenses
- Yellow Hydrogen Plant Assumptions
- Electricity Sources and Consumption
- Duration of Purchase Power Agreements
- Yellow Hydrogen Plant Operating Capacity
- Yellow Hydrogen Price and Other Income Assumptions
- Advanced Tax Assumptions
- Capital Expenditures, CAPEX Schedule, and Maintenance per year
- Direct Costs
- Employee Positions and Expenses
- Operating Expenses
- Uses and Sourced of Funds
- Debt Financing – Loan Terms, Interest Rate, and Repayment Schedule
- Cash Reserve and Net Working Capital
- Debt Financing Schedule
- Repayment Schedule – Calculated or Manual
- Interest – Cash or Accrued
- Investors
- Equity Ownership and Investment Percentages
- Development (Phase 1) and Buy & Hold (Phase 2)
- Dividend Payout Assumptions
Solar Farm and Hydrogen Plant worksheets contain comprehensive calculations of the 40-year operational, financial forecast planning, and feasibility of the Yellow Hydrogen Production from the Solar Energy business.
- Financial Statements – Income Statement, Balance Sheet, Cash Flow Statement
- Financial Ratios and Yellow Hydrogen Plant Economic Analysis
- Unlevered and Levered Free Cash Flows Statement, Funding Required, and Financial Metrics
- Solar Farm’s Electricity Production Allocation and Sales
- Yellow Hydrogen Plant Electricity input and Hydrogen production sales
- Costs to produce Electricity and Yellow Hydrogen
- Fixed Assets Schedule – Initial CAPEX, Spending allocation, Maintenance, and Depreciation
- Debt Schedule
- Simple and Advance Tax Model Summary
- Levelized Costs of Electricity and Hydrogen
Advanced Tax Models worksheets present detailed calculations of the State and Federal Income Taxes of the Solar Farm and Yellow Hydrogen Plant, considering the different tax rates and tax credits.
The Consolidated worksheet contains a comprehensive and consolidated summary of the 40-year forecast for the Solar Farm and Yellow Hydrogen Plant.
- Financial Statements – Income Statement, Balance Sheet, Cash Flow Statement
- Financial Ratios
- Unlevered and Levered Free Cash Flow Forecast
- Financial Metrics, and
- Divided Policy Schedule
Investors’ Cash Flow is prepared to show the calculations of the Equity Multiple and Investors’ IRR, which helps determine if their funding and equity stake percentages during the Buy & Hold and Development Phases would result to profit on their end.
Sensitivity Analysis determines how variables such as prices, expenses, and inflation affect the IRR of a chosen parameter. Users may select Unlevered or Leveled IRRs of the Solar Farm, Yellow Hydrogen Plant, Consolidated, and Investors.
Start producing your own Yellow Hydrogen from Solar Energy now!
The Yellow Hydrogen from Solar Energy Financial Model template comes pre-filled with 40 years forecast. It contains valuable tools that allow users to analyze the financial plan of starting a yellow hydrogen business in detail by testing various scenarios and assessing how it affects the project’s viability.
Developing financial projections can clarify the possible profit margins, the funding required, and the expected returns. This solid and financial model template can be the missing piece to bringing yellow hydrogen production to financial success.
The current model version 3.9, is available in two Excel versions and a PDF Demo Preview:
- Excel Version – Consists of sample figures in the assumptions
- Excel Null Version – No values in the assumption sheet
- PDF Version – Outlines the details of the model structure
File types:
.xlsx (MS Excel)
.pdf (Adobe Acrobat Reader)
Similar Products
Other customers were also interested in...
Green Hydrogen Project Financial Model (Electrolys...
A Project-Level Financial Model to assess the financial feasibility of setting up and operating a Gr... Read more
Blue Hydrogen Production Financial Model
The objective of this financial model is to develop a comprehensive business plan of 40 years foreca... Read more
Green Ammonia from Renewable Energy Financial Mode...
This comprehensive 40-year tool aid investors in evaluating potential risks and returns and assess t... Read more
Green Hydrogen (Electrolysis) Production Financial...
This green hydrogen financial model template builds a multi-year financial plan to analyze the finan... Read more
Green Hydrogen (Simple Electrolysis Financial Mode...
The Model Incorporates data provided by different available sources to Model an Electrolysis financi... Read more
Renewable Energy Template Bundle
This is a collection of selected renewable energy model templates which are set in a bundle which wi... Read more
Solar Energy Financial Model
The Solar Energy Financial Model Excel template forecasts the expected financials for a Solar Park p... Read more
Green Hydrogen Production from Wind Energy Financi...
The Green Hydrogen from Wind Financial Model aims to comprehensively forecast a horizon of 40 years ... Read more
Gasoline and Charging Station Financial Model
Investors can assess the viability of setting up and investing in gasoline stations with a charging ... Read more
Renewable Energy Financial Model Bundle
This is a collection of financial model templates for projects or ventures in the Renewable Energy I... Read more
You must log in to submit a review.


