Radiology Center Financial Model Excel Template
Discover Radiology Center Budget Template. Solid package of print-ready reports: P&L and Cash Flow statement, and a complete set of ratios. Five-year horizon excel pro forma for the radiology center business for early-stage startups to impress investors and raise capital. Radiology Center 3 Way Forecast helps to estimate required startup costs. Unlocked – edit all – last updated in Sep 2020. Generate fully-integrated radiology center p&l projection, cash flow statement, a balance sheet projections for 5 years. Automatic aggregation of annual summaries on the financial summary report.

NOTE: Single-User pertains to a limited Single User License where the template can only be used by one single user; while Multi-User is a license for users sharing the template with up to 20 members. Please refer to Terms of Use and License and Permitted Use for clarification.
RADIOLOGY CENTER PRO FORMA TEMPLATE KEY FEATURES
Video tutorial:
Build your plan and pitch for funding
Impress bankers and investors with a proven, strategic Radiology Center Pro Forma Template Excel that impresses every time.
Track your spending and staying within budget
Have you written a vague idea of cash inflows and cash outflows on the back of a napkin? All is well and good. Looking at the forecasted income statement will give you a snapshot of the past business performance, but it won’t show the future in terms of the Startup Cash Flow Projection. With a cash flow statement forecast, you can plan future cash inflows and cash outflows and compare it to the budget, which can be invaluable information.
Great Value for Money
Use a robust and proven Radiology Center Financial Projection Template Excel based on years of experience at an affordable price. This pro forma template excel has a one-off payment and absolutely no hidden fees or monthly payments.
Generate growth inspiration
By running various scenarios and looking at the effects they could have on your cash balance, you will begin to see which options are best for your business. Ones that are possible, and what is involved in making them work. Organic growth isn’t the only option – there are growing funding options becoming available, and Cash Flow Statement By Month could be a way of looking at the impact an injection of cash could have on your business and its growth plans.
Identify cash gaps and surpluses before they happen.
Forecasting your future cash balance helps you see well in advance when you may have a cash deficit that could hurt your business. Cash Flow Statement Proforma will give you enough time to take action to prevent a crisis. It will enable you to access better loan rates or speed up incoming payment to bridge the gap. On the other side, if you know ahead of time that the large lump of cash will lay in your bank account within the next three months. In this case, you might need to explore options to reinvest it in your business to drive growth.
Save Time and Money
Radiology Center Financial Projection Model allows you to start planning with minimum fuss and maximum of help. No writing formulas, no formatting, no programming, no charting, and no expensive external consultants. Plan the growth of your business instead of fiddling around with expensive techy things.
REPORTS and INPUTS
Operational KPIs
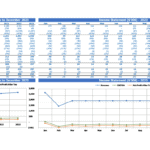
Our Radiology Center Financial Projection Excel has convenient, informative, and easy-to-use operational performance graphs. Here you may visually track your company’s key operational performance indicators (KPIs) in the form of charts. These operational performance graphs show the stakeholders the financial information related to the company’s liquidity, revenues, expenses, cash flows, and other financial metrics. This financial information in the form of graphs will help a business owner to create presentations for banks and investors with minimum effort.
Sources and Uses
This Radiology Center Financial Model Excel Template has a Sources and Uses template. This tab shows users the company’s funding structure and sources and uses of these funds.
Financial KPIs
The Radiology Center Profit Loss Projection has key financial indicators (KPIs) that show sales and profitability performance: revenue growth rate, gross margin, and EBITDA margin.
It also has KPIs related to cash flows and raising investment: the cash burn rate, runway and funding need. You can choose the KPIs relevant to your company and industry, and monitor your company’s performance. For example, SaaS companies typically monitor and manage customer lifetime value (LTV), customer acquisition costs (CAC), LTV/CAC ratio, and the churn rate. For SaaS businesses, these KPIs are crucial.
Financial Statements
Our Radiology Center Excel Pro Forma Template has a pre-built integrated financial summary that contains all the financial information from other spreadsheets, including the primary financial statements: Balance Sheet, Statement of financial position, and cash flow statement proforma. Our specialists have already formatted this financial summary for your pitch deck.
Valuation
This Financial Model In Excel has a valuation report template that will allow users to perform a Discounted Cash Flow valuation with just a few rate inputs in the Cost of Capital.
Break Even
Breakeven Analysis studies the volume of sales or units the company needs to break even to cover its variable and fixed costs. This Radiology Center Excel Financial Model helps companies determine the period when it is supposed to become profitable.
The calculation of the break-even point helps financial specialists in several ways. First of all, it shows the company’s owners if this type of business is worthy of starting up. It also helps the company’s managers determine the price for its products or services that will help cover all company’s costs, both fixed and variable.
Performance KPIs
Sales growth year-to-date. Every entrepreneur wants to see the company grow month-over-month. In some industries, sales depend on the season or other external factors. The sales growth year-to-date metric shows the pace at which the company’s sales revenue increases or decreases.
Users can monitor sales volumes over various periods – daily, weekly, monthly, or yearly. Sales growth metric helps to manage sales growth goals in the form of a percentage of last month’s sales volume or others. If the company has several sales teams, the management can monitor this metric for each team separately. It will help to monitor better each team’s achievements.
File types:
Excel – Single-User: .xlsx
Excel – Multi-User: .xlsx
Free Demo – .xlsx
Similar Products
Other customers were also interested in...
Clinical Lab Financial Model Excel Template
Order Clinical Lab Financial Projection Template. This well-tested, robust, and powerful template is... Read more
Blood Bank Center Financial Model Excel Template
Check Our Blood Bank Center Budget Template. Create fully-integrated financial projection for 5 year... Read more
Gynecology Financial Model Excel Template
Check Gynecology Financial Plan. There's power in Cash Flow Projections and the insight they can pro... Read more
Dialysis Center Financial Model Excel Template
Discover Dialysis Center Financial Projection. Creates 5-year financial projection and financial rat... Read more
Pharma Biotech Valuation Model Template (Risk-Adju...
The Pharma Biotech Valuation Model Template calculates the risk-adjusted DCF Value of a Pharma or Bi... Read more
Pharma Biotech Financial Model incl. Risk-Adjusted...
Financial Model analyzing a Biopharmaceutical Company using a Risk-Adjusted NPV Valuation Methodolog... Read more
BioPharma Business Financial Projection 3 Statemen...
5-year rolling 3 statement financial projection for a biopharma business generating royalty and lice... Read more
Medical Clinic / Healthcare Business Financial Pro...
User-friendly 3 statement 5 year rolling financial projection Excel model for existing/startup healt... Read more
Veterinary Clinic Financial Model – 5 Year Forec...
Financial Model providing an advanced 5-year financial plan for a startup or operating Veterinary Cl... Read more
Medical Practice Financial Model Excel Template
Check Our Medical Practice Financial Projection. Simple-to-use yet very sophisticated planning tool.... Read more
You must log in to submit a review.


