Office Acquisition REFM Financial Model Excel Template
Try Office Acquisition REFM Financial Model. Enhance your pitch decks and impress potential investors with a proven, strategy template. Generates 5-year office acquisition refm cash flow proforma, projected cash flow statement format, financial dashboard, and core metrics in GAAP/IFRS formats automatically. Consider using Office Acquisition REFM Excel Pro Forma Template before buying the office acquisition refm business. Unlocked – edit all. Office Acquisition REFM financial projection allows you to start planning with minimum fuss and maximum of help. No writing formulas, no formatting, no programming, no charting, and no expensive external consultants. Plan the growth of your business instead of fiddling around with expensive techy things.

NOTE: Single-User pertains to a limited Single User License where the template can only be used by one single user; while Multi-User is a license for users sharing the template with up to 20 members. Please refer to Terms of Use and License and Permitted Use for clarification.
OFFICE ACQUISITION REFM FINANCIAL PROJECTION MODEL EXCEL KEY FEATURES
Video tutorial:
Get a robust, powerful financial model which is fully expandable
This well-tested, robust and powerful Office Acquisition REFM Pro Forma Template is your solid foundation to plan office acquisition refm business model. Advanced users are free to expand and tailor all sheets as desired, to handle specific requirements or to get into greater detail.
Update anytime
You can easily adjust inputs at the launch stage and throughout the further activities of your business to refine your Office Acquisition REFM Financial Projection.
Avoid cash flow problems.
Cash flow, and especially Pro Forma Cash Flow Projection from operations, is the lifeblood of your business – do not ignore it! The level of cash flow in your company dictates the decisions you can make and how quickly you can grow your business. So you should monitor and manage cash flow regularly. Monthly cash flow forecasting will give you a current view of the cash inflows and outflows within your business and also what the next period looks like. Regular Startup Cash Flow Statement forecasting can highlight where cash gaps will be in the future and where there could be improvements made. Most importantly, a Cash Flow Pro Forma will give you a good idea of the health of your business cash flow at a glance. Finding potential cash flow gaps ahead of time can save you and your business both time and money. You can make decisions and take action before things get too bad, ensuring your Cash Flow Projection is maintained, based on your forecasts.
Saves you time
Allows you to spend less time on Cash Flow Projection and more time on your products, customers, and business development
It is part of the report set you need.
It doesn’t matter whether you are worried about cash or not, setting up, and managing an Office Acquisition REFM Financial Projection Excel should be a cornerstone of your reporting set. It’s the main report of your business that must have in place to grow sustainably. Before you rush to rent more office space or make a new hire, you should always run a Cash Flow Forecast scenario. You can model how that action would impact your cash balance in the nearest future. Knowing whether or not plans are possible is crucial to minimizing risk.
Spot problems with customer payments
Preparing the Cash Flow Statement For 5 Years encourages the business to look at how quickly customers are paying their debts. Identify unpaid invoices and take necessary actions to make them pay.
REPORTS and INPUTS
Break-Even
Break-Even Analysis integrated into this Office Acquisition REFM Financial Projection Template Excel shows the sales volume or amount of units sold required to break even after all costs, including fixed and variable expenses related to the business operations.
The excel break-even formula calculation is a critical business and financial planning tool because financial assumptions involved in these calculations determine the company’s ability to bring profits.
Burn and Runway
The cash burn rate is one of the tabs your future investors may be very interested in. This metric shows the time left to a complete cash burn. Also, this template shows a cash burn ratio. The calculation is based on your average annual cash balance and average monthly operating cash outflows.
Dashboard
Our Financial Projection Model Template has an all-in-one dashboard. This dashboard is a useful financial planning tool that helps financial professionals create fast, reliable, and transparent financial reports for the management and other company stakeholders.
With this financial dashboard’s help, users can assess the company’s financial data, drill into financial details, or validate figures fast and easily. Our specialists understand that the company’s financial management, especially the start-up’s management, is under pressure to deliver fast decisions and results. This all-in-one financial dashboard is an effective financial tool that will help with these tasks.
With this dashboard, you will get data at your fingertips. You will be able to perform financial analysis, and assess key performance indicators (KPIs), and other financial information you may need to generate actionable insights and make wise financial decisions.
Benchmarks
A benchmarking study as the element of the Pro Forma Template Excel is usually used to evaluate a business’s performance by focusing on one or more particular indicators and comparing them with similar indicators of other companies in the industry.
In respect of the financial benchmarking study, these indicators could be profit margins, cost margins, cost per unit, productivity margins, or others. Later the company’s performance indicators should be compared to that of other companies within the same industry.
Benchmarking is a useful strategic management tool, which is essential for start-ups. Companies can evaluate any economic, business, or financial metric or process and compare them to the processes of ‘best practice’ companies within the same field or industry.
Operational KPIs
Our Office Acquisition REFM Financial Projection Excel has various operational performance graphs that will help business owners manage their business finances and measure their overall performance. These operational performance graphs also help in making wise business decisions that consider the company’s financial capability.
The financial graphs in this Office Acquisition REFM Pro Forma Template Excel help measure the company’s financial health by showing the operating cash flows’ analysis, return on investment, debt to equity ratio, liquidity ratios, and other relevant financial information. Business owners can use these operational performance graphs both for internal and external purposes.
In particular, they can use these graphs to assess the company’s overall financial performance or for the assessment of the project’s financial feasibility. Such an approach will improve the financial management efficiency of the company. Business owners can also use these charts and graphs for presentations for potential investors and bankers. The operational performance graphs have all the necessary pre-built formulas, and they are fully formatted. So, the users can just print out them and bring them for the meeting with investors.
Financial Statements
The Office Acquisition REFM 3 Way Forecast has pre-built proformas for the balance sheet, the p&l projection, and the statement of cash flows. These proformas allow users to create statements both on a monthly and annual basis.
Users can create detailed financial statements using the financial assumptions inputted in the Pro Forma Projection.
Profitability KPIs
Net present value (NPV). Present value (PV) is a financial metric that reflects discounted cash flows and addresses the type of questions like ‘What is the value today of a $1 to be received several years from now?’. The sum of such present values for a multi-period cash inflow stream is called Net present value or NPV.
File types:
Excel – Single-User: .xlsx
Excel – Multi-User: .xlsx
Free Demo – .xlsx
Similar Products
Other customers were also interested in...
Office Development REFM Financial Model Excel Temp...
Get Office Development REFM Pro-forma Template. Impress bankers and investors with a proven, strateg... Read more
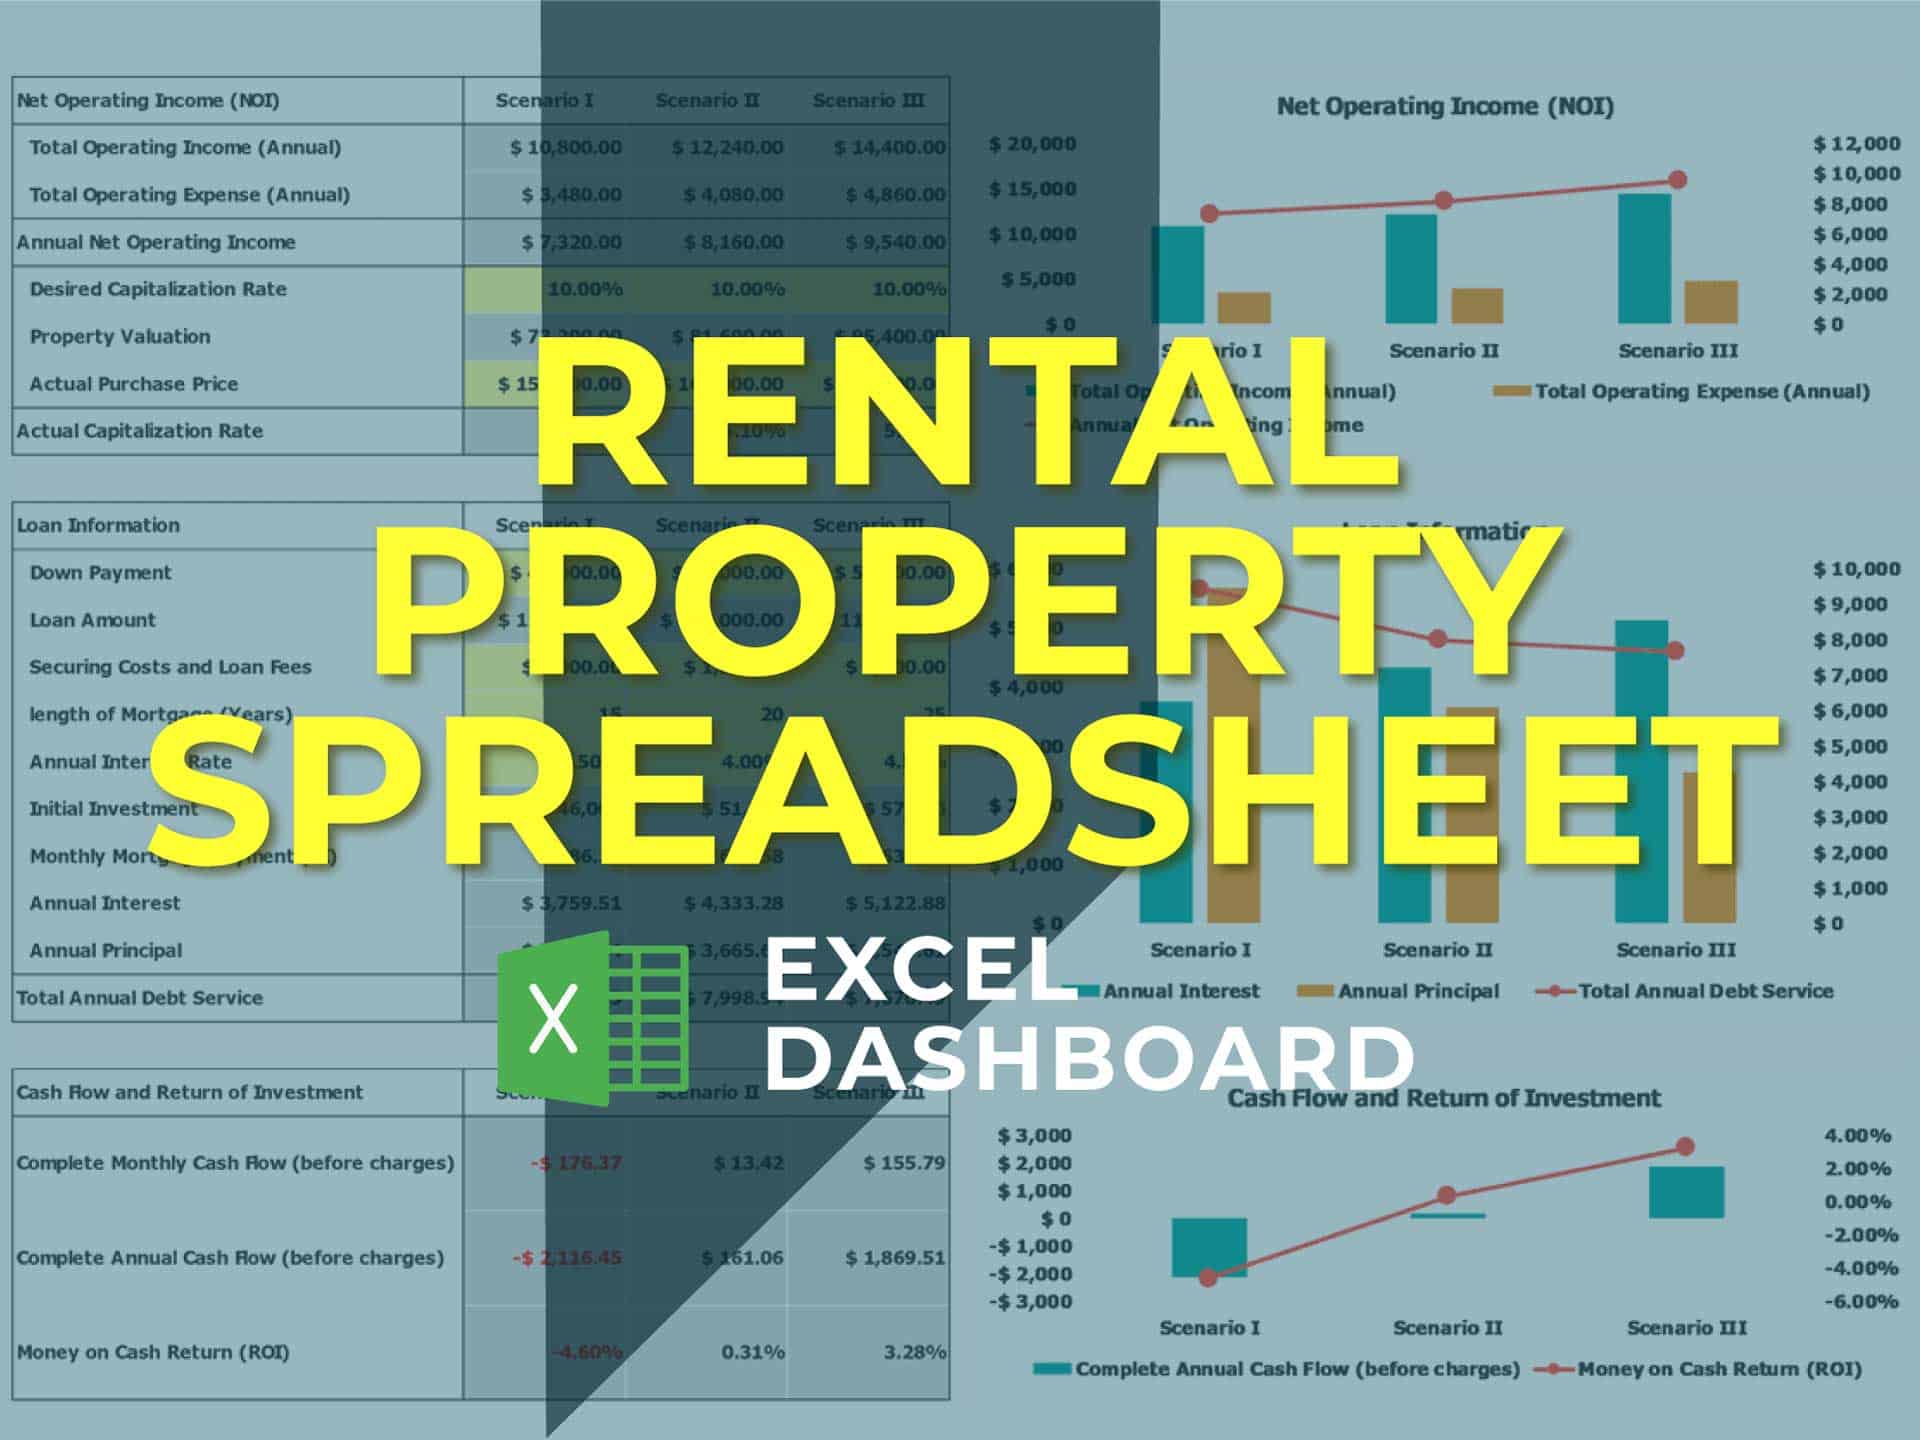
Rental Property Spreadsheet Template
Here you'll find a simple Rental Property Spreadsheet Template to help you better analyze your poten... Read more
Mixed-Use Real Estate Model: Leverage / JV Options
A general real estate model to plan all assumptions for up to 7 'uses' for a given property. Include... Read more
Commercial Real Estate – Lease or Sell Quart...
Commercial Real Estate - Lease or Sell Quarterly Excel Model with 3 Statements, Valuation, and Devel... Read more
Office Building Development Financial Model (Const...
Financial model presenting a development scenario for an Office Building including construction, ope... Read more
Real Estate Acquisition Financial Model (Commercia...
Simple Real Estate Acquisition Financial Model suitable for Commercial, Industrial and Residential P... Read more
Real Estate Financial Model Bundle
This is a collection of financial model templates that provides the financial projections and valuat... Read more
Office Building Acquisition Financial Model
Financial model presenting an investment scenario of an Office Building, from the acquisition of the... Read more
Coworking Business Financial Projection 3 Statemen...
5-year 3-statement excel model for preparation of a financial projection for new or existing busines... Read more
Coworking Financial Model Excel Template (Fully-Ve...
The UPtick Coworking Template is a simple yet robust financial model that allows you to make intelli... Read more
You must log in to submit a review.


