
0 ITEMS

Liquidity Ratios Excel Template Calculator
Financial Liquidity Ratios Calculator – Get Free Excel Template

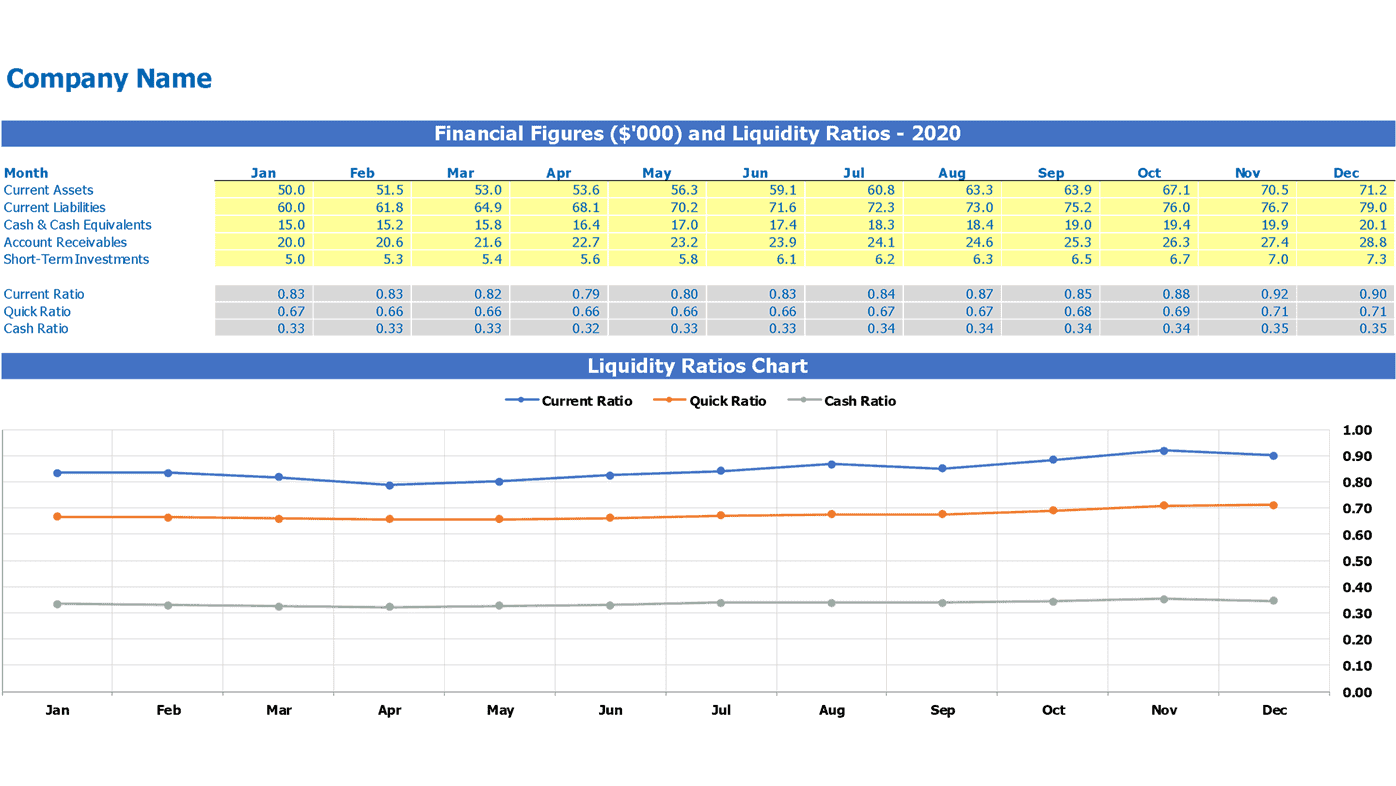
The financial liquidity ratios calculator helps users to obtain all the main financial liquidity indicators for further analysis. There are four measures of the liquidity of business – working capital, current ratio, quick ratio, and cash ratio.
Users should only provide the input data, and the calculator will give the results. Further, users will be able to get a percent of changes in these four financial liquidity metrics.
The working capital liquidity ratio measures both company’s short-term financial health and its efficiency. It shows if the business has a sufficient amount of short-term assets to meet its current obligations. The working capital formula includes the subtraction of the current liabilities from current assets of the company.
Financial experts say that the ideal working capital ratio should be between 1.2 and 2. The quick ratio is the liquidity figure that compares the company’s cash and cash equivalents with its short-term liabilities, including debts and other obligations. This liquidity ratio indicates the company’s financial capacity to pay out its current obligations.
Financial specialists state that the ideal value of the quick ratio is 1. It indicates that the company can fully pay its current liabilities using its cash. If the quick ratio value is below 1, it may indicate that the company does not have enough cash to pay its current debts. A value of the quick ratio greater than 1 may show that the company has liquid assets more than it needs, and it can use them more efficiently. The current ratio liquidity indicator helps users assess the company’s liquidity by dividing its current assets’ value by its current liabilities.
This liquidity ratio shows whether the company can cover its current debts with current liabilities. The company should have a relatively big current ratio to remain stable. However, the too high current ratio may indicate the inefficient financial management of the company. Cash ratio is a financial liquidity metric that measures a company’s cash and cash equivalents against current liabilities. This financial liquidity ratio shows the percentage of the company’s most liquid assets comparing to the current debts.
A cash ratio value greater than 1 indicates that the company is stable enough to pay its short-term debts using its liquid assets. Simultaneously, a high cash ratio is a sign that the company has an inefficient management policy, and the part of its current assets should be invested or used more efficiently.
This model template comes in .xlsx file type which can be opened using MS Excel.
Similar ProductsOther customers were also interested in...


 HenrySheykin
Online Clothing Store Financial Model Excel Templa...
The Online Clothing Store Financial Model helps founders, entrepreneurs, business owners, consultant... Read more

Monthly Recurring Revenue SaaS Financial Model Exc...
The SaaS Business Financial Model helps founders, entrepreneurs, consultants, analysts, and business... Read more

SaaS Freemium Financial Model Excel Template
The SaaS Business Financial Model helps founders, entrepreneurs, consultants, analysts, and business... Read more

SaaS Actuals Opt-In Financial Model Excel Template
The SaaS Business Financial Model helps founders, entrepreneurs, consultants, analysts, and business... Read more
SaaS Application Freetrial Financial Model Excel T...
The SaaS Business Financial Model helps founders, entrepreneurs, consultants, analysts, and business... Read more

Medical Tourism Financial Model Excel Template
The Medical Tourism Financial Model Template helps users turn a cross-border healthcare business ide... Read more
Call Center Financial Model Excel Template
The Call Center Financial Model helps users build a structured financial forecast for launching, man... Read more

Online Services Marketplace Financial Model Excel ...
The Online Services Marketplace Financial Model helps founders, entrepreneurs, consultants, analysts... Read more

Fashion Marketplace Financial Model Excel Template
The Fashion Retail Financial Model helps entrepreneurs, founders, business owners, consultants, and ... Read more

Cyber Security Financial Model Excel Template
The Cybersecurity Financial Model helps founders, business owners, consultants, and analysts plan a ... Read more
You must log in to submit a review.