
0 ITEMS

Go Kart Business Plan Financial Model Excel Template
The Go-Kart Rental Financial Model Financial Model Template helps entrepreneurs, founders, business owners, consultants, and analysts build a structured financial forecast for a recreational karting business without starting from a blank spreadsheet. It is designed to turn key assumptions such as race volume, package pricing, private event demand, ancillary sales, staffing, startup costs, and operating expenses into a practical five-year view of revenue, cash flow, profitability, and funding needs. Whether you are planning an indoor karting facility, an outdoor track, an entertainment venue expansion, or a new go-kart rental concept, the template provides a clear framework for evaluating whether the business can support its investment requirements and growth goals. This financial model is especially useful for business planning, investor discussions, loan applications, and internal decision-making. Go-kart rental businesses often require significant upfront capital for track construction, leasehold improvements, electric or gas kart fleets, safety equipment, timing systems, insurance, and facility setup. The template helps organize these startup costs alongside monthly operating expenses, payroll, marketing, maintenance, utilities, rent, and other recurring costs. By connecting these assumptions to projected revenue streams, users can better understand how visitor volume, pricing, utilization, and event bookings influence cash flow and profitability over time. The model is built to support realistic planning rather than guesswork. Users can update assumptions, test different scenarios, review revenue assumptions, analyze cost behavior, and assess how quickly the business may move from launch losses to sustainable profitability. It helps highlight funding gaps, working capital needs, break-even timing, and the relationship between fixed costs and sales volume. This makes it easier to prepare investor-ready financial outputs, communicate the business case to stakeholders, and make more informed decisions before committing capital. Instead of hiring a consultant to build a custom model from scratch, buyers receive a ready-to-use and editable template that can be adapted to their own location, pricing strategy, operating model, and growth expectations. The Go-Kart Rental Financial Model Financial Model Template provides a professional structure for forecasting, budgeting, scenario planning, and performance review, helping users evaluate the financial viability of a go-kart rental business with greater confidence.
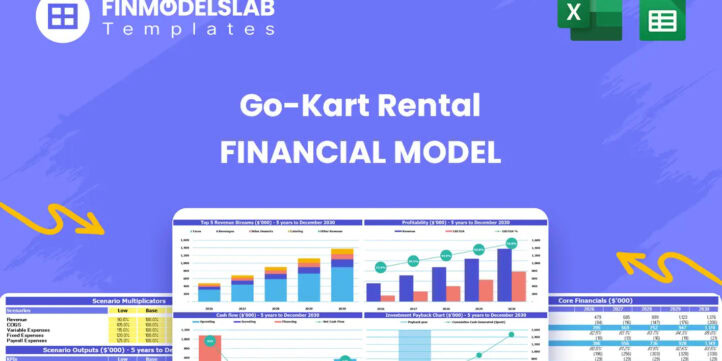


Financial Model Overview
The Go-Kart Rental Financial Model Financial Model Template is a ready-to-use planning tool built for entrepreneurs, operators, consultants, analysts, and founders who need to evaluate the financial potential of a go-kart rental business. A karting facility is a capital-intensive venture with multiple moving parts, including track construction, kart fleet investment, staffing, safety systems, maintenance, marketing, insurance, customer volume, race pricing, private events, and ancillary sales. This template brings those assumptions into one structured model so users can forecast revenue, operating expenses, startup investment, cash flow, profitability, and funding requirements over a multi-year period. It is designed to support business planning, funding preparation, lender discussions, investor presentations, expansion decisions, and day-to-day financial decision-making. Instead of building a model from scratch, users can begin with an editable framework tailored to the economics of a go-kart rental operation and adjust the assumptions to reflect their own market, facility size, pricing strategy, operating hours, growth plan, and cost structure.
All-in-One Dashboard
The all-in-one dashboard gives users a central view of the most important inputs and outputs in the Go-Kart Rental Financial Model. It is designed to summarize the business plan in a format that is easy to review, update, and present, bringing together revenue assumptions, expense assumptions, cash flow movement, profitability metrics, investment requirements, and key performance indicators. For a go-kart rental business, this is especially useful because operators need to understand how many races, packages, private events, and ancillary purchases are required to cover fixed costs and generate profit. The dashboard helps users see the connection between assumptions and results without needing to search through every worksheet in the model. Inputs may include pricing, customer volume, utilization, staffing levels, operating expenses, startup costs, and financing assumptions, while outputs may include projected revenue, EBITDA, net profit, cash balance, payback period, and investor return metrics. This section is useful for founders preparing pitch materials, owners reviewing monthly planning assumptions, and consultants who need a clean executive summary for clients or stakeholders.
Low, Base, and High Scenario Analysis
The low, base, and high scenario analysis component helps users compare different versions of the go-kart rental forecast under changing business conditions. A recreational karting facility can be affected by visitor demand, local competition, seasonality, event bookings, pricing sensitivity, marketing effectiveness, maintenance costs, and staffing needs, so planning around only one outcome can create unnecessary risk. This component allows users to test a conservative case, a realistic base case, and an upside case by adjusting assumptions such as race volume, package sales, private event bookings, average ticket price, ancillary spend, payroll, rent, utilities, and marketing expenses. The outputs show how each scenario affects revenue, cash flow, profitability, funding needs, break-even timing, and investor returns. This is valuable for decision-making because it helps users understand the downside risk before committing capital, while also showing the potential upside if the facility achieves strong attendance and high utilization. For investor or lender conversations, scenario analysis demonstrates that the business plan has been stress-tested and that management understands the key drivers behind the forecast.
Professional Charts
The professional charts component transforms the financial forecast into clear visual outputs that can be used in presentations, business plans, loan packages, and internal reviews. Go-kart rental businesses often involve a large amount of financial detail, including multiple revenue streams, heavy startup investment, monthly operating expenses, fleet maintenance, staffing costs, and cash flow fluctuations. Charts make this information easier to communicate by showing trends in revenue growth, expense levels, EBITDA, net income, cash balance, cumulative cash flow, and other financial metrics over time. Users can use these visuals to explain how the facility moves from startup investment to operating performance, where the main cost pressures exist, and how revenue growth supports profitability. The component may draw from inputs such as customer volume, race pricing, event sales, payroll, operating expenses, and capital expenditures, then convert the outputs into presentation-ready graphs. This is useful for founders pitching investors, operators presenting to partners, consultants preparing client deliverables, and owners who want a faster way to interpret the model’s results.
ROE Components and DuPont Analysis
The ROE components section uses DuPont-style analysis to help users understand what drives return on equity in the go-kart rental business. Instead of looking only at a single return percentage, this component breaks performance into underlying financial drivers such as profitability, asset efficiency, and leverage. For a karting facility, this is important because the business may require major physical assets, including a track, karts, timing systems, safety equipment, leasehold improvements, and facility infrastructure. The return profile depends not only on revenue and margin, but also on how efficiently those assets generate sales and how the business is financed. Inputs may include net income, revenue, total assets, equity, debt, interest expense, and projected balance sheet values, while outputs may show return on equity, margin contribution, asset turnover, and financial leverage effects. This component is useful for investor discussions because it explains why returns rise or fall over time and whether performance is being driven by operating improvements, better asset utilization, or financing structure. It also helps business owners identify whether they should focus on increasing margins, improving facility utilization, reducing idle capacity, or optimizing capital structure.
Revenue Inputs
The revenue inputs component gives users a structured place to define the core commercial assumptions behind the go-kart rental forecast. For this type of business, revenue is typically generated through several related streams, including individual races, race packages, private events, corporate bookings, birthday parties, food and beverage, merchandise, memberships, arcade games, and other add-on purchases. The model allows users to enter assumptions such as number of visitors, number of races sold, average price per race, package volume, package price, private event count, event pricing, ancillary spend per customer, and expected growth over time. These inputs feed directly into the revenue forecast, profitability analysis, cash flow forecast, and scenario planning sections. This component is useful because it helps users move beyond broad revenue estimates and build a forecast based on operating drivers that can be researched, tested, and monitored. A founder can use it to estimate market potential, an existing operator can use it to evaluate expansion, and a consultant can use it to document the assumptions behind a business plan or funding request.
Bank-Ready Reports
The bank-ready reports component organizes the financial outputs into a format suitable for lenders, investors, partners, and other stakeholders who need to review the business from a funding perspective. A go-kart rental facility may require significant financing for track construction, facility improvements, kart purchases, deposits, equipment, insurance, launch marketing, and working capital, so clear financial reporting is essential. This component may include lender-friendly summaries of the income statement, cash flow statement, balance sheet, debt assumptions, financing needs, debt service capacity, profitability, and projected cash balances. Inputs such as startup costs, loan amounts, repayment terms, interest rates, revenue assumptions, and operating expenses are translated into outputs that help demonstrate whether the business can support its financing plan. This section is useful for loan applications because it presents key information in a structured and professional manner, making it easier for a bank or funding partner to assess repayment ability, operating risk, and capital requirements. It also helps founders prepare for financial due diligence by ensuring that assumptions, projections, and outputs are connected and easy to explain.
Revenue Breakdown
The revenue breakdown component provides a detailed view of how total sales are generated across the go-kart rental business. Rather than showing one general revenue line, this section separates income streams so users can see the contribution from individual races, bundled packages, private events, group bookings, food and beverage, merchandise, arcade or entertainment add-ons, memberships, and other potential sources. This is important because each revenue stream may have a different price point, margin, growth pattern, and operational requirement. Individual races may create steady customer traffic, packages may increase average transaction value, private events may provide higher-margin bookings, and ancillary sales may improve profitability without requiring major additional capacity. Inputs may include sales volume, average pricing, customer mix, event frequency, utilization rates, and annual growth assumptions, while outputs show revenue by category, share of total sales, and changes over the forecast period. This component supports decision-making by helping users identify which streams deserve more marketing focus, which pricing assumptions have the greatest impact, and how a diversified revenue model can strengthen the overall financial plan.
KPI Dashboard
The KPI dashboard component tracks performance metrics and benchmarks that are especially relevant to a go-kart rental business. Financial statements show the final results, but key performance indicators help explain why those results are happening. This component may include metrics such as revenue per visitor, average spend per customer, number of races sold, package conversion, event revenue, facility utilization, EBITDA margin, labor cost as a percentage of revenue, marketing spend efficiency, cash balance, payback period, return on equity, and break-even progress. Users can compare projected performance against internal targets or industry benchmarks to determine whether their assumptions are realistic and whether the business is moving toward sustainable profitability. Inputs come from revenue, cost, staffing, and balance sheet assumptions, while outputs provide a concise performance view that can be used in monthly reviews, investor updates, lender conversations, and management planning. For operators, the KPI dashboard is useful because it highlights the operational levers that matter most, such as increasing track utilization, improving event bookings, controlling labor costs, and growing high-margin ancillary sales.
Startup Cost Breakdown
The startup cost breakdown component helps users estimate the initial investment required to launch or expand a go-kart rental facility. This is one of the most important parts of the model because karting businesses often need substantial upfront capital before they can begin generating revenue. The section may include track construction, leasehold improvements, electric or gas kart fleet purchase, charging infrastructure or fuel systems, safety barriers, helmets and protective gear, timing and scoring systems, point-of-sale equipment, signage, deposits, licenses, permits, insurance, initial inventory, furniture, technology, professional fees, pre-opening payroll, launch marketing, and working capital reserves. Users can adjust each cost category to match their location, facility size, indoor or outdoor format, kart type, and supplier quotes. The output helps determine total funding required before opening, the amount of owner equity or investor capital needed, and whether additional debt financing may be necessary. This component is useful for business planning and funding preparation because it prevents underestimating launch costs, supports more accurate capital raise targets, and gives investors or lenders a transparent view of how the requested funds will be used.
Break-Even Analysis
The break-even analysis component helps users understand when the go-kart rental business may generate enough revenue to cover its fixed and variable costs. This is especially important for a facility with high startup investment and recurring fixed expenses such as rent, payroll, insurance, utilities, maintenance, software, marketing, and administrative costs. The analysis may use inputs such as average ticket price, race volume, package revenue, event revenue, contribution margin, variable costs, payroll, occupancy costs, and other operating expenses to estimate the sales level required to reach profitability. Outputs may include break-even month, break-even revenue, required customer volume, required number of races, and the relationship between pricing, utilization, and cost coverage. This component is useful for evaluating whether the business can realistically reach profitability within an acceptable timeframe and how much cash may be needed before operations become self-sustaining. It also helps users test strategies for reaching break-even faster, such as increasing private event bookings, improving package conversion, raising average spend per visitor, managing staffing schedules, or reducing unnecessary fixed costs. For investors and lenders, a clear break-even analysis strengthens the business case by showing the path from launch to financial stability.
File types:
Excel – Single-User: .xlsx
Excel – Multi-User: .xlsx
Similar ProductsOther customers were also interested in...

 HenrySheykin
Nightclub Financial Model Excel Template
The Nightclub Financial Model helps users turn a nightlife business concept into a structured financ... Read more
Waterpark Business Plan Financial Model Excel Temp...
The Water Park Financial Model helps entrepreneurs, founders, consultants, analysts, and business ow... Read more

Amusement Park Business Plan Financial Model Excel...
The Amusement Park Financial Model Template helps entrepreneurs, founders, business owners, consulta... Read more

Events Agency Financial Model Excel Template
The Event Planner Financial Model helps users turn an event planning business idea into a structured... Read more

Bowling Business Plan Financial Model Excel Templa...
The Bowling Alley Financial Model helps entrepreneurs, owners, consultants, analysts, and business p... Read more

Laser Tag Business Plan Financial Model Excel Temp...
The Laser Tag Financial Model helps entrepreneurs, founders, business owners, consultants, and analy... Read more

Casino Hotel Financial Model Excel Template
The Casino Hotel Financial Model helps users build a structured five-year forecast for an integrated... Read more
Multi Sport Complex Business Plan Financial Model ...
The Multi-Sport Complex Financial Model helps entrepreneurs, founders, operators, consultants, and a... Read more

Golf Course Financial Model Excel Template
The Golf Course Financial Model Financial Model Template helps entrepreneurs, owners, consultants, a... Read more

Baseball Batting Cages Business Plan Financial Mod...
The Batting Cages Financial Model template helps users turn a batting cage business idea into a stru... Read more
You must log in to submit a review.