
0 ITEMS

Amusement Park Business Plan Financial Model Excel Template
The Amusement Park Financial Model Template helps entrepreneurs, founders, business owners, consultants, and analysts build a structured five-year forecast for a capital-intensive entertainment destination. Instead of starting with a blank spreadsheet, users can work from a ready-made model designed around the economics of an amusement park, including admissions, season passes, food and beverage sales, merchandise, express passes, operating costs, staffing, capital investment, cash flow, and profitability. It is built to support practical financial planning before launch, expansion, lender discussions, investor presentations, or internal decision-making. This template is especially useful for anyone preparing an amusement park business plan, funding proposal, feasibility study, or investment analysis. The model organizes key revenue assumptions so users can estimate visitor volume, ticket pricing, ancillary spending, and growth over time. It also helps map out startup costs, ride installation, park construction, land acquisition, technology, maintenance, payroll, insurance, utilities, marketing, and other operating expenses. By connecting these assumptions to automated forecasts, the model makes it easier to understand whether the park can generate enough revenue to support its cost structure and long-term investment requirements. Because amusement parks involve large upfront capital needs and complex operating dynamics, cash flow visibility is critical. This financial model template helps users review monthly and annual projections, identify potential cash gaps, estimate funding requirements, and understand the relationship between construction spending, operating performance, and investor returns. It also supports profitability analysis, break-even analysis, scenario planning, and performance tracking, giving users a clearer view of both opportunity and risk before committing significant capital. The Amusement Park Financial Model is fully editable and designed for use in Microsoft Excel and Google Sheets, making it practical for teams, advisors, and stakeholders who need to collaborate on assumptions and outputs. Users can customize revenue streams, cost categories, payroll assumptions, financing inputs, and presentation-ready reports to match their specific park concept. Whether planning a new amusement park, evaluating a theme park expansion, or preparing financial documents for banks and investors, this template provides a professional framework for smarter forecasting and more confident decision-making.


Financial Model Overview
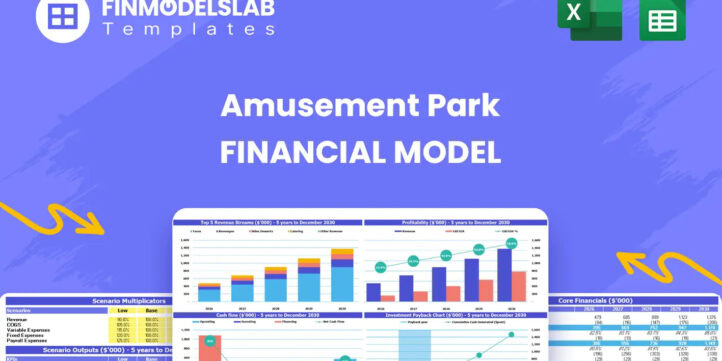
The Amusement Park Financial Model Financial Model Template gives entrepreneurs, business owners, consultants, analysts, and planning teams a structured way to evaluate the financial potential of an amusement park before launch, expansion, or funding discussions. Amusement parks require major upfront investment, diversified revenue planning, high operating discipline, and careful cash flow management, so a generic spreadsheet is rarely enough. This ready-to-use model brings together the core assumptions needed to forecast ticket revenue, season passes, food and beverage sales, merchandise, express passes, staffing, operating expenses, capital expenditure, profitability, and financing needs over a multi-year planning period. It is designed to help users replace guesswork with a clear financial framework that can support business plans, lender packages, investor presentations, feasibility studies, and internal decision-making.
All-in-One Dashboard
The all-in-one dashboard component provides a central view of the model’s most important inputs and outputs, helping users understand the overall financial picture without having to search through multiple tabs or calculations. For an amusement park, this dashboard may summarize visitor assumptions, average ticket prices, season pass activity, ancillary spending, startup investment, operating expenses, EBITDA, net income, cash position, payback period, and other high-level metrics. Users can update the editable assumptions behind the model and quickly see how those changes affect revenue, profitability, funding needs, and cash flow. This is especially useful when presenting the business to investors, lenders, partners, or internal decision-makers, because it condenses complex amusement park economics into a clear management view. The dashboard also supports faster planning conversations by showing whether the park’s attendance levels, pricing, spending per guest, and cost structure are aligned with the desired financial outcome.
Low, Base, and High Scenario Analysis
The low, base, and high scenario analysis component helps users test how the amusement park may perform under different operating and market conditions. Instead of relying on a single forecast, users can compare a conservative case, a realistic base case, and an upside case using assumptions such as annual visitors, ticket pricing, season pass conversion, ancillary spend per guest, labor costs, marketing efficiency, construction timing, and expense inflation. This section helps reveal how sensitive the business is to changes in demand, pricing, and cost structure, which is critical for a large entertainment venue where a small change in attendance can have a major impact on cash flow and profit. A low scenario can help estimate downside cash runway and funding risk, while a high scenario can show the potential return if the park exceeds its visitor and spending targets. This component is useful for strategic planning, investor discussions, lender risk review, and management decision-making because it provides a more realistic view of uncertainty.
Professional Charts
The professional charts component turns key financial outputs into visual reports that are easier to interpret and present. Amusement park forecasts often involve large numbers, multiple revenue streams, major capital investments, seasonal operating patterns, and long-term profitability trends, so charts can make the story much clearer for stakeholders. This component may visualize revenue growth, EBITDA progression, cash flow movement, cost structure, visitor growth, capital expenditure, profitability margins, and other major performance indicators. The benefit is that users can move beyond rows of spreadsheet data and present a polished financial narrative in meetings, pitch decks, funding documents, or internal reviews. Clear visuals also help identify trends and issues more quickly, such as whether revenue growth is strong enough to offset rising payroll, whether cash reserves are improving, or whether major capital outflows create temporary funding pressure. For consultants and founders, presentation-ready charts can save time and improve the professionalism of the financial plan.
ROE Components and DuPont Analysis
The ROE components and DuPont analysis section helps users understand the drivers behind return on equity, rather than looking only at a single headline percentage. For an amusement park, equity returns can be heavily influenced by operating margins, asset intensity, financing structure, debt levels, and the size of the initial investment. This component breaks return on equity into underlying financial drivers so users can see whether returns are being created through strong profitability, efficient asset use, leverage, or a combination of these factors. Inputs may include net income, revenue, assets, equity, debt assumptions, and profitability margins, while outputs may show how each part contributes to the overall return profile. This is valuable for investor analysis because amusement parks often require significant capital for land, construction, rides, attractions, buildings, and infrastructure. By reviewing ROE components, users can evaluate whether the proposed financing structure is sustainable, whether returns are being supported by real operating performance, and how changes in debt or equity funding may affect investor outcomes.
Revenue Inputs
The revenue inputs component gives users a structured place to build the commercial assumptions that drive the amusement park forecast. This section may include visitor volume, single-day ticket pricing, season pass pricing, season pass holders, food and beverage spend per guest, merchandise spend per guest, express pass uptake, group sales, event revenue, parking, sponsorships, and other income streams relevant to the park concept. Because revenue in an amusement park is not limited to admission tickets, this component helps users capture both core ticket sales and higher-margin ancillary income. The model can use these assumptions to calculate monthly and annual revenue projections, allowing users to test different pricing strategies, attendance targets, and spending patterns. This is useful for business planning because it connects the operating strategy to financial outcomes. For example, users can assess whether increasing season pass sales improves cash flow stability, whether food and merchandise sales materially improve profit margins, or whether a change in average ticket price supports the required return on investment.
Bank-Ready Reports
The bank-ready reports component organizes financial outputs in a format suitable for lenders, credit analysts, investors, and other funding stakeholders. Amusement park projects often require substantial external financing, so banks and investors typically need clear evidence of projected revenue, expenses, profit, cash flow, debt service capacity, capital requirements, and repayment ability. This component may include structured financial statements, annual summaries, monthly cash flow forecasts, profit and loss projections, balance sheet outputs, investment summaries, and lender-friendly metrics. The goal is to help users present the model in a professional and credible way, rather than relying on disconnected calculations. Bank-ready reporting is particularly useful when applying for construction financing, equipment loans, project funding, refinancing, or expansion capital. It helps demonstrate that the user has considered the scale of the investment, the timing of cash needs, the operating assumptions behind the forecast, and the financial capacity of the amusement park to support its obligations over time.
Revenue Breakdown
The revenue breakdown component provides a detailed view of how total amusement park revenue is generated across different streams. Instead of showing only one combined sales figure, this section separates the contribution from single-day tickets, season passes, food and beverage, merchandise, express passes, parking, group bookings, special events, sponsorships, and other possible revenue categories. This is important because each stream may have different pricing, volume, margins, seasonality, and growth assumptions. By reviewing the revenue breakdown, users can identify which income sources are most important to the business model and which have the greatest potential for improvement. The component can also help evaluate the balance between admission revenue and ancillary spending, which is a key planning area for amusement parks. If the model shows that profitability depends heavily on food, beverage, and merchandise sales, management can focus on layout, product mix, pricing, and guest experience strategies that increase spending per visitor. This section supports better budgeting, operating strategy, and investor communication.
KPI Dashboard
The KPI dashboard component focuses on the key performance indicators that help users monitor the health and efficiency of the amusement park business. These metrics may include total visitors, average revenue per visitor, ticket revenue per guest, ancillary spend per guest, attendance growth, EBITDA margin, net profit margin, cash balance, cost per visitor, payroll as a percentage of revenue, return on equity, payback period, and other performance benchmarks. A KPI dashboard is useful because it translates detailed financial projections into measurable targets that management can track over time. For startups, it helps define what success should look like after opening. For established operators, it can support expansion planning, performance reviews, and investor updates. This component also helps users compare actual or projected performance against industry benchmarks and internal goals, making the model more useful as an ongoing management tool. By focusing on the right KPIs, users can make faster decisions about pricing, staffing, marketing, maintenance, cash reserves, and growth investments.
Startup and Capital Expenditure Planning
The startup and capital expenditure planning component helps users estimate the initial investment required to launch or expand an amusement park. This section may include land acquisition, site preparation, park construction, ride installations, safety systems, buildings, landscaping, utilities, parking areas, point-of-sale systems, ticketing technology, signage, furniture, fixtures, pre-opening marketing, professional fees, licenses, permits, deposits, and initial working capital. Because amusement parks are capital-intensive, this component is essential for understanding how much funding may be needed before the park begins generating meaningful revenue. The model can organize one-time costs by category and timing, helping users see when cash will be required and how construction or opening schedules may affect funding needs. This is valuable for investor planning, bank discussions, and internal budgeting because it creates a more complete view of the financial commitment. It also helps users test phased development strategies, evaluate whether certain capital expenses can be delayed, and reduce the risk of underestimating launch costs.
Break-Even Analysis
The break-even analysis component helps users estimate when the amusement park can cover its operating costs and begin generating sustainable profit. This section may use assumptions such as fixed operating expenses, variable costs, ticket pricing, visitor volume, contribution margins, payroll, utilities, maintenance, insurance, marketing, and ancillary revenue per guest to determine the level of sales or attendance required to break even. For an amusement park, this analysis is especially useful because the business typically combines high fixed costs with revenue that depends on attendance, pricing, seasonality, and guest spending behavior. The break-even view helps users understand whether projected visitor numbers are sufficient to support monthly operations and how much revenue is needed before the park becomes financially stable. It can also help management evaluate pricing changes, cost reductions, marketing campaigns, presale strategies, and staffing plans. For investors and lenders, break-even analysis provides a simple but powerful indicator of operating risk, showing how quickly the park may move from cost coverage to profitability and how much cushion exists if attendance is lower than expected.
File types:
Excel – Single-User: .xlsx
Excel – Multi-User: .xlsx
Similar ProductsOther customers were also interested in...


 HenrySheykin
Waterpark Business Plan Financial Model Excel Temp...
The Water Park Financial Model helps entrepreneurs, founders, consultants, analysts, and business ow... Read more

Casino Hotel Financial Model Excel Template
The Casino Hotel Financial Model helps users build a structured five-year forecast for an integrated... Read more
Golf Course Financial Model Excel Template
The Golf Course Financial Model Financial Model Template helps entrepreneurs, owners, consultants, a... Read more
Trampoline Park Business Financial Model Excel Tem...
The Trampoline Park Financial Model helps entrepreneurs, founders, consultants, analysts, and busine... Read more

Amusement Park Business Plan Financial Model Excel...
The Amusement Park Financial Model Financial Model Template helps entrepreneurs, founders, business ... Read more
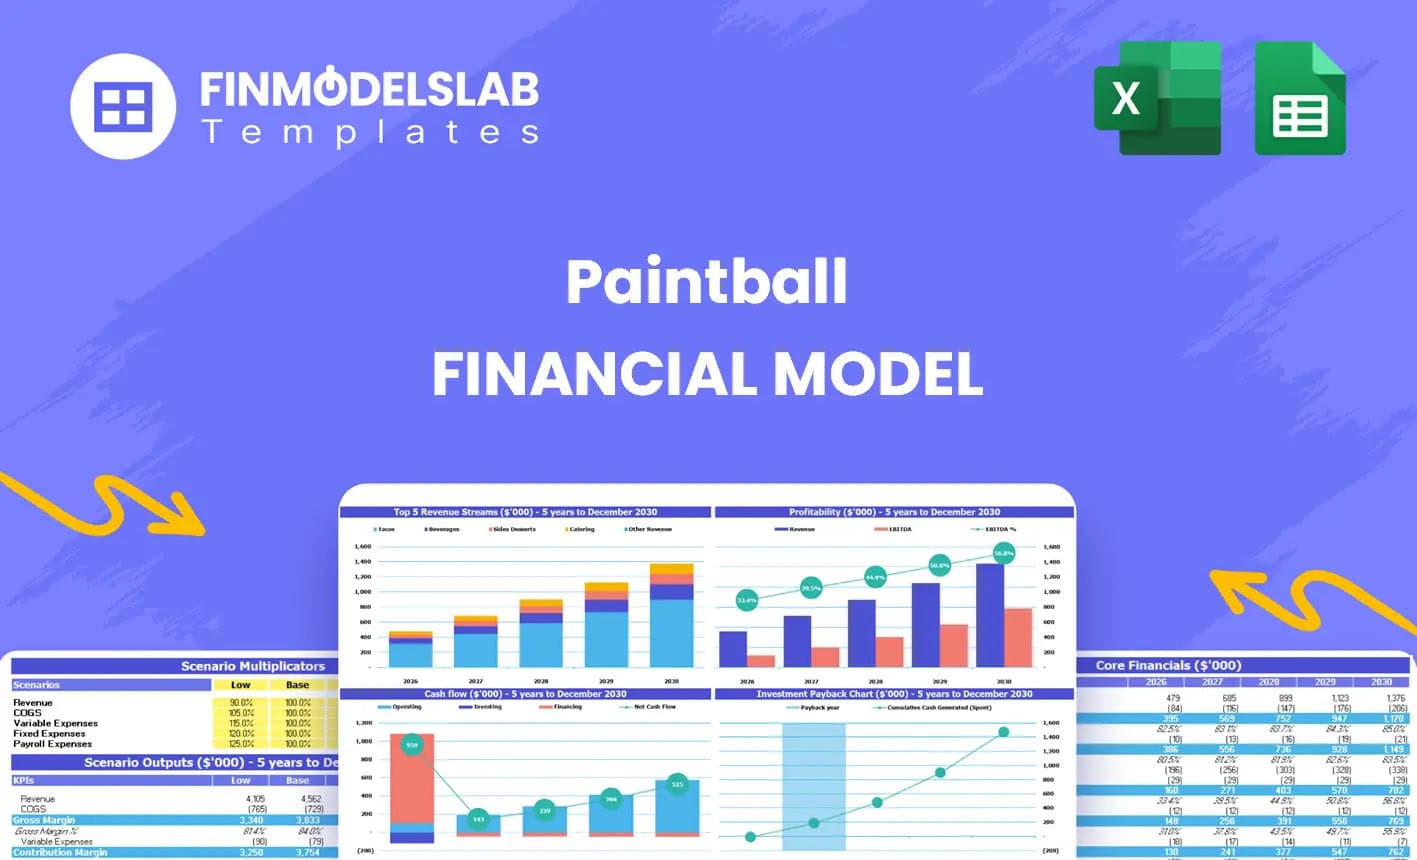
Paintball Financial Model Excel Template
The Paintball Financial Model helps entrepreneurs, founders, consultants, analysts, and business own... Read more
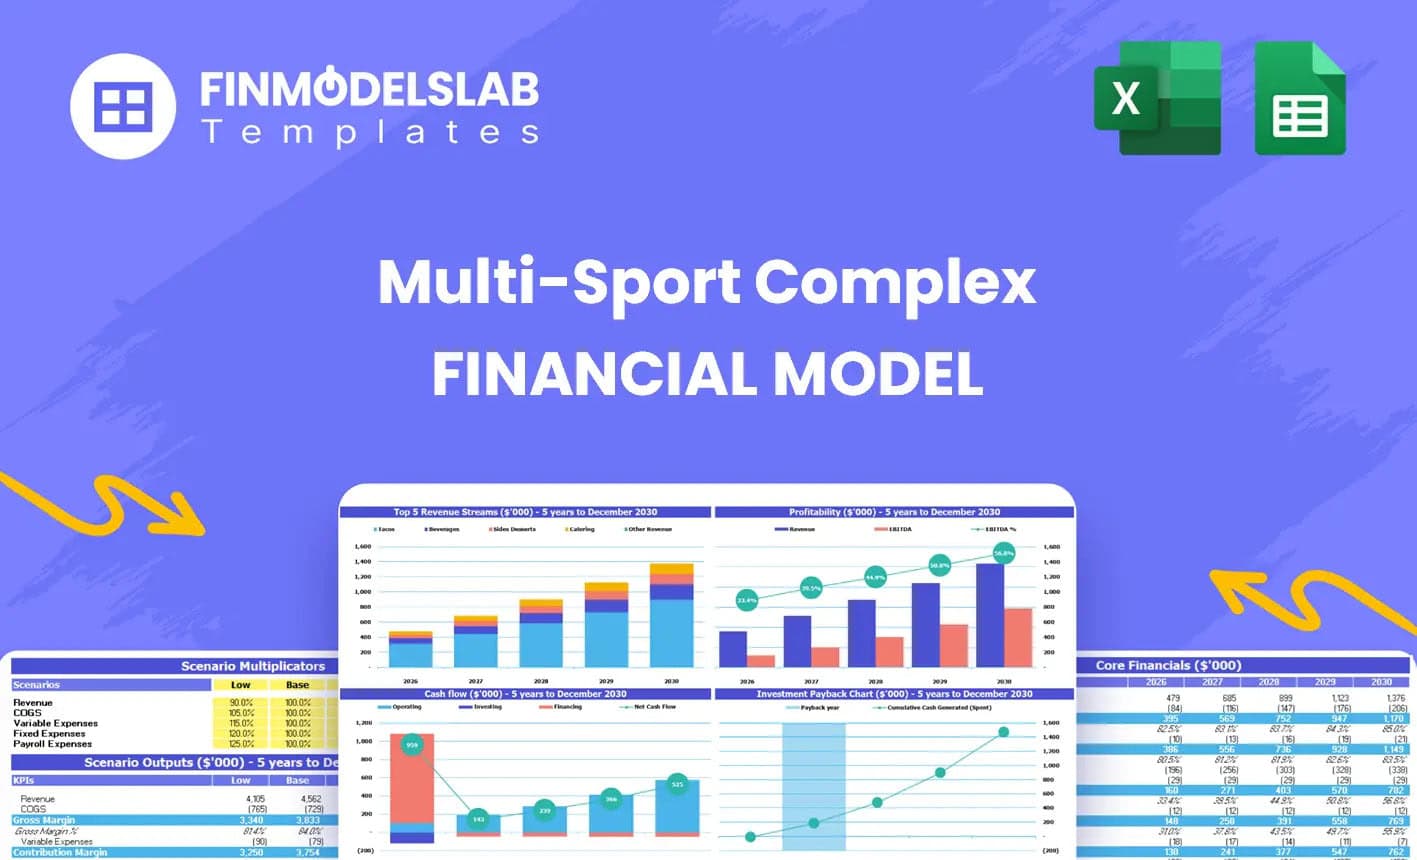
Multi Sport Complex Business Plan Financial Model ...
The Multi-Sport Complex Financial Model helps entrepreneurs, founders, operators, consultants, and a... Read more
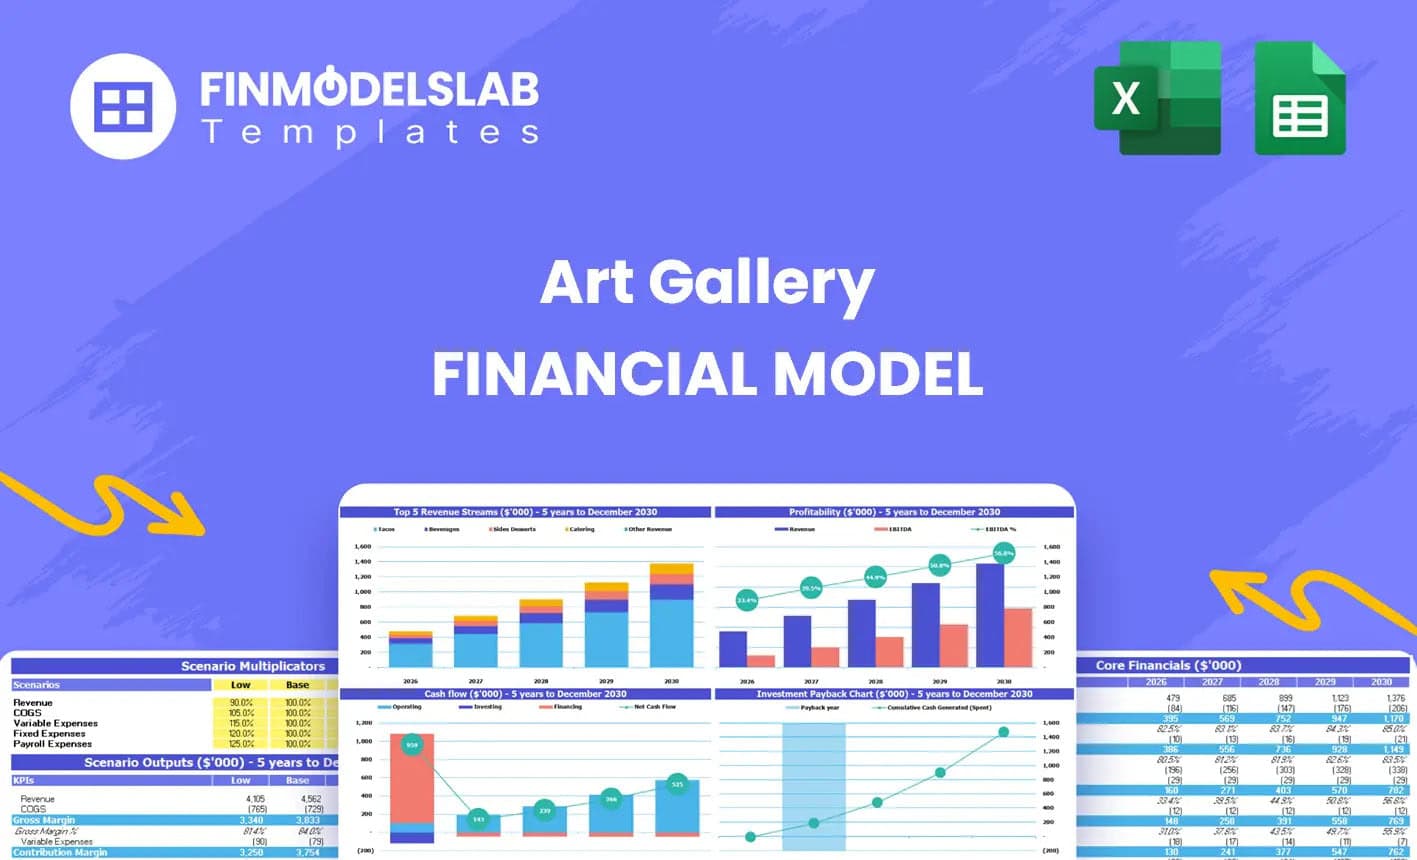
Art Gallery Business Plan Financial Model Excel Te...
The Art Gallery Financial Model Financial Model Template helps turn an art gallery concept into a st... Read more
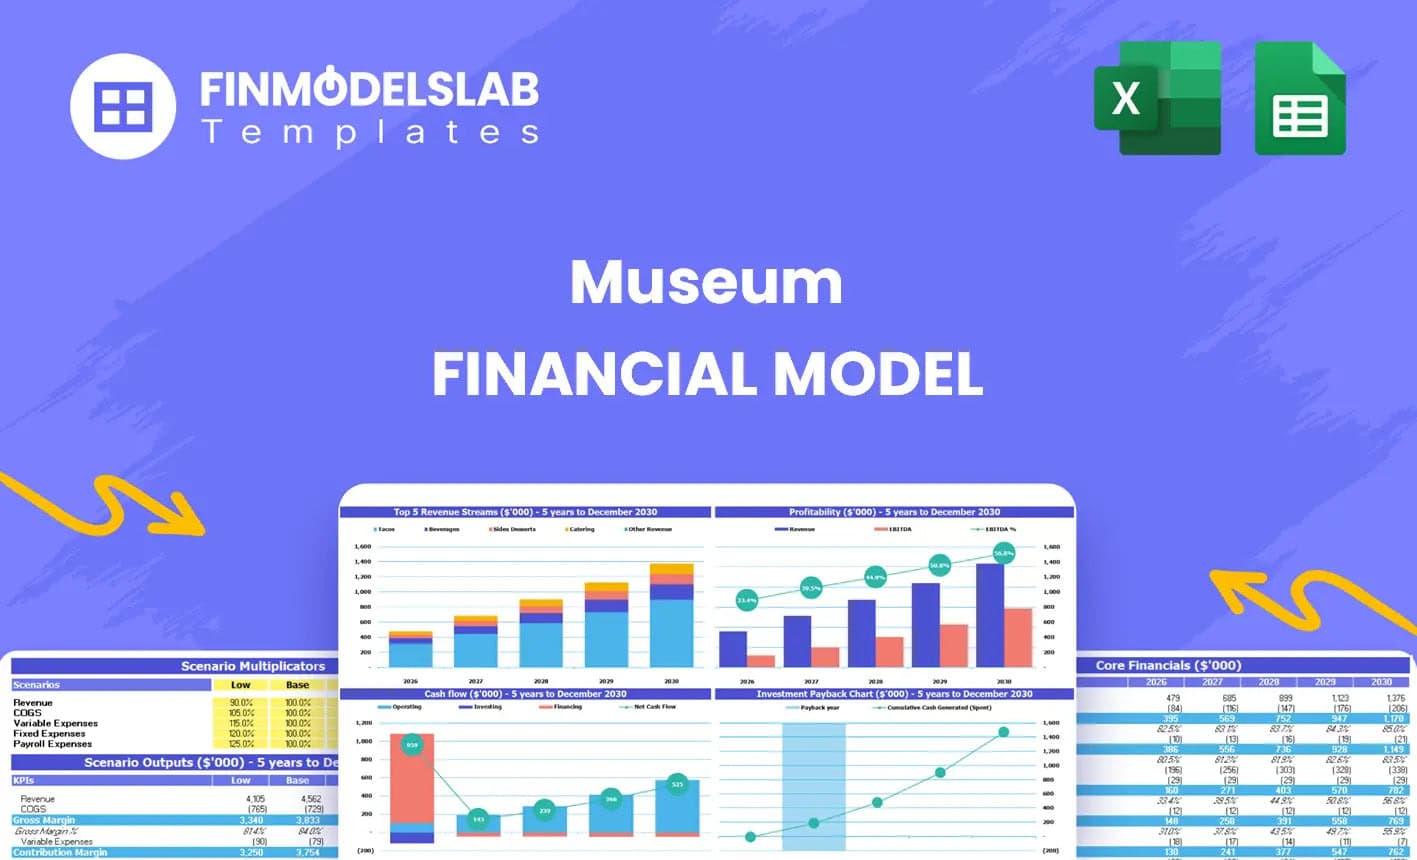
Museum Business Plan Financial Model Excel Templat...
The Museum Financial Model helps users turn a museum concept, expansion plan, or funding proposal in... Read more

 Giorgos
Theme Park & Hotel Financial Model (Construct...
Financial model presenting a development scenario for a Theme Park & Hotel project including con... Read more
You must log in to submit a review.