
0 ITEMS

DCF Valuation Model Excel Template: Download in 5 Min
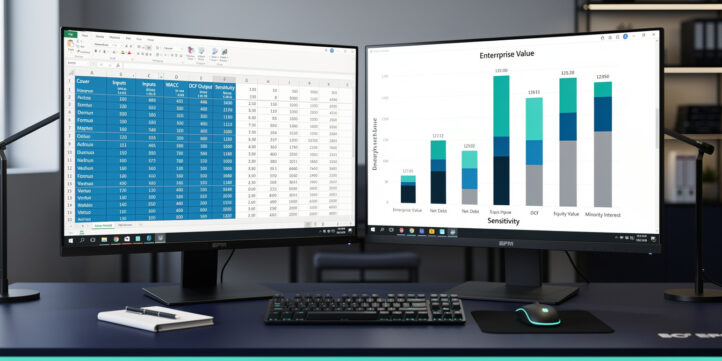
The eFinancialModels DCF valuation model Excel template gives you a fully formula-driven discounted cash flow model you can populate with real company data in under 30 minutes, no build-from-scratch required.
Key Takeaways
- Download the EFM DCF Excel template now: it includes a WACC calculator, 5-to-10-year free cash flow forecast, terminal value (Gordon Growth and exit multiple methods), and a two-variable sensitivity table.
- Building a DCF from scratch takes an experienced analyst 8 to 20 hours; a pre-built professional template cuts that to under 30 minutes of data entry.
- Industry WACC benchmarks range from roughly 6% for regulated utilities to 18% or higher for early-stage technology companies, and the template’s WACC tab lets you toggle inputs for each sector.
- The standard explicit forecast period used by investment banks is 5 to 10 years, with a terminal value representing 60% to 80% of total enterprise value in most deals.
- Perpetuity growth rate assumptions in the Gordon Growth Model should stay within 50 to 100 basis points of long-run nominal GDP growth, typically 2% to 3% for developed-market companies.
- The template is macro-free, compatible with Excel 2016 and later (including Microsoft 365), and contains 7 structured worksheets.
- Three built-in validation checks flag circular references, negative FCFF, and WACC inputs that fall outside plausible sector ranges.
Download Your DCF Valuation Model Excel Template
The EFM DCF valuation model is available immediately from the DCF template library. The file is macro-free, opens in Excel 2016, Excel 2019, Excel 2021, and Microsoft 365, and weighs under 2 MB.
Here is what you get on download:
- File format: .xlsx (no macros, no add-ins required)
- Compatibility: Excel 2016 and later, including Microsoft 365 on Windows and Mac
- Sheet count: 7 worksheets (Cover, Inputs, Income Statement, Free Cash Flow, WACC, DCF Output, Sensitivity)
- Formula engine: 100% native Excel functions: XNPV, OFFSET, IFERROR, data validation drop-downs
- Print-ready: Each output sheet is formatted for A4 and US Letter
If you want a broader library of financial model templates for M&A, LBO, or three-statement modeling, the EFM catalog covers all of those as well.

Seven purpose-built worksheets handle each layer of the DCF valuation, from raw inputs to sensitivity analysis.
What’s Inside the DCF Template: Components and Structure
The template contains seven purpose-built worksheets, each handling one discrete layer of the valuation. Every cell that requires user input is shaded blue; all formula cells are locked and shaded white.
Sheet-by-Sheet Breakdown
1. Cover: Company name, ticker, analyst name, valuation date, and currency selector (USD, EUR, GBP, AUD). Changes here cascade to all output headers automatically.
2. Inputs: Historical financials for up to 3 years, revenue growth assumptions by year, EBIT margin targets, D&A as a percentage of revenue, capex schedule, and working capital days (DSO, DIO, DPO). This is the only sheet most users need to edit.
3. Income Statement: Projects revenue through EBIT for the explicit forecast period (5 or 10 years, toggled by a drop-down). Calculates NOPAT (Net Operating Profit After Tax), which is operating profit adjusted for taxes, the starting point for unlevered free cash flow.
4. Free Cash Flow: Derives unlevered free cash flow to the firm (FCFF), defined as NOPAT plus D&A minus capex minus the change in net working capital. This is the cash a business generates before any financing costs.
5. WACC: Calculates the weighted average cost of capital (WACC), the blended required return on debt and equity used to discount future cash flows. Inputs include risk-free rate, equity risk premium, beta, pre-tax cost of debt, and the debt-to-equity ratio. The sheet references Damodaran’s sector beta database as a benchmark guide.
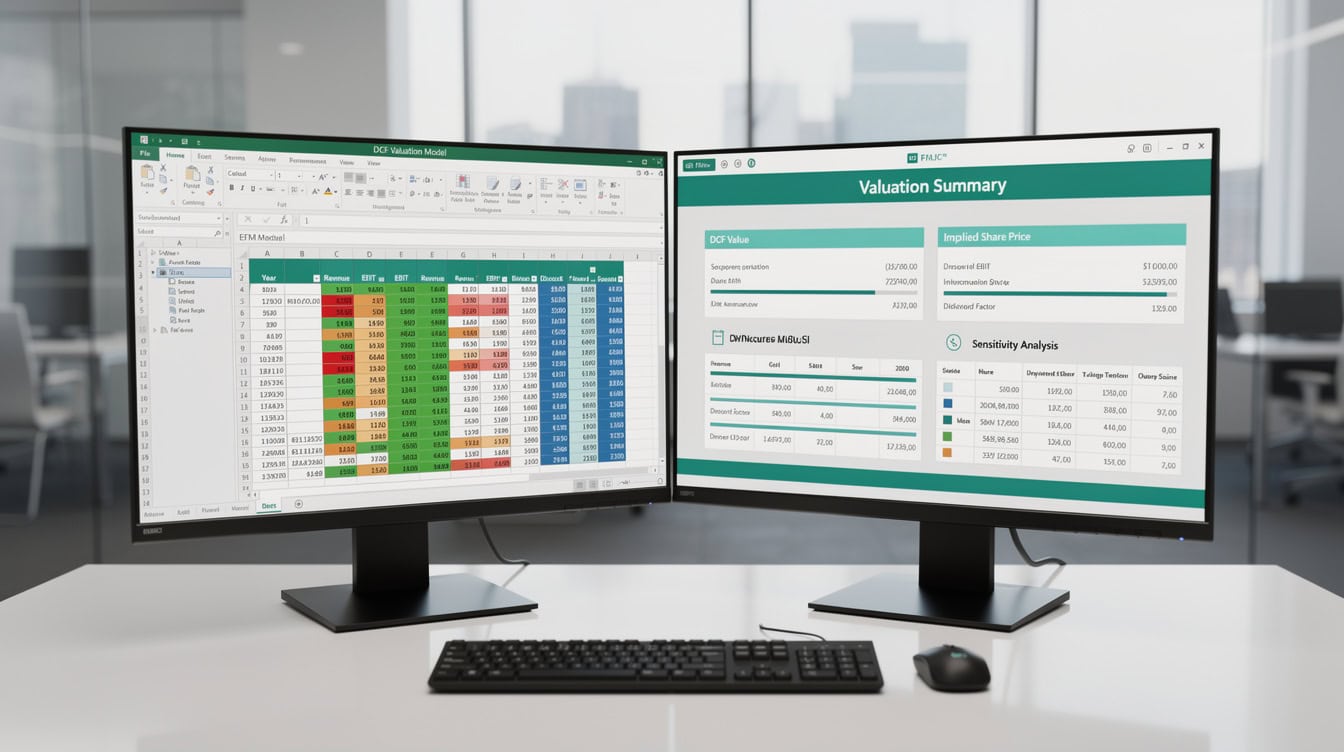
6. DCF Output: Discounts each year’s FCFF at WACC using Excel’s XNPV function (which handles irregular periods precisely), adds the present value of the terminal value, and subtracts net debt to arrive at equity value per share.
7. Sensitivity: A two-variable data table (a built-in Excel feature that recalculates a formula across a grid of input combinations) showing implied share price across a matrix of WACC (rows) and perpetuity growth rate (columns), plus a second table for WACC vs. exit EV/EBITDA multiple.
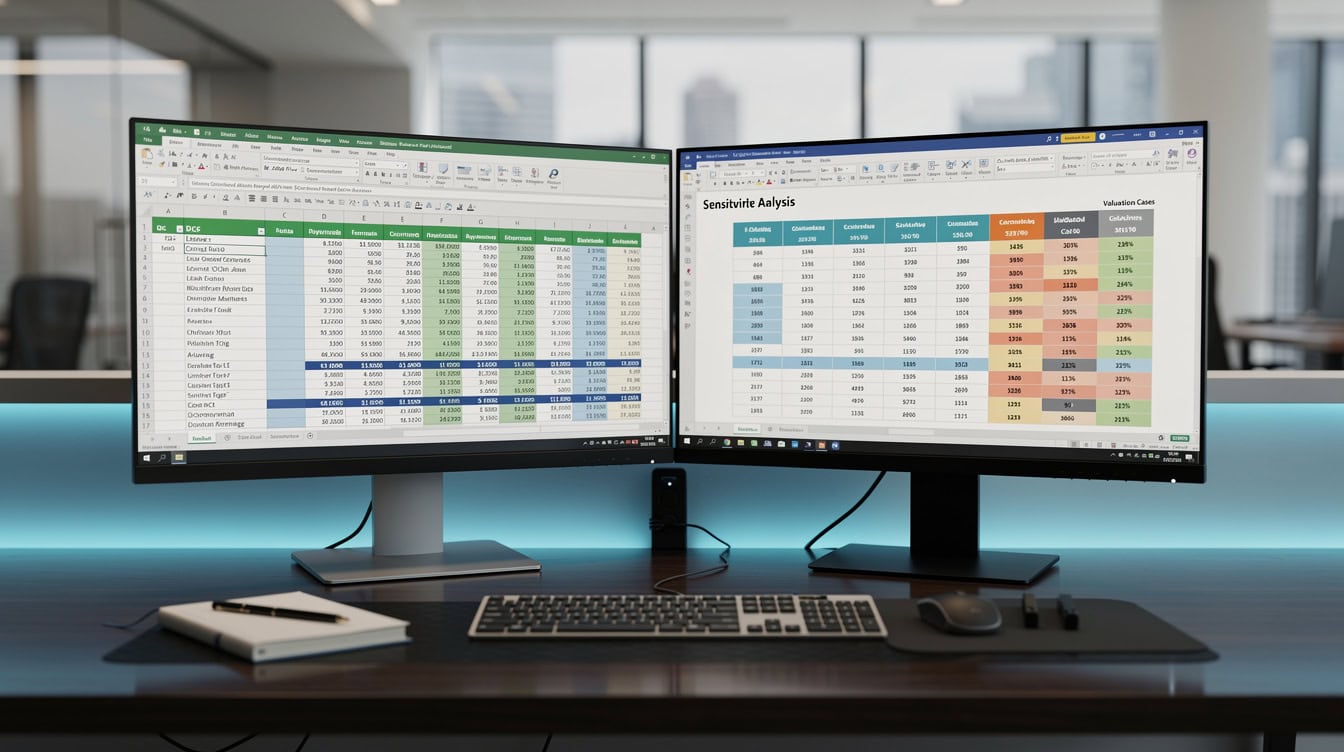
The WACC tab builds cost of capital from CAPM inputs and flags values outside the 5%–25% plausible range.
How to Use This DCF Model: Step-by-Step Implementation
You can produce a complete DCF valuation in five steps, typically in 15 to 30 minutes for a company with publicly available financials.
Step 1: Enter company identifiers (2 minutes). Open the Cover sheet. Type the company name, reporting currency, and valuation date. The fiscal year-end month selector adjusts the mid-year convention automatically.
Step 2: Populate historical financials (5 minutes). On the Inputs sheet, enter 3 years of revenue, EBIT, D&A, capex, and balance sheet working capital items. Pull these from the company’s 10-K or annual report.
Step 3: Set forecast assumptions (10 minutes). Enter year-by-year revenue growth rates, EBIT margin targets, capex as a percentage of revenue, and working capital days. The Income Statement and Free Cash Flow sheets update instantly.
Step 4: Build your WACC (5 minutes). On the WACC sheet, enter the risk-free rate (typically the 10-year government bond yield), equity risk premium, levered beta, pre-tax cost of debt, and the target capital structure. The sheet calculates WACC and flags it if it falls outside the 5% to 25% plausible range.
Step 5: Review the DCF Output and Sensitivity (5 minutes). The Output sheet shows enterprise value, equity value, and implied share price. Check the Sensitivity sheet to understand how your valuation changes if WACC moves 100 basis points or the growth rate shifts 50 basis points.

Five steps, 30 minutes: the EFM template’s structured input flow eliminates the blank-spreadsheet problem.
Worked Example: SaaS Company Valuation
Here is the math for a hypothetical SaaS business with $50M in trailing revenue:
- Revenue (Year 1 forecast): $65M (30% growth)
- EBIT margin: 18%
- EBIT: $11.7M
- Tax rate: 25%
- NOPAT: $8.775M
- D&A: $3M
- Capex: $4M
- Change in NWC: $1.5M
- FCFF Year 1: $8.775M + $3M – $4M – $1.5M = $6.275M
- WACC: 12%
- Perpetuity growth rate: 3%
- Terminal Value (Gordon Growth): $6.275M × (1.03) / (0.12 – 0.03) = $71.8M
- PV of Terminal Value (discounted 5 years at 12%): $71.8M / (1.12)^5 = $40.7M
- Sum of PV of FCFFs (Years 1-5): ~$22M (calculated by XNPV in the template)
- Enterprise Value: $22M + $40.7M = $62.7M
- Less: Net Debt: $5M
- Equity Value: $57.7M
The template performs every one of these calculations automatically once you enter the blue input cells.
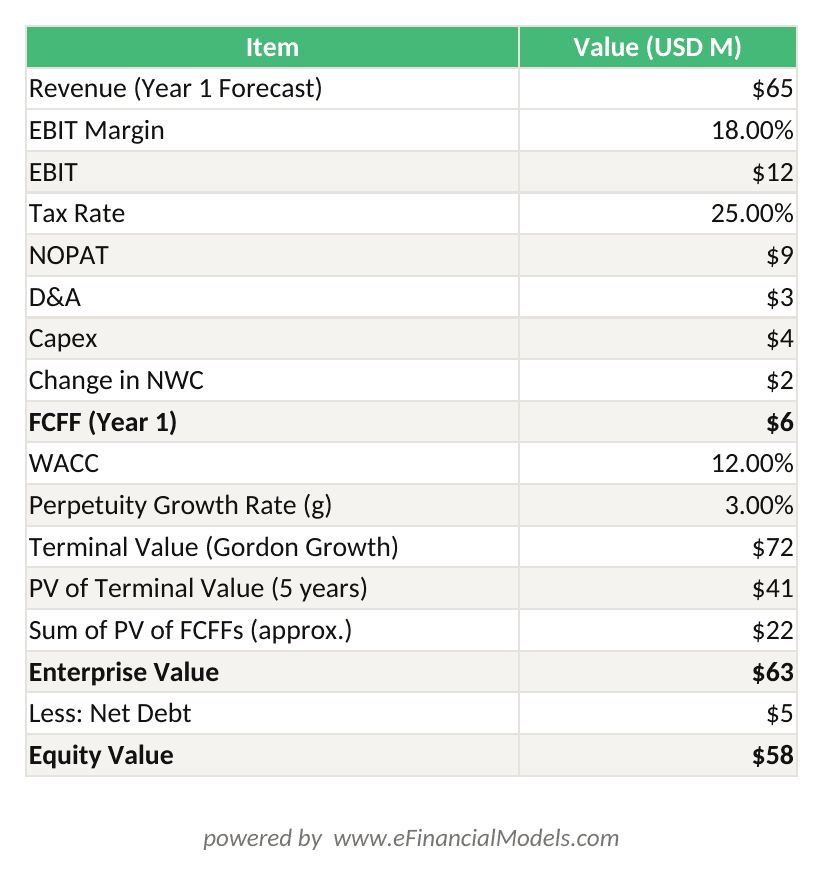
FCFF = NOPAT + D&A – Capex – ΔNWC = $6.275M; Enterprise Value = PV(FCFFs) + PV(TV) = $62.7M; Equity Value = $57.7M after $5M net debt.
Customizing the Template for Your Valuation Scenario
The template handles four common valuation contexts without structural changes.
High-Growth Tech vs. Mature Industrials
For high-growth companies, extend the explicit forecast period to 10 years using the drop-down on the Inputs sheet. Use a two-stage growth model: high growth for years 1 to 5, then a fade to terminal growth for years 6 to 10. For mature industrials with stable margins, a 5-year period is usually sufficient.
Pre-Revenue Startups
Enter zero or negative FCFF in early years. The XNPV function handles negative cash flows correctly. Set a higher WACC (15% to 25%) to reflect execution risk. The sensitivity table becomes especially important here because small changes in the growth assumption create large swings in value.
Cyclical Businesses
For mining, energy, or construction companies, use a normalized EBIT margin (the mid-cycle average) rather than the current-year margin. The Inputs sheet has a toggle for normalized vs. reported margins.

The template’s forecast period toggle and normalized margin input handle both high-growth and cyclical valuation scenarios.
Professional DCF Template vs. Basic Versions: What Differs
Not all DCF templates are equal. Here is how the EFM template compares to a basic self-built version.
| Feature | Basic Template | EFM Professional Template |
|---|---|---|
| Forecast period | Fixed 5 years | 5 or 10 years (toggle) |
| Terminal value | Gordon Growth only | Gordon Growth + Exit Multiple |
| WACC | Manual entry | Full CAPM build-up |
| Working capital | Ignored | DSO/DIO/DPO driven |
| Mid-year convention | Not included | Toggle on/off |
| Sensitivity table | None | 2-variable, dual scenarios |
| Error checks | None | 3 built-in validation flags |
| Scenario analysis | None | Base/Bull/Bear toggle |
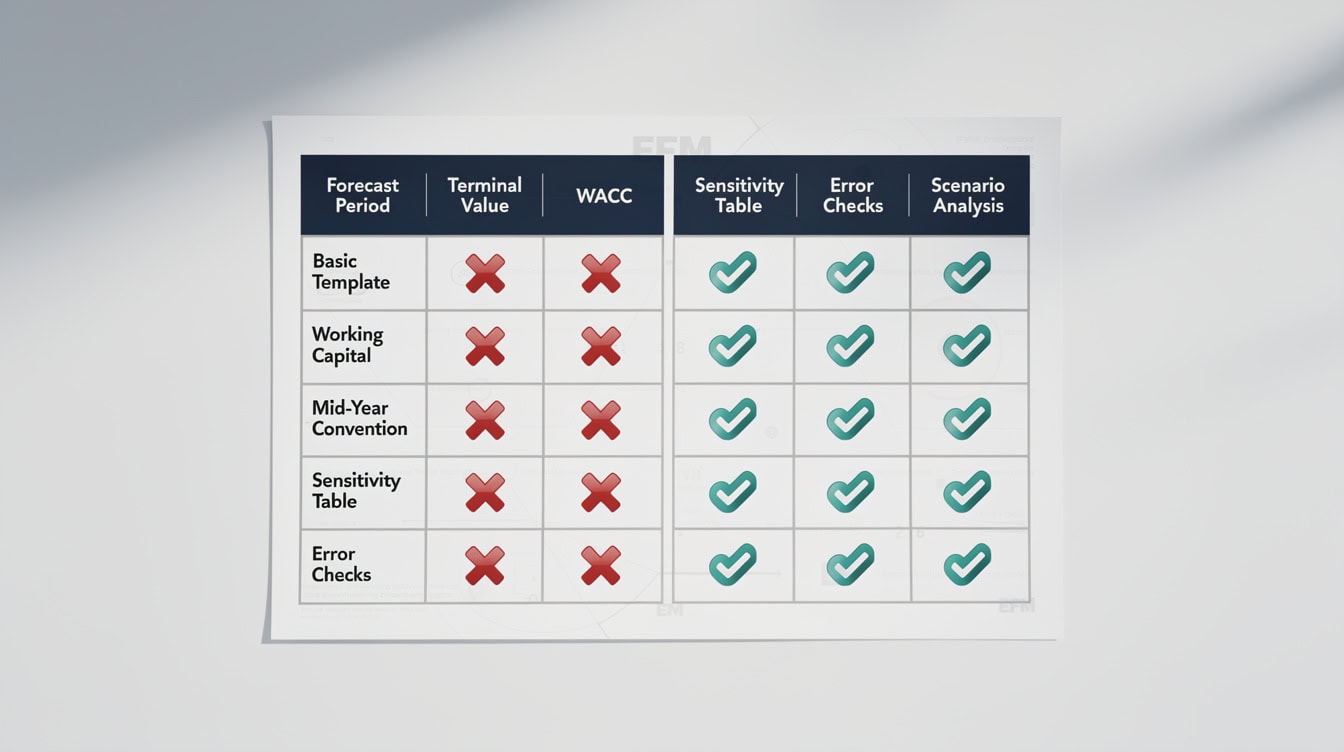
Eight features separate a professional DCF template from a basic version — working capital modeling and dual terminal value methods are the most impactful.
Common DCF Modeling Mistakes This Template Prevents
The template’s built-in validation catches the 5 most frequent DCF errors practitioners make.
Mistake 1: Circular WACC. Many analysts accidentally create a circular reference by using market cap (which depends on the DCF output) to calculate the equity weight in WACC. The template uses a target capital structure input, breaking the circularity.
Mistake 2: Inconsistent tax treatment. Applying the tax rate to EBIT instead of EBIT minus interest (for FCFF) overstates NOPAT. The template calculates NOPAT correctly as EBIT × (1 – tax rate), consistent with unlevered free cash flow methodology.
Mistake 3: Ignoring working capital. A business growing revenue at 30% per year consumes significant working capital. Omitting the change in NWC overstates FCFF. The template’s DSO/DIO/DPO inputs calculate NWC changes automatically.
Mistake 4: Terminal value growth rate above WACC. If the perpetuity growth rate equals or exceeds WACC, the Gordon Growth formula produces a negative or infinite terminal value. The template flags this with a red cell and an IFERROR message.
Mistake 5: Using EBITDA instead of FCFF as the discount base. EBITDA is not free cash flow. It ignores capex and working capital changes. The template enforces the correct FCFF derivation and shows the bridge from EBITDA to FCFF explicitly.
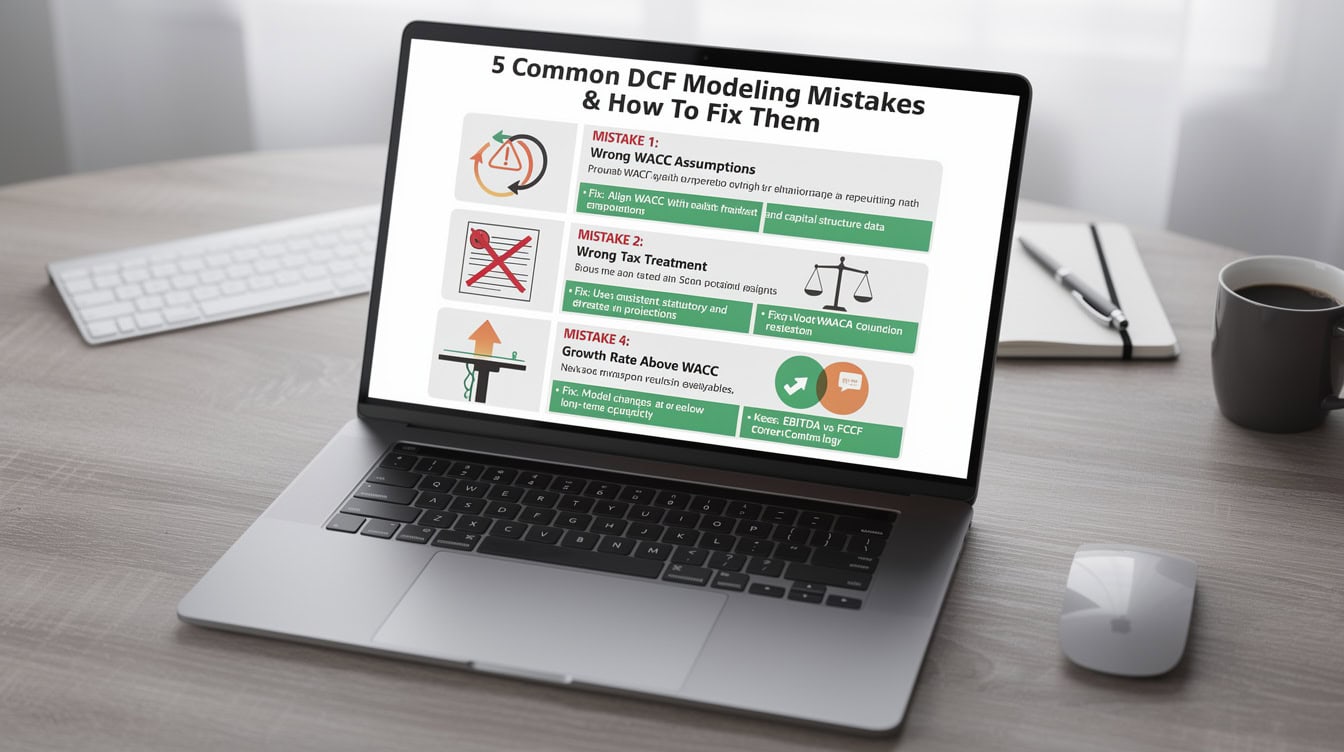
Three built-in validation checks and correct formula architecture prevent the 5 most costly DCF errors.
Understanding the DCF Calculation Engine: Technical Overview
The template uses Excel’s XNPV function rather than the simpler NPV function. XNPV (which stands for Net Present Value with explicit dates) discounts each cash flow based on its exact date rather than assuming equal annual intervals (Microsoft support). This matters when a company’s fiscal year does not align with the calendar year or when you apply the mid-year convention (which assumes cash flows arrive at the midpoint of each year rather than year-end, producing a slightly higher valuation). Excel’s XNPV function requires at least 2 values in the values argument (Microsoft), and the template is structured to always supply a full forecast series, ensuring the function never returns an error on a properly completed model.
The WACC formula the template implements is: WACC = (E/V) × Ke + (D/V) × Kd × (1 – T), where E is equity value, D is debt value, V is total capital, Ke is cost of equity (from CAPM), Kd is pre-tax cost of debt, and T is the corporate tax rate. This is the standard formulation per the CFA Institute curriculum. Excel’s native IFERROR function, which the template uses extensively to suppress error displays, can trap up to 7 distinct error types (Microsoft) — including #DIV/0!, #VALUE!, and #REF! — making it ideal for protecting the WACC and terminal value formulas against incomplete inputs.
For terminal value, the Gordon Growth Model formula is: TV = FCFFn × (1 + g) / (WACC – g), where FCFFn is the final forecast year’s free cash flow and g is the perpetuity growth rate. The International Valuation Standards Council (IVSC) recommends anchoring g to long-run nominal GDP growth expectations, which for developed markets has averaged approximately 2% to 3% over multi-decade periods according to World Bank data.

XNPV handles irregular periods precisely; the Gordon Growth terminal value formula anchors g to long-run GDP growth.
When to Use DCF vs. Alternative Valuation Methods
DCF is the right primary method when you have predictable cash flows and a clear capital structure. Use it alongside comparable company analysis and precedent transactions for a full valuation range.
| Method | Best For | Limitation |
|---|---|---|
| DCF | Intrinsic value, M&A, fairness opinions | Sensitive to WACC and growth assumptions |
| Comparable companies | Public market benchmarking | Requires liquid peer group |
| Precedent transactions | M&A pricing, control premium | Stale data, deal-specific premiums |
| LBO analysis | PE buyout floor value | Requires leverage assumptions |
| Asset-based | Holding companies, real estate | Ignores going-concern value |
According to a survey by the Association for Financial Professionals, DCF analysis is used in over 75% of corporate capital budgeting decisions, making it the most widely applied valuation technique in practice. For business valuation work, combining DCF with at least one market-based method (comparables or precedent transactions) is considered best practice under ASC 820 fair value measurement standards.
A football field chart combining DCF with market-based methods gives a defensible valuation range for M&A and equity research.
Frequently Asked Questions About the DCF Excel Template
What Excel version do I need to use this DCF template?
The EFM DCF template requires Excel 2016 or later on Windows, or Excel 2016 or later on Mac. It uses the XNPV function, which was introduced in Excel 2007 but behaves consistently from Excel 2016 onward. Microsoft 365 subscribers get the best experience because dynamic array functions (used in the sensitivity table) perform faster in that version. The file is saved in .xlsx format with no macros, so you do not need to enable any security settings. If you open it in Google Sheets, most formulas will work, but the two-variable data table (used for sensitivity analysis) requires Excel and will not recalculate in Sheets. For the full feature set, use Excel 2016 or Microsoft 365.
How long does it take to complete a DCF valuation using this template?
For a publicly traded company with financials available on SEC EDGAR or a Bloomberg terminal, most analysts complete the full model in 15 to 30 minutes. The majority of that time goes to gathering 3 years of historical revenue, EBIT, D&A, capex, and balance sheet working capital data. The template’s Inputs sheet is structured to match the line items in a standard 10-K income statement and balance sheet, so you can copy and paste directly. For a private company where you need to normalize financials or estimate a capital structure, allow 45 to 60 minutes. Building the same model from scratch typically takes 8 to 20 hours for an experienced analyst, including formula construction, formatting, and error-checking.
What WACC should I use for my industry?
WACC varies significantly by sector. Regulated utilities typically use a WACC of 5% to 7% because their cash flows are stable and government-backed. Consumer staples companies generally fall in the 7% to 9% range. Industrial and healthcare companies typically use 8% to 11%. High-growth technology companies often apply a WACC of 12% to 18%, reflecting higher equity risk premiums and beta values above 1.5. Early-stage startups may use 20% to 30% to account for execution risk. The WACC sheet in the EFM template includes a sector reference table based on Damodaran’s annual beta and risk premium data (published by NYU Stern), so you can benchmark your inputs against industry norms before finalizing your discount rate.
What is the difference between FCFF and FCFE, and which does this template use?
FCFF (Free Cash Flow to the Firm) is the cash a business generates before any payments to debt or equity holders. It equals NOPAT plus D&A minus capex minus the change in net working capital. FCFE (Free Cash Flow to Equity) subtracts net debt repayments and interest (after tax) from FCFF, giving the cash available specifically to equity holders. The EFM template uses FCFF discounted at WACC, which produces enterprise value. You then subtract net debt to get equity value. This approach is preferred for M&A and corporate finance work because it is capital-structure-neutral. If you want to value equity directly using FCFE discounted at the cost of equity (Ke), you can adapt the Free Cash Flow sheet by adding a debt schedule, which is a straightforward extension covered in the template’s instruction tab.
Can I use this template for a pre-revenue startup?
Yes. The template handles negative FCFF in early years correctly because XNPV discounts each cash flow individually, including negative values. For pre-revenue startups, set revenue in years 1 and 2 to your projected figures (even if small), enter negative EBIT margins reflecting the burn period, and use a WACC of 20% to 30% to reflect venture-stage risk. The sensitivity table becomes critical for startups because the implied valuation is highly sensitive to the year in which the company reaches positive FCFF and the long-run margin assumption. Many venture-backed companies also use a probability-weighted scenario approach: run three DCFs (base, bull, bear) and weight them by probability. The template’s scenario toggle supports this directly.
Does this template comply with ASC 820 or IVS valuation standards?
The template’s methodology is consistent with the income approach to fair value measurement described in ASC 820 (the FASB standard for fair value in financial reporting) and the International Valuation Standards (IVS 105, Income Approach). Both frameworks require that discount rates reflect market participant assumptions and that terminal value growth rates be supportable by long-run economic data. The template’s WACC build-up uses market-observable inputs (risk-free rate, equity risk premium, beta) consistent with ASC 820’s Level 2 and Level 3 fair value hierarchy. However, the template is a tool, not a certified appraisal. For formal fairness opinions or financial reporting valuations, a credentialed valuation professional (CFA, ASA, or CPA/ABV) should review and sign off on the assumptions.
How do I handle cyclical companies where current margins are not representative?
For cyclical businesses (energy, mining, construction, shipping), using current-year EBIT margins in a DCF produces a valuation that reflects the cycle peak or trough rather than intrinsic value. The correct approach is to use a normalized margin, typically the average EBIT margin over a full business cycle (5 to 10 years). The EFM template’s Inputs sheet includes a normalized margin toggle: enter the historical average margin in the designated cell, and the Income Statement sheet uses that figure instead of the year-by-year projection. You should also consider using a mid-cycle revenue base rather than peak revenue. For commodity businesses, you can link the revenue assumption to a long-run commodity price (e.g., $70/bbl for oil) rather than the spot price, which the Inputs sheet supports via a commodity price override cell.

A sensitivity table and football field chart transform a DCF model into a boardroom-ready investment presentation.
From Template to Professional-Grade Analysis: Next Steps
The EFM DCF template gives you a production-ready valuation model. Once you’ve completed your base case, three actions will elevate it to investment-bank quality.
First, run a football field chart: plot your DCF range alongside comparable company multiples and precedent transaction multiples to show the full valuation spectrum. This is standard in equity research and M&A presentations.
Second, stress-test your WACC. A 100-basis-point increase in WACC typically reduces enterprise value by 10% to 20% for a mature company and 25% to 40% for a high-growth company. Document this in the Sensitivity sheet and include it in your investment memo.
Third, document your assumptions. Every growth rate, margin target, and WACC input should have a written rationale. Investors and boards scrutinize assumptions more than formulas.
For teams that need a full three-statement financial model linked to the DCF, or a startup financial model with integrated cap table and funding rounds, EFM has purpose-built templates for both.
I recommend downloading the EFM DCF valuation model template now and running your first valuation today. It’s the fastest path from a blank spreadsheet to a defensible, presentation-ready DCF.
























































