
0 ITEMS

China’s $170B Beverage Market: 4 Segments to Watch 2026-2031

China’s non-alcoholic beverage manufacturing sector enters 2026 as one of the largest and fastest-reshaping consumer industries on earth, driven simultaneously by a generational health pivot, sweeping new labeling regulations, and a structural channel shift toward instant retail.
Key Takeaways
- The four in-scope sub-segments (bottled water, RTD tea, energy drinks, adult dairy) combine into approximately USD 170 billion of industrial output in 2026, with a Base-case forecast reaching USD 215 billion in the Bull scenario by 2031.
- Sugar-free RTD tea (ready-to-drink tea with ≤0.5 g sugar per 100 mL) grew 60% year-on-year in 2024 Euromonitor and is projected to reach RMB 50-55 billion by 2028, roughly 25-27% of the total RTD tea market.
- Mandatory sugar disclosure under GB 28050-2025 takes full effect on March 16, 2027, forcing a reformulation cliff for every sugared RTD tea, flavored dairy, and sugared functional drink sold in China.
- Eastroc Beverage (Dongpeng Special Drink) holds 43% volume share in energy drinks, overtaking Red Bull, with the top-5 operators controlling roughly 80% of the category.
- Bottled water output reaches 145 billion liters in 2026 at 98% urban household penetration; the Base case projects output growing to 170 billion liters by 2031.
- Instant retail (Meituan Instashopping, Hema 30-minute delivery) is expanding at more than 20% per year and is structurally favorable to challenger brands that avoid modern-trade slotting fees.
- A national sugar-sweetened beverage (SSB) consumption tax of 10-15% retail value is the key Bear-scenario risk for 2027-2029, with the Lancet Public Health (January 2026) modeling study and multiple NHC stakeholder consultations raising its probability.
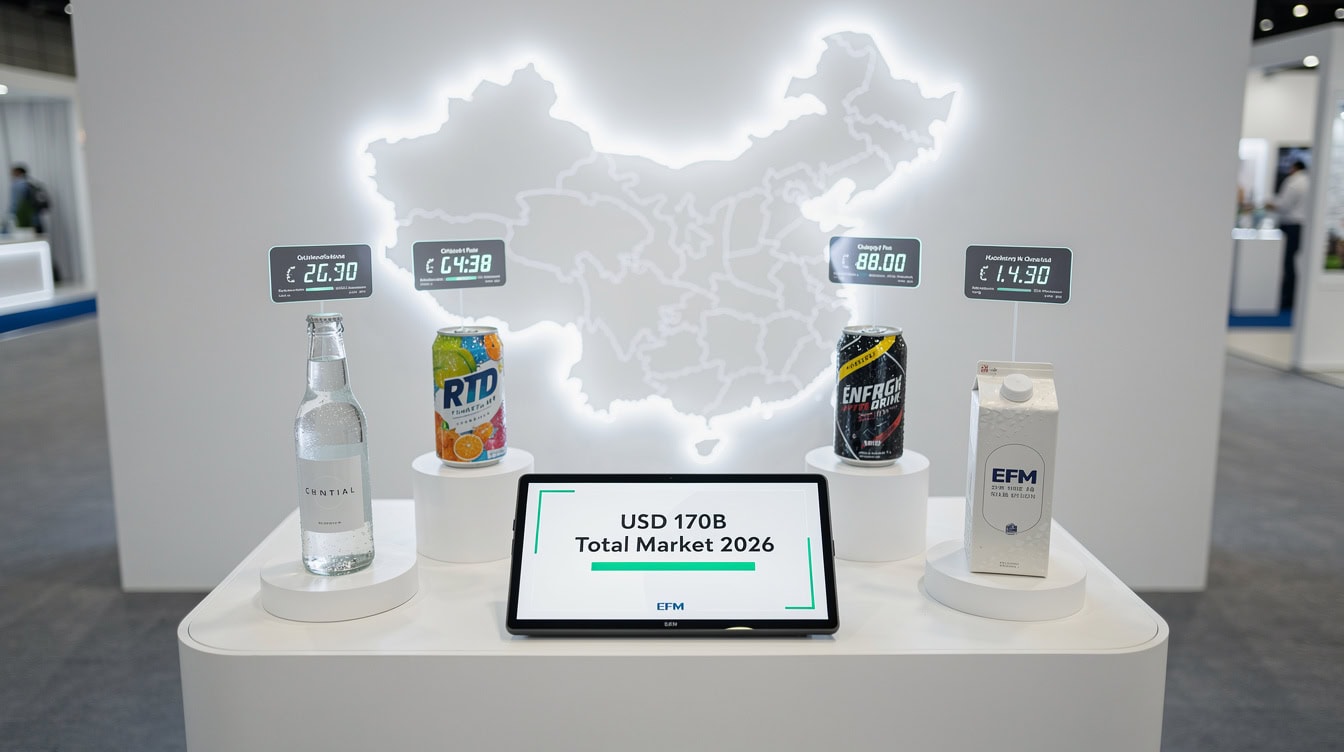
China’s four in-scope beverage sub-segments combine into approximately USD 170 billion of industrial output in 2026, with energy drinks growing fastest at a projected 7.6% CAGR to 2031.
China Beverage Manufacturing: Market Size and Structure
China’s beverage manufacturing complex in 2026 is not one market but four distinct sub-segments with different growth rates, competitive structures, and regulatory exposures. The four sub-segments covered in the China Beverage Manufacturing Market Study 2026-2031 are bottled water, RTD tea, energy and functional drinks, and adult/family dairy (including plant milk).
Bottled water is the largest single sub-segment by volume, reaching an estimated USD 67 billion at retail (USD 27 billion at the production gate per IBISWorld) on 145 billion liters of output in 2026. RTD tea runs at approximately RMB 200 billion retail value (roughly USD 28 billion equivalent). Energy and functional drinks reach USD 12.5 billion in 2026 and are projected to compound at 7.6% annually to USD 18.0 billion by 2031. Adult and family dairy, including plant milk, reaches USD 77 billion in 2026, growing at a blended approximately 4% compound annual growth rate (CAGR), with plant milk pulling above 9% and standard fluid milk closer to 3%.
China’s 1.41 billion population, urbanization rate exceeding 66%, and per-capita disposable income of RMB 39,218 in 2024 (up 5.3% year-on-year, according to China’s National Bureau of Statistics) underpin the structural demand base. Rural per-capita disposable income rose 6.6% year-on-year in 2024, outpacing urban growth of 4.6%, which is narrowing the urban-rural gap and supporting bottom-of-pyramid beverage demand in Tier 4-5 cities.
Sub-Segment Deep Dive: Growth Rates and Competitive Positions
Each of the four sub-segments carries a distinct competitive structure and growth profile. Understanding these differences is essential before allocating capital.
Bottled Water: Defensive Cash Flow with Premium Tailwind
Bottled water is a consolidated, cash-generative category. Nongfu Spring leads with a 20-25% retail value share; the top five operators (Nongfu Spring, China Resources C’estbon, Tingyi Master Kong, Wahaha, and Ganten) capture 55-65% of value. The long tail of 1,000+ registered operators under the GB 19298 packaged drinking water standard accounts for roughly 30% of value.
Price bands define the competitive battleground: mass-market purified water sits at RMB 1.5-2.5 per 500 mL, premium spring or natural water at RMB 3-6 per 500 mL, and ultra-premium imported or specialty water (Tibet 5100, Evian, Perrier) at RMB 8-20 per 500 mL. Capital deployment in this sub-segment is most attractive in premium, sparkling, and functional-water adjacencies rather than mass-market purified water.
RTD Tea: Fastest-Growing, Highest Risk-Adjusted Opportunity
RTD tea is the most dynamic sub-segment. Sugar-free RTD tea grew 60% year-on-year in 2024 Euromonitor and the herbal-wellness “tea water” sub-category (led by Genki Forest’s Haozizai brand, which reached RMB 1 billion in 2024 sales) created a roughly RMB 5 billion sub-category that did not exist in 2020. The sugar-free segment is projected to reach RMB 50-55 billion by 2028, representing 25-27% of the total RTD tea market.
Tingyi (Master Kong) leads with 17-20% retail value share, followed by Uni-President China at 14-17%, Coca-Cola China at 9-11%, and Nongfu Spring at 8-10%. Nongfu Spring’s tea-segment revenue overtook its bottled-water revenue in 2025, a strategic reweighting that signals where the growth is.
Energy Drinks: Duopolizing Concentration Play
Eastroc Beverage (Dongpeng Special Drink) holds 43% volume share in energy drinks, and the top five operators (Eastroc, Red Bull Vitamin Drink Co, Coca-Cola Monster, Warhorse, and Hi-Tiger) control roughly 80% of the category. This duopolizing concentration creates a third-place opportunity for a Tier 1-2 premium challenger or a deep Tier 4-5 value challenger.
Eastroc’s Hainan complex (a 600 million can per year nameplate high-speed canning line requiring approximately USD 80-120 million in capex) and its Indonesia JV (launched February 2026) represent the first export of the lower-tier network playbook to Southeast Asia.
Adult Dairy: Most Policy-Sensitive, Plant Milk is the Growth Engine
Yili Group and Mengniu Dairy together hold approximately 40-50% of fluid-milk and drinking-yogurt revenue. The structural headwind is demographic: China’s 2024 birth rate fell to its lowest recorded level, compressing the school-age cohort and weighing on flavored-milk and drinking-yogurt volumes. Mengniu’s 2025 revenue guidance of -7 to -8% year-on-year reflects this margin compression, driven partly by a raw-milk farmgate price deflation cycle that began in 2023.
The growth engines are plant milk (9.55% CAGR, roughly twice the global plant-milk growth rate, reflecting China’s high lactose-intolerance addressable market) and low-temperature pasteurized fresh milk (Mengniu Daily Fresh and Yili premium fresh both reported growth rates exceeding 20% year-on-year in 2024-2025).
Energy drinks show the strongest relative growth (+44% to USD 18bn by 2031 in the Base case); dairy is the largest absolute market at USD 93bn by 2031.
Regulatory Landscape: The 2027 Reformulation Cliff
The single most consequential regulatory event for China beverage manufacturing in the 2026-2031 window is the simultaneous implementation of two mandatory national standards on March 16, 2027.
GB 28050-2025 (Nutrition Labeling of Prepackaged Foods) moves sugar and saturated fat from voluntary to mandatory front-of-pack disclosure under a “1+6” labeling scheme and adds the warning: “Children and adolescents should avoid excessive intake of salt, oil, and sugar.” GB 7718-2025 (General Rules for the Labeling of Prepackaged Foods) updates the general labeling framework. Both standards were promulgated jointly by China’s National Health Commission (NHC) and the State Administration for Market Regulation (SAMR) on March 27, 2025.
For producers, this creates a hard reformulation deadline. Any SKU that will carry the child-targeted warning label from March 2027 onward needs a reformulation roadmap now. The Lancet Public Health published a modeling study in January 2026 estimating the public-health impact of a 10-15% retail-value SSB (sugar-sweetened beverage) excise tax in China; multiple NHC stakeholder consultations have occurred since 2024. A national SSB tax has not been enacted as of mid-2026, but it is the key Bear-scenario risk for 2027-2029.
The Extended Producer Responsibility (EPR) framework under China’s Solid Waste Law (2020), with its 2025 implementation milestone targeting a 50% recycling rate and 20% recycled raw-material content, adds approximately RMB 0.03-0.08 per 500-mL PET bottle in the 2027-2030 window depending on the scenario. PET (polyethylene terephthalate) is the dominant packaging material for bottled water, RTD tea, energy drinks, and plant milk.
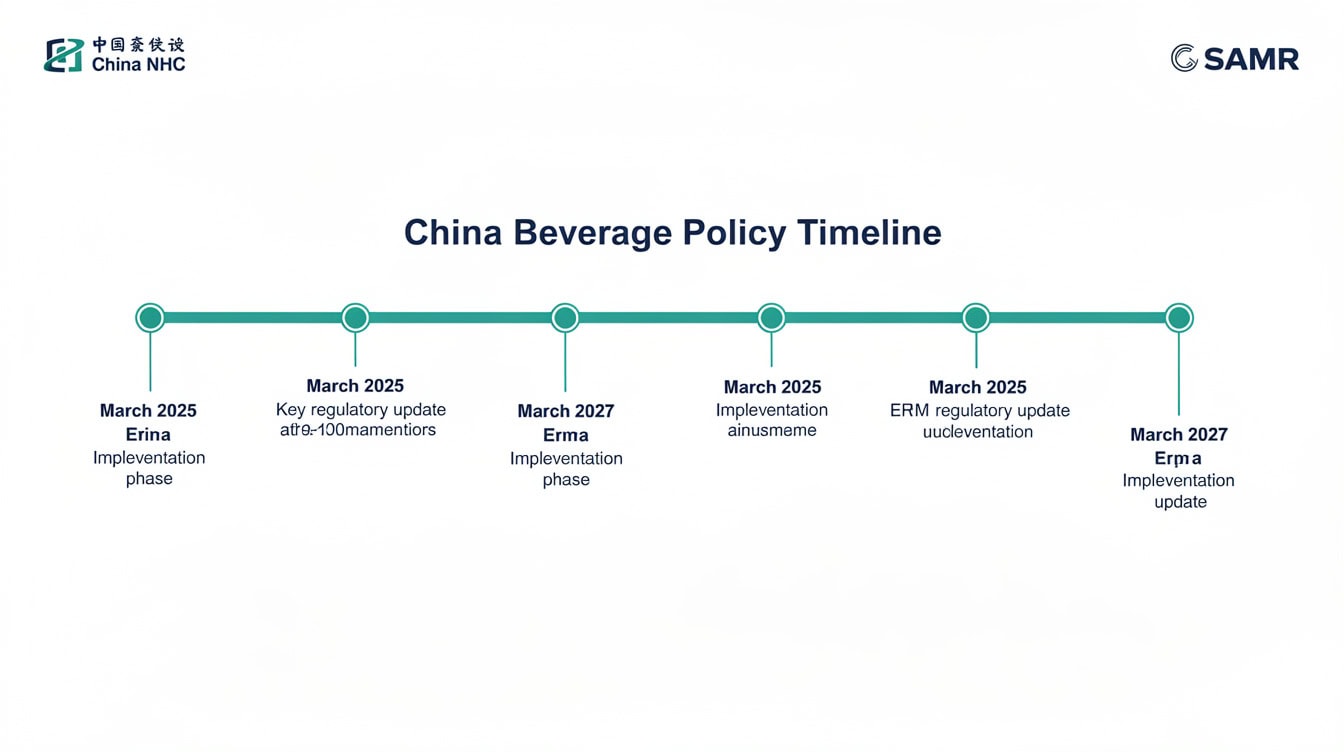
The March 16, 2027 effective date for GB 28050-2025 is the single most consequential regulatory deadline for China beverage producers in the 2026-2031 window.
Three Scenarios: Base, Bear, and Bull to 2031
The study brackets the 2031 outlook with three probability-weighted scenarios. Each scenario assigns different assumptions to the SSB tax, GDP growth, EPR rPET content requirements, and dairy birth-rate drag.
| Scenario | Probability | SSB Tax | Bottled Water Output 2031 | RTD Tea Value 2031 | Energy Drinks 2031 | Dairy 2031 |
|---|---|---|---|---|---|---|
| Base | 60% | None through 2031 | 170 bn liters | RMB 270 bn | USD 18 bn | USD 93 bn |
| Bear | 25% | 10-15% excise 2027-2029 | Below base | Sugared RTD -25% vol | Below base | Fluid milk -8% vol |
| Bull | 15% | None; faster premium up-trade | Above base | RMB 300+ bn | Above base | USD 215 bn total basket |
The Base case (60% probability) assumes no national SSB tax through 2031, full GB 28050-2025 reformulation implementation from March 2027 driving sugared RTD tea volume into structural -3 to -5% year-on-year contraction, GDP growth at 4.0-4.5%, RMB averaging 7.1 per USD, and Eastroc reaching approximately 50% energy-drink volume share by 2031.
The 16-percentage-point gross margin spread between Bear and Bull scenarios on bottled water alone illustrates the stakes of the SSB tax and EPR cost assumptions.
Worked Example: Bottled Water Gross Margin Sensitivity
Here’s the math on how EPR cost layering affects operator gross margin for a standard 500 mL purified water bottle at a RMB 2.00 shelf price.
In the Base case, PET resin costs RMB 6,800 per tonne, the rPET (recycled PET) cost premium is RMB 1,500 per tonne, and the EPR fee adds RMB 0.05 per bottle. The operator gross margin lands at 38%.
In the Bear case, PET resin rises to RMB 8,200 per tonne (a global resin shock), the rPET premium widens to RMB 2,200 per tonne, and the EPR fee reaches RMB 0.08 per bottle. Gross margin compresses to 28%, a 10-percentage-point swing from Base.
In the Bull case, PET resin falls to RMB 6,200 per tonne, the rPET premium narrows to RMB 800 per tonne as recycled-content capacity scales, and the EPR fee is only RMB 0.03 per bottle. Gross margin expands to 44%.
The 16-percentage-point spread between Bear and Bull gross margins (28% vs 44%) on a single commodity-packaging input illustrates why rPET supply-chain investment and long-term supplier contracts are a first-order strategic priority for any bottled-water or RTD-tea operator in this window.
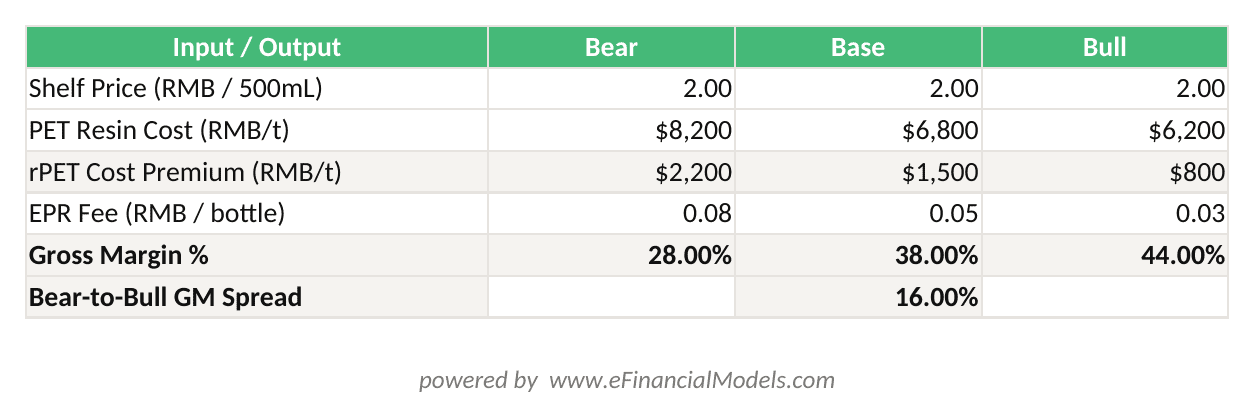
Gross margin swings 16 percentage points (28% Bear to 44% Bull) on a RMB 2.00 shelf-price 500mL bottle, driven by PET resin cost and EPR fee assumptions.
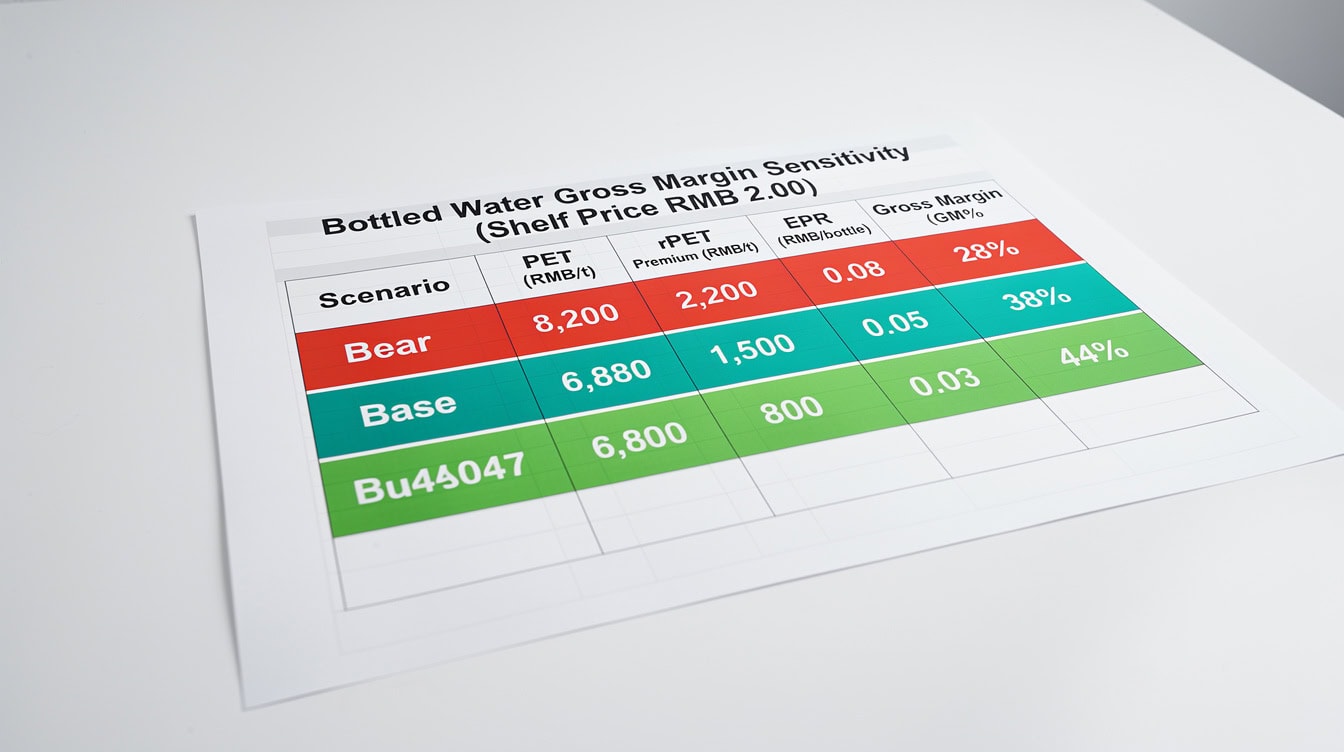
A global PET resin shock combined with tighter EPR fees compresses bottled-water operator gross margin from 44% (Bull) to 28% (Bear) on the same RMB 2.00 shelf price.
Supply-Side Capacity: Who Is Building What
China’s bottled-water bottling capacity sits at approximately 180 billion liters of nameplate output across 1,000+ manufacturing establishments, with utilization running at 75-82% in 2025. The five largest operators by estimated capex in 2024-2026 are:
| Rank | Operator | Capex 2024-2026 (USD m, est.) | Strategic Theme |
|---|---|---|---|
| 1 | Yili Group | ~3,500 | Low-temp pasteurized milk + plant milk + overseas |
| 2 | Mengniu Dairy | ~2,800 | Daily Fresh capacity + functional dairy + plant milk |
| 3 | Nongfu Spring | ~1,200 | Bottled water + tea capacity expansion |
| 4 | Tingyi (Master Kong) | ~900 | RTD tea capacity + bottled water rejuvenation |
| 5 | Eastroc Beverage | ~600 | Hainan complex + lower-tier channel + Indonesia JV |
Source: eFinancialModels Research analysis based on operator public disclosures and trade press. Capex figures are approximate ranges; per-operator variance ±15-25%.
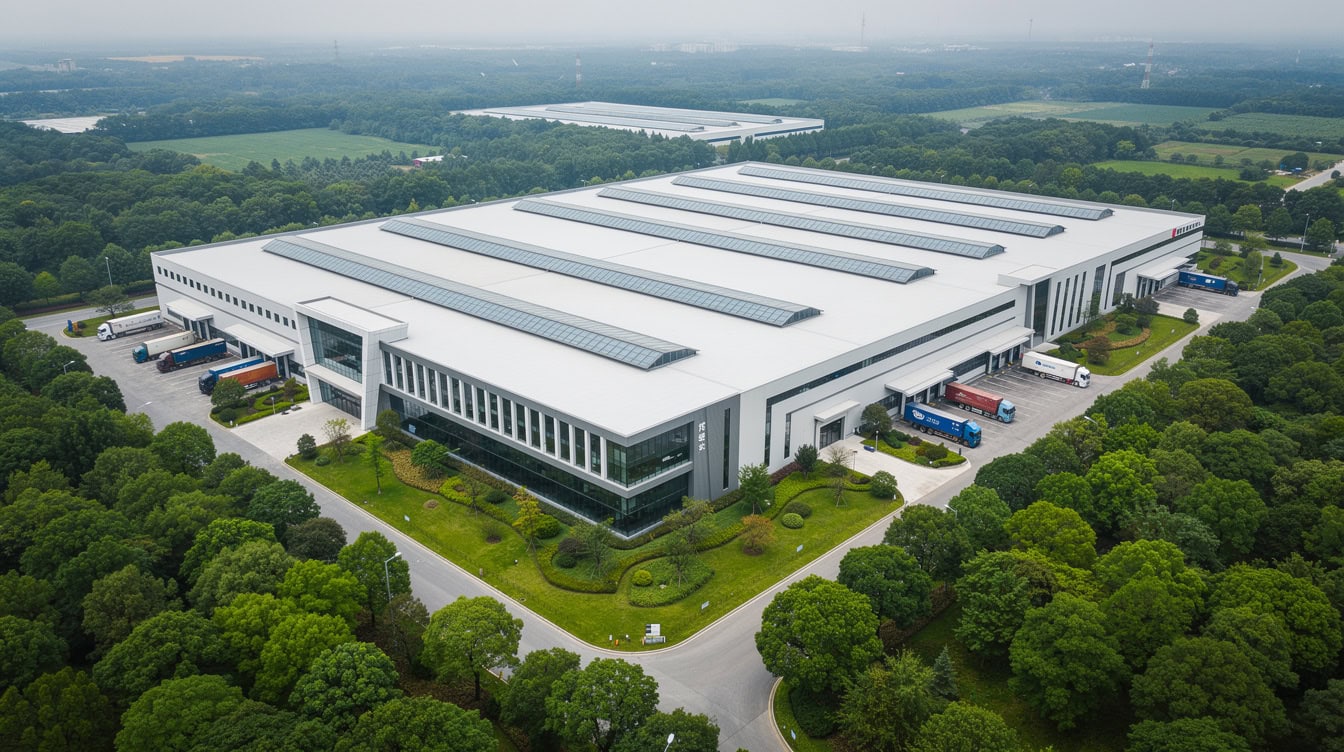
A greenfield bottling complex with 1.5 billion liters per year of nameplate capacity in coastal East China requires approximately USD 250-400 million over a 24-30 month construction cycle. Per-liter capex sits at approximately RMB 1.2-1.9 per liter of annual capacity. Genki Forest’s Tianjin gigafactory is the most significant single-site investment in the RTD-tea and functional-water category since 2020.
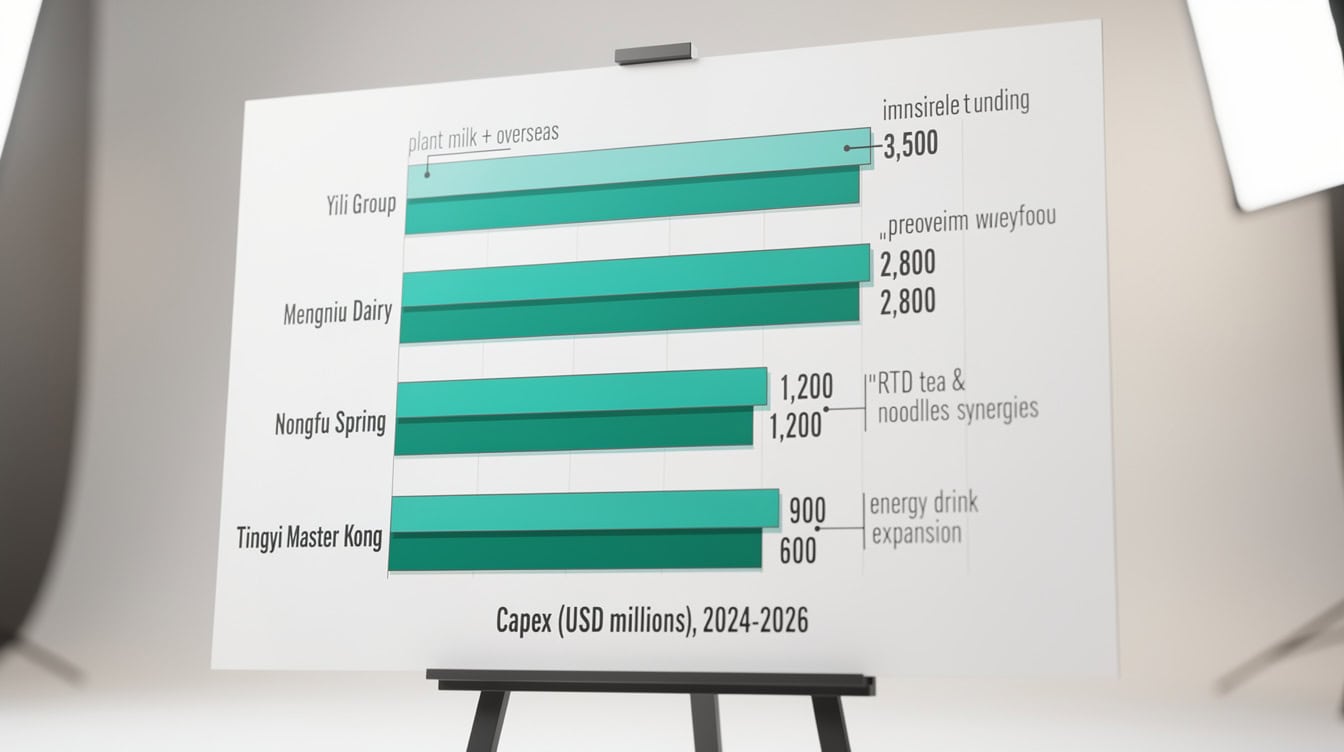
Yili and Mengniu together account for over USD 6 billion of the top-5 capex total, reflecting the scale of investment required to pivot toward low-temperature pasteurized milk and plant milk.
Channel Mix and the Instant Retail Shift
The off-trade channel in 2025 breaks down approximately as follows for the in-scope basket: traditional offline (hypermarkets, supermarkets, convenience stores) at roughly 42%; e-commerce platforms (Tmall, JD, Pinduoduo, Douyin Shop) at 22%; instant retail (Meituan Instashopping, JD Daojia, Hema 30-minute delivery) at 14%; modern offline (Hema/Freshippo, Sam’s Club China, Costco China) at 10%; on-trade and HoReCa (hotel, restaurant, café) at 8%; and KA/corporate/institutional at 4%.
Instant retail is the fastest-growing channel, expanding at more than 20% per year. Premium SKUs sell at full margin via Meituan and Hema without modern-trade slotting fees, which is structurally favorable to challenger brands. Tier 4-5 and rural demand is increasingly digital-channel-driven, with Pinduoduo and Meituan Instashopping penetration accelerating in Central and West China.
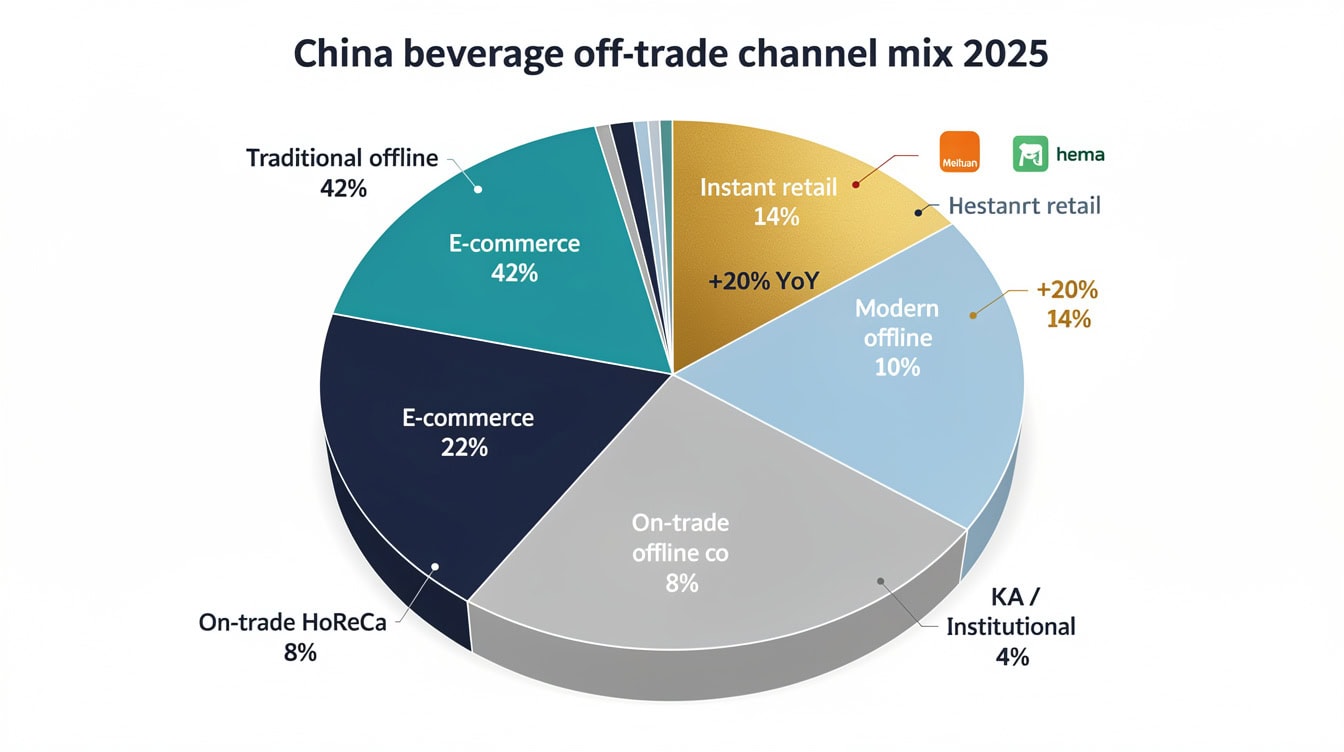
Instant retail at 14% share and growing 20%+ per year is reshaping brand-to-shelf economics, enabling premium SKUs to sell at full margin without modern-trade slotting fees.
Common Mistakes Investors and Operators Make in This Market
Five analytical errors consistently distort investment decisions in China beverage manufacturing.
Mistake 1: Treating RTD tea as a single market. Sugared RTD tea and sugar-free RTD tea are on opposite trajectories. Sugared volume faces -3 to -5% annual contraction from 2027 under Base; sugar-free compounds at 30%+ off a now-large base. Blending them into one growth rate produces a misleading average.
Mistake 2: Ignoring the rPET cost curve. EPR compliance is not a one-time cost. The 20% recycled-content requirement in 2025 steps toward 30% by 2030, and the rPET cost premium (RMB 1,500 per tonne in Base) is sensitive to global recycled-material capacity. Operators without long-term rPET supply contracts face margin volatility.
Mistake 3: Underweighting the birth-rate drag on dairy. China’s 2024 birth rate hit its lowest recorded level. The school-age cohort is contracting structurally, not cyclically. Flavored-milk and drinking-yogurt volume forecasts that assume a return to historical growth rates are wrong without a plant-milk or premium-fresh offset.
Mistake 4: Conflating Tier-1 and Tier 4-5 demand dynamics. Tier-1 cities (Beijing, Shanghai, Guangzhou, Shenzhen) carry 12% of population but 24% of in-scope beverage value spend, with 52% of consumers preferring premium imported beverages. Tier 4-5 demand is anchored on sub-RMB-2 bottled water and RMB 3-4 energy drinks. A single national pricing strategy fails both.
Mistake 5: Assuming the SSB tax is off the table. A national SSB tax has not been enacted as of mid-2026, but the Lancet Public Health January 2026 modeling study and multiple NHC stakeholder consultations make a 10-15% retail-value excise a credible Bear-scenario outcome. Cash-flow models that do not stress-test this scenario are incomplete.
Three high-severity risks dominate the 2026-2031 window: mandatory sugar disclosure, a potential SSB excise tax, and structural demographic decline in dairy demand.
Tools and Templates for Beverage Manufacturing Analysis
Analysts and corporate-strategy teams working through the sub-segment economics in this study need purpose-built financial models. The Beverage Manufacturing Start-Up Financial Model covers sub-segment cash-flow modeling for RTD tea and energy drinks. The Product Manufacturing Business Model handles multi-SKU capex and margin analysis. For upstream dairy economics, the Manufacturing Cost and Profit per Unit template provides the unit-economics framework. The Manufacturing 5-Year Template with Customer Repurchase Rate Logic is well-suited to modeling Eastroc-style lower-tier channel expansion with repeat-purchase dynamics.
For market-study context across other geographies and industries, the EFM Market Studies library provides comparable research packages.

MNC corporate-strategy and PE/VC teams are the primary audience for sub-segment analysis in China’s beverage manufacturing market, where asymmetric capital-deployment profiles require segment-level modeling.
Frequently Asked Questions
<script type=”application/ld+json”>
{
“@context”: “https://schema.org”,
“@type”: “FAQPage”,
“mainEntity”: [
{
“@type”: “Question”,
“name”: “How large is China’s beverage manufacturing market in 2026?”,
“acceptedAnswer”: {
“@type”: “Answer”,
“text”: “China’s four in-scope beverage sub-segments (bottled water, RTD tea, energy drinks, and adult dairy including plant milk) combine into approximately USD 170 billion of industrial output in 2026. Bottled water alone reaches USD 67 billion at retail on 145 billion liters of output, with 98% urban household penetration. RTD tea runs at approximately RMB 200 billion retail value (roughly USD 28 billion). Energy and functional drinks reach USD 12.5 billion. Adult and family dairy reaches USD 77 billion. These figures come from the eFinancialModels Research analysis drawing on IBISWorld, Euromonitor, and operator public disclosures.”
}
},
{
“@type”: “Question”,
“name”: “What is GB 28050-2025 and why does it matter for beverage producers?”,
“acceptedAnswer”: {
“@type”: “Answer”,
“text”: “GB 28050-2025 is China’s updated National Food Safety Standard for Nutrition Labeling of Prepackaged Foods, promulgated jointly by the National Health Commission and SAMR on March 27, 2025, taking full effect on March 16, 2027. It moves sugar and saturated fat from voluntary to mandatory front-of-pack disclosure under a ‘1+6’ labeling scheme and adds a child-targeted warning: ‘Children and adolescents should avoid excessive intake of salt, oil, and sugar.’ For beverage producers, this creates a hard reformulation deadline. Any SKU carrying the warning label from March 2027 onward needs a reformulation roadmap now. Sugar-free is defined as ≤0.5 g sugar per 100 mL under GB 28050 thresholds. Producers that fail to reformulate face both regulatory risk and consumer-preference headwinds as health-conscious Gen Z and millennial shoppers migrate to sugar-free alternatives.”
}
},
{
“@type”: “Question”,
“name”: “Which energy drink company leads the Chinese market and by how much?”,
“acceptedAnswer”: {
“@type”: “Answer”,
“text”: “Eastroc Beverage (Dongpeng Special Drink, listed as 300054.SZ) holds 43% volume share in China’s energy drink market as of 2025, overtaking Red Bull Vitamin Drink Co, which holds 17-20%. The top five operators (Eastroc, Red Bull, Coca-Cola Monster, Warhorse, and Hi-Tiger) control roughly 80% of the category. Eastroc’s dominance is built on a lower-tier city distribution network reaching 3.6 million retail outlets and a price point of RMB 3-4 per 250 mL can in Tier 4-5 channels. The company listed on the Shanghai Stock Exchange in May 2025 and launched a production JV in Indonesia in February 2026, marking the first export of the lower-tier network playbook to Southeast Asia.”
}
},
{
“@type”: “Question”,
“name”: “What is the outlook for plant-based dairy in China through 2031?”,
“acceptedAnswer”: {
“@type”: “Answer”,
“text”: “Plant milk in China is growing at a 9.55% CAGR, roughly twice the global plant-milk growth rate, reflecting the large lactose-intolerance addressable market in China. The total plant-milk sub-segment reached USD 5-6 billion in 2026. Key operators include Yili Group (Plant Select), Mengniu Dairy (Plant Pioneer), Vitasoy (soy-milk leader with 15-20% share), and Oatly (oat-milk leader in the premium imported segment). The demographic drag on traditional flavored milk and drinking yogurt (driven by China’s record-low 2024 birth rate) is structurally favorable to plant milk as a volume offset. JV and minority-equity opportunities exist with plant-milk specialists and regional premium-dairy operators. The Bull case projects plant milk capturing a materially larger share of the USD 93 billion dairy basket by 2031.”
}
},
{
“@type”: “Question”,
“name”: “How does the instant retail channel change the economics for beverage brands?”,
“acceptedAnswer”: {
“@type”: “Answer”,
“text”: “Instant retail (Meituan Instashopping, JD Daojia, Hema 30-minute delivery, Ele.me) accounted for approximately 14% of the in-scope beverage basket in 2025 and is growing at more than 20% per year, making it the fastest-growing channel. The structural advantage for brands is that premium SKUs sell at full margin via Meituan and Hema without the modern-trade slotting fees that hypermarkets and supermarkets charge. For a challenger brand with a RMB 8-10 premium RTD tea SKU, avoiding a 15-25% slotting-fee drag on margin is material. This channel also enables faster new-product launches and real-time demand sensing. Brands that build instant-retail operational capability (cold-chain integration, SKU rationalization for 30-minute delivery windows) gain a structural cost and speed advantage over traditional-channel-only competitors.”
}
},
{
“@type”: “Question”,
“name”: “What are the three scenario outcomes for China’s beverage market by 2031?”,
“acceptedAnswer”: {
“@type”: “Answer”,
“text”: “The Base case (60% probability) projects bottled-water industrial output reaching 170 billion liters (+17% vs 2026), RTD tea reaching RMB 270 billion (+35%), energy drinks reaching USD 18 billion (+44%), and adult dairy reaching USD 93 billion (+21%). The Bear case (25% probability) layers a 10-15% national SSB excise tax in 2027-2029, a sharper birth-rate drag on dairy, and a global PET-resin shock; sugared RTD tea volume contracts 25% and fluid-milk volume declines 8%. The Bull case (15% probability) assumes no SSB tax, faster premium up-trade in dairy (low-temperature pasteurized milk capturing 35% of fluid-milk value by 2031), and rapid Tier 4-5 expansion of energy and functional drinks, with the total in-scope basket reaching USD 215 billion in 2031.”
}
},
{
“@type”: “Question”,
“name”: “What capex does a greenfield bottled-water plant require in China?”,
“acceptedAnswer”: {
“@type”: “Answer”,
“text”: “A greenfield bottling complex with 1.5 billion liters per year of nameplate capacity in coastal East China requires approximately USD 250-400 million (RMB 1.8-2.9 billion) over a 24-30 month construction cycle. The cost breaks down roughly as: 35% process equipment (PET preform, aseptic filling, blow-molding lines), 25% civil works, 15% utilities and clean-in-place systems, 15% warehouse and automated palletizing, 5% R&D and lab, and 5% contingency. Per-liter capex sits at approximately RMB 1.2-1.9 per liter of annual capacity. An energy-drink high-speed canning line at 600 million cans per year requires approximately USD 80-120 million, dominated by aluminum-can fillers and sterilization tunnels. A 100,000-tonne per year low-temperature pasteurized milk complex requires approximately USD 150-250 million plus USD 50-80 million for cold-chain logistics buildout.”
}
}
]
}
</script>
How large is China’s beverage manufacturing market in 2026?
China’s four in-scope beverage sub-segments (bottled water, RTD tea, energy drinks, and adult dairy including plant milk) combine into approximately USD 170 billion of industrial output in 2026. Bottled water alone reaches USD 67 billion at retail on 145 billion liters of output, with 98% urban household penetration. RTD tea runs at approximately RMB 200 billion retail value (roughly USD 28 billion). Energy and functional drinks reach USD 12.5 billion. Adult and family dairy reaches USD 77 billion. These figures come from the eFinancialModels Research analysis drawing on IBISWorld, Euromonitor, and operator public disclosures.
What is GB 28050-2025 and why does it matter for beverage producers?
GB 28050-2025 is China’s updated National Food Safety Standard for Nutrition Labeling of Prepackaged Foods, promulgated jointly by the National Health Commission and SAMR on March 27, 2025, taking full effect on March 16, 2027. It moves sugar and saturated fat from voluntary to mandatory front-of-pack disclosure under a “1+6” labeling scheme and adds a child-targeted warning: “Children and adolescents should avoid excessive intake of salt, oil, and sugar.” For beverage producers, this creates a hard reformulation deadline. Any SKU carrying the warning label from March 2027 onward needs a reformulation roadmap now. Sugar-free is defined as ≤0.5 g sugar per 100 mL under GB 28050 thresholds. Producers that fail to reformulate face both regulatory risk and consumer-preference headwinds as health-conscious Gen Z and millennial shoppers migrate to sugar-free alternatives.
Which energy drink company leads the Chinese market and by how much?
Eastroc Beverage (Dongpeng Special Drink, listed as 300054.SZ) holds 43% volume share in China’s energy drink market as of 2025, overtaking Red Bull Vitamin Drink Co, which holds 17-20%. The top five operators (Eastroc, Red Bull, Coca-Cola Monster, Warhorse, and Hi-Tiger) control roughly 80% of the category. Eastroc’s dominance is built on a lower-tier city distribution network reaching 3.6 million retail outlets and a price point of RMB 3-4 per 250 mL can in Tier 4-5 channels. The company listed on the Shanghai Stock Exchange in May 2025 and launched a production JV in Indonesia in February 2026, marking the first export of the lower-tier network playbook to Southeast Asia.
What is the outlook for plant-based dairy in China through 2031?
Plant milk in China is growing at a 9.55% CAGR, roughly twice the global plant-milk growth rate, reflecting the large lactose-intolerance addressable market in China. The total plant-milk sub-segment reached USD 5-6 billion in 2026. Key operators include Yili Group (Plant Select), Mengniu Dairy (Plant Pioneer), Vitasoy (soy-milk leader with 15-20% share), and Oatly (oat-milk leader in the premium imported segment). The demographic drag on traditional flavored milk and drinking yogurt (driven by China’s record-low 2024 birth rate) is structurally favorable to plant milk as a volume offset. JV and minority-equity opportunities exist with plant-milk specialists and regional premium-dairy operators. The Bull case projects plant milk capturing a materially larger share of the USD 93 billion dairy basket by 2031.
How does the instant retail channel change the economics for beverage brands?
Instant retail (Meituan Instashopping, JD Daojia, Hema 30-minute delivery, Ele.me) accounted for approximately 14% of the in-scope beverage basket in 2025 and is growing at more than 20% per year, making it the fastest-growing channel. The structural advantage for brands is that premium SKUs sell at full margin via Meituan and Hema without the modern-trade slotting fees that hypermarkets and supermarkets charge. For a challenger brand with a RMB 8-10 premium RTD tea SKU, avoiding a 15-25% slotting-fee drag on margin is material. This channel also enables faster new-product launches and real-time demand sensing. Brands that build instant-retail operational capability (cold-chain integration, SKU rationalization for 30-minute delivery windows) gain a structural cost and speed advantage over traditional-channel-only competitors.
What are the three scenario outcomes for China’s beverage market by 2031?
The Base case (60% probability) projects bottled-water industrial output reaching 170 billion liters (+17% vs 2026), RTD tea reaching RMB 270 billion (+35%), energy drinks reaching USD 18 billion (+44%), and adult dairy reaching USD 93 billion (+21%). The Bear case (25% probability) layers a 10-15% national SSB excise tax in 2027-2029, a sharper birth-rate drag on dairy, and a global PET-resin shock; sugared RTD tea volume contracts 25% and fluid-milk volume declines 8%. The Bull case (15% probability) assumes no SSB tax, faster premium up-trade in dairy (low-temperature pasteurized milk capturing 35% of fluid-milk value by 2031), and rapid Tier 4-5 expansion of energy and functional drinks, with the total in-scope basket reaching USD 215 billion in 2031.
What capex does a greenfield bottled-water plant require in China?
A greenfield bottling complex with 1.5 billion liters per year of nameplate capacity in coastal East China requires approximately USD 250-400 million (RMB 1.8-2.9 billion) over a 24-30 month construction cycle. The cost breaks down roughly as: 35% process equipment (PET preform, aseptic filling, blow-molding lines), 25% civil works, 15% utilities and clean-in-place systems, 15% warehouse and automated palletizing, 5% R&D and lab, and 5% contingency. Per-liter capex sits at approximately RMB 1.2-1.9 per liter of annual capacity. An energy-drink high-speed canning line at 600 million cans per year requires approximately USD 80-120 million, dominated by aluminum-can fillers and sterilization tunnels. A 100,000-tonne per year low-temperature pasteurized milk complex requires approximately USD 150-250 million plus USD 50-80 million for cold-chain logistics buildout.
Conclusion
China’s beverage manufacturing market in 2026-2031 is not a single growth story. It’s four distinct sub-segments with asymmetric risk-return profiles, a hard regulatory deadline in March 2027, and a channel revolution that rewards brands with instant-retail capability. Sugar-free RTD tea is the highest risk-adjusted growth opportunity. Bottled water is the defensive cash-flow anchor. Energy drinks are consolidating around Eastroc’s lower-tier playbook. Dairy’s value is migrating to plant milk and low-temperature pasteurized fresh milk as demographic headwinds compress traditional volumes.
I recommend downloading the full China Beverage Manufacturing Market Study 2026-2031 from eFinancialModels to access the complete sub-segment recommendation matrices, scenario sensitivity tables, competitive landscape data, and the Appendix A pricing-model assumptions that underpin the unit-economics analysis in this article.























































