0 ITEMS

Cap Table and Dilution: A Founder’s Step-by-Step Guide

A cap table is the table that lists who owns how many shares of a company, and dilution is the fall in each existing holder’s ownership percentage when new shares are issued. In the illustrative example below, a founder who starts as the only shareholder holds 28.57 percent after a seed round and a Series A (22.86 percent if an option pool is also created), and every step of the Excel method behind those numbers is shown.
Key Takeaways
- Ownership equals a holder’s shares divided by total shares, so every new share issued lowers the percentage of every holder who does not buy in.
- Pre-money valuation equals fully diluted pre-round shares, including any new option pool, times the price per share, and post-money valuation adds the money raised.
- In the illustrative example, the founder falls from 66.67 to 28.57 percent after the Series A, or 22.86 percent with a 375,000-share option pool.
- An option pool added before the round lowers the price per share, so existing holders, not the new investor, absorb that dilution.
- Model the pool, pro rata rights, a down round, liquidation preferences and the 409A value in separate scenario tabs before signing a term sheet.
A Cap Table Shows Who Owns the Company and Who Is Paid First
A cap table lists the shares held by each party, and the option pool, the block of shares reserved for future employee grants, has its own line on a cap table. Ownership percentage sets voting power on matters that go to a shareholder vote. Liquidation preferences, the amounts preferred investors collect before common holders in a sale, decide who is paid first, and senior series are paid before junior ones. The pool changes every percentage, because fully diluted shares, the count investors use to set the price, include every share that exists or could exist once options are exercised.
Common mistakes are dividing by issued shares when investors use fully diluted shares, leaving the pool out of the pre-round count, skipping updates after grants, and keeping a file that records no change history. The eFinancialModels cap table templates page lists ready-made spreadsheets.
According to a September 2025 industry interview, founders in a priced seed and a priced Series A are still selling 20 percent or so of the business in each round.
A January 2025 legal guide gives a typical Series A option pool of 15 to 20 percent of fully diluted shares after the financing.
Worked Example: One Seed Round and One Series A
All figures in this worked example are illustrative assumptions in dollars. Assume a founder holds 1,000,000 shares at formation, no options or pool exist yet, the seed round issues 500,000 shares at 2.00, and the Series A issues 2,000,000 shares at 5.00. Wilson Sonsini states that price per share equals pre-money valuation divided by fully diluted pre-money shares, and AngelList adds that pre-money valuation equals post-money valuation minus the investment amount, which gives the same figure.
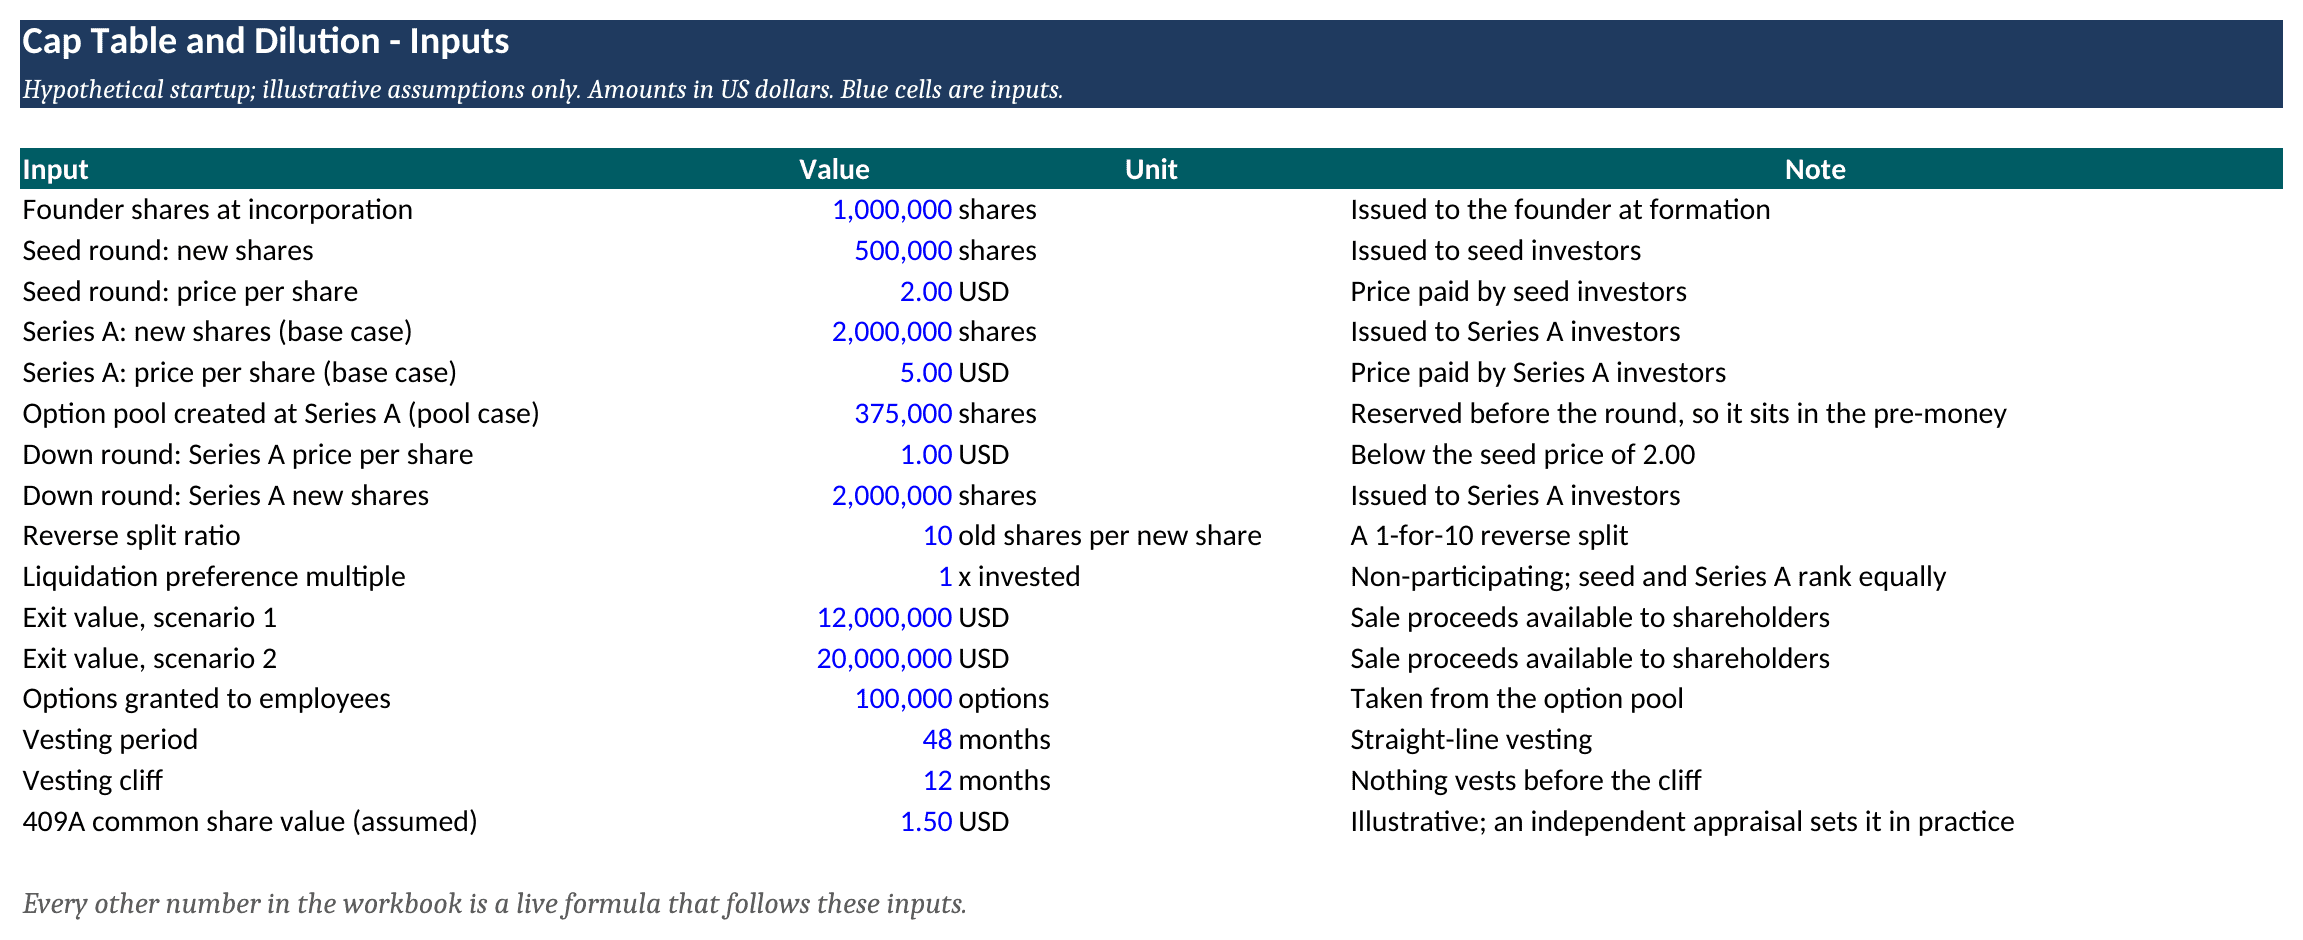
All assumptions sit on one input sheet, so changing a share count or a price updates every scenario. Source: eFinancialModels Analysis
| Round | Pre-money | Raised | Post-money | Founder | Seed investors | Series A investors |
|---|---|---|---|---|---|---|
| Formation | n/a | n/a | n/a | 100.00% | 0.00% | 0.00% |
| Seed: 500,000 shares at 2.00 | 2,000,000 | 1,000,000 | 3,000,000 | 66.67% | 33.33% | 0.00% |
| Series A: 2,000,000 shares at 5.00 | 7,500,000 | 10,000,000 | 17,500,000 | 28.57% | 14.29% | 57.14% |
In the seed round, the 1,000,000 fully diluted shares before the round times 2.00 give a pre-money valuation of 2,000,000, and the 1,500,000 shares then outstanding give a post-money valuation of 3,000,000. In the Series A, the same 1,500,000 fully diluted shares times 5.00 give 7,500,000 pre-money, and 3,500,000 shares give 17,500,000 post-money. The founder’s 1,000,000 shares are 66.67 percent of 1,500,000 and 28.57 percent of 3,500,000, a loss of 38.10 percentage points.
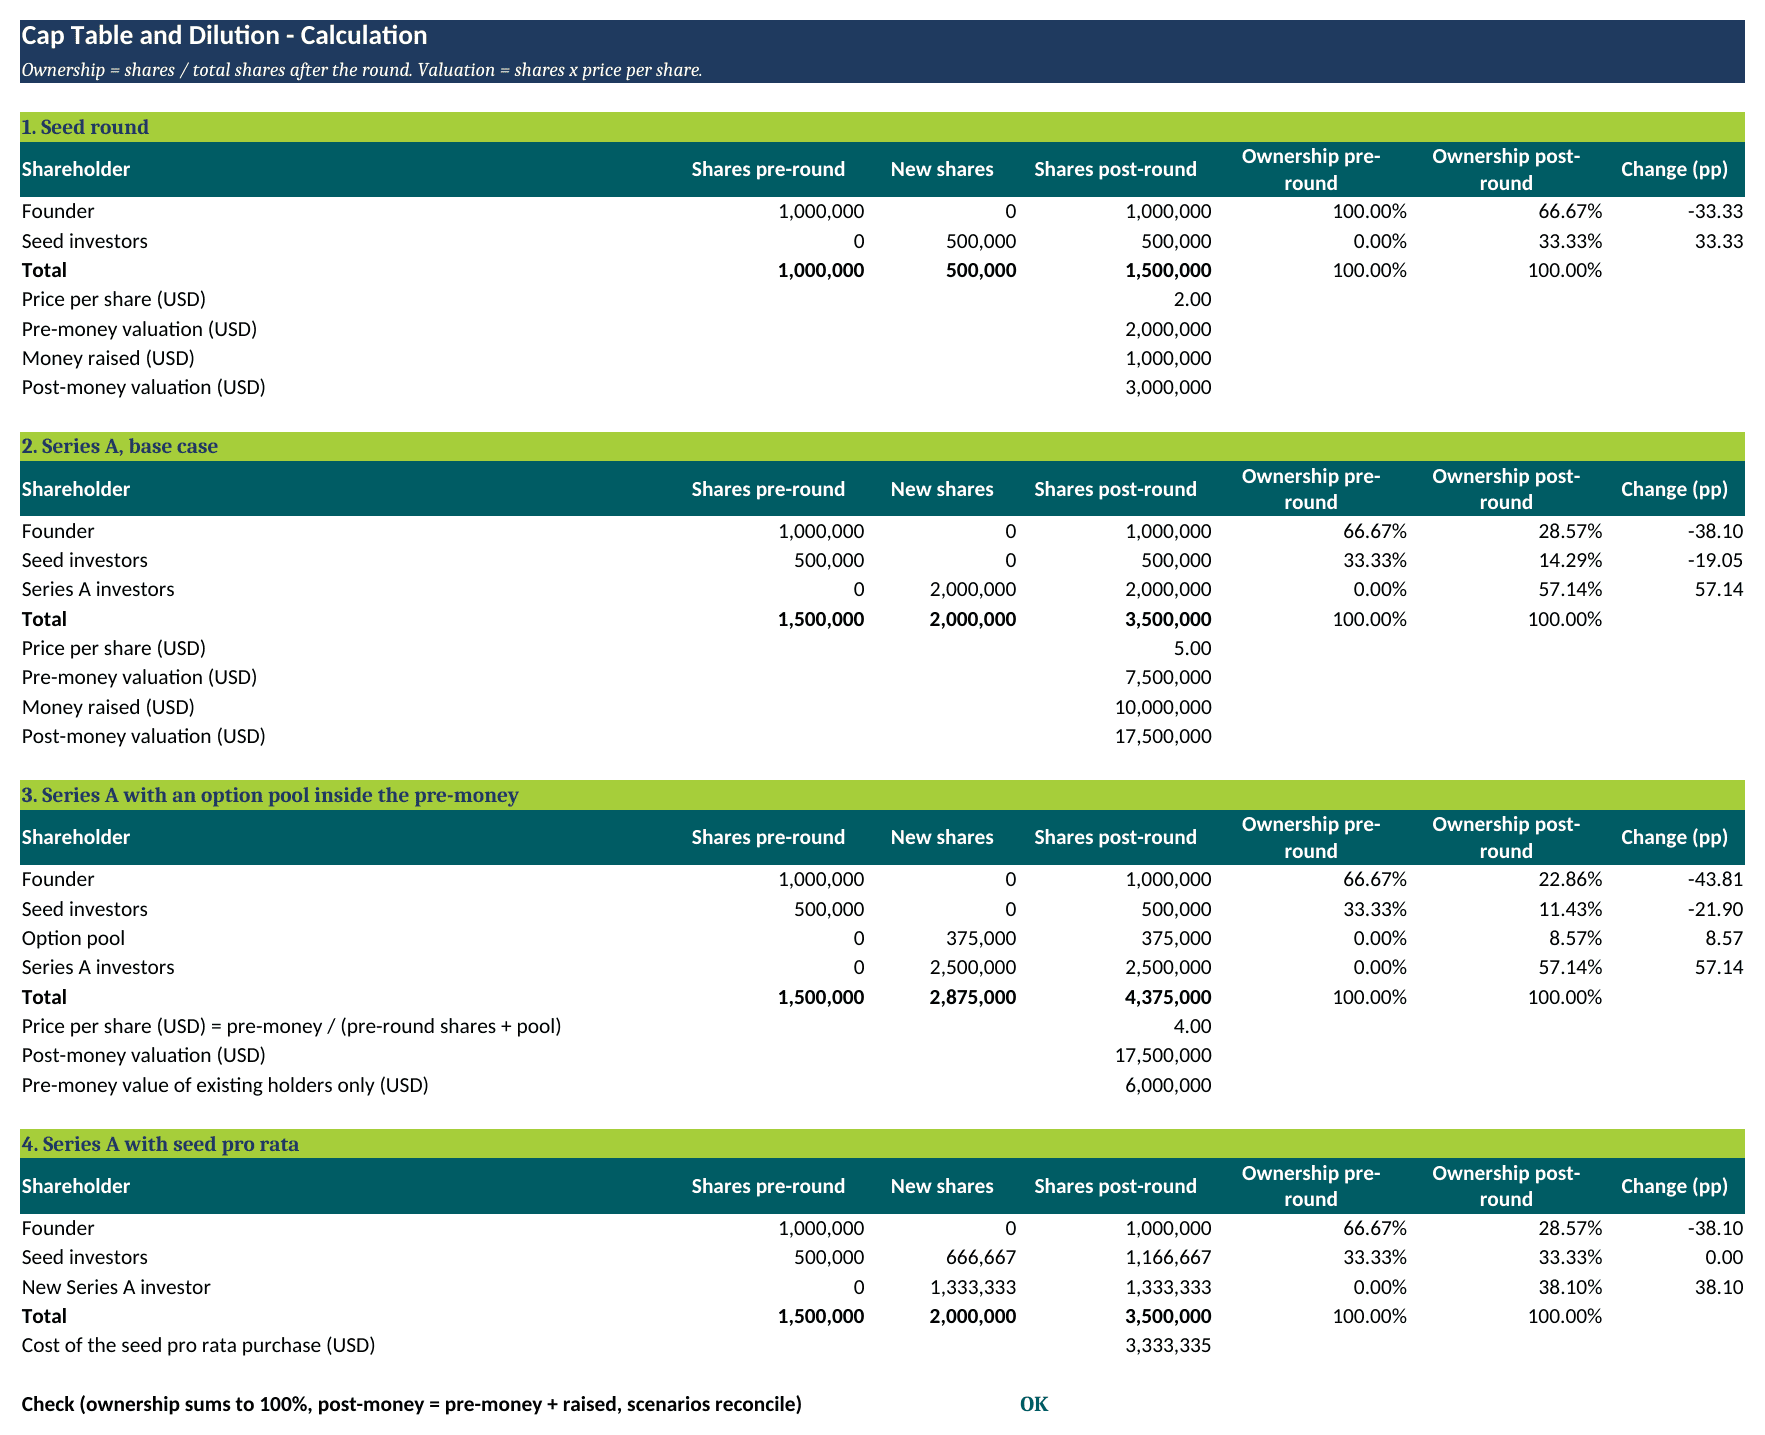
Each block shows shares before and after the round, ownership and the change in percentage points. Source: eFinancialModels Analysis
Scenario Results: Option Pool, Pro Rata and a Down Round
Option pool in the pre-money. The price per share uses the fully diluted count, so options reserved just before the financing sit in the pre-money. Assume the Series A investors require a 375,000-share pool and keep the 7,500,000 pre-money valuation. Fully diluted pre-money shares become 1,875,000 (1,500,000 plus the 375,000 pool), so the price falls to 4.00 (7,500,000 divided by 1,875,000), the 10,000,000 buys 2,500,000 shares and the total is 4,375,000. The founder owns 22.86 percent, the pool 8.57 percent and the Series A 57.14 percent. At 4.00 the existing 1,500,000 shares are worth 6,000,000, so the 375,000 pool shares absorb 1,500,000 of the headline 7,500,000 pre-money valuation, and existing holders effectively receive 6,000,000.
Pro rata. A pro rata right is a contractual provision that lets existing investors participate in future financing rounds. Assume the seed investors, who hold one third of the pre-round shares, exercise it for one third of the 2,000,000 new shares, which is 666,667 shares after rounding, costing 3,333,335 dollars (666,667 times 5.00) out of the 10,000,000 round. They stay at 33.33 percent, the new investor takes 38.10 percent, and the founder still falls to 28.57 percent.
Down round (a separate scenario, not the base case). Assume instead that the Series A prices 2,000,000 shares at 1.00, below the seed price of 2.00. Broad-based weighted-average anti-dilution (which counts all outstanding shares in the formula) sets the new seed conversion price (the price at which preferred shares convert into common) to the old price times (A plus B) divided by (A plus C), where A is the 1,500,000 shares outstanding before the round, B is the 2,000,000 dollars raised divided by the old 2.00 price, or 1,000,000 shares, and C is the 2,000,000 shares issued. The result is 2.00 times 2,500,000 divided by 3,500,000, or 1.4286, so the seed investors’ 1,000,000 invested divided by 1.4286 converts into 700,000 shares, up from 500,000. With 3,700,000 shares in total, the founder holds 27.03 percent, the seed investors 18.92 percent and the Series A 54.05 percent. A full ratchet resets the seed price to 1.00, which gives the seed 1,000,000 shares and leaves the founder 25.00 percent of 4,000,000 shares in this scenario. A Cooley legal guide notes that a full ratchet does not take into account the amount of financing raised, only the price per share, and is far less common in United States venture financing than the weighted-average method.
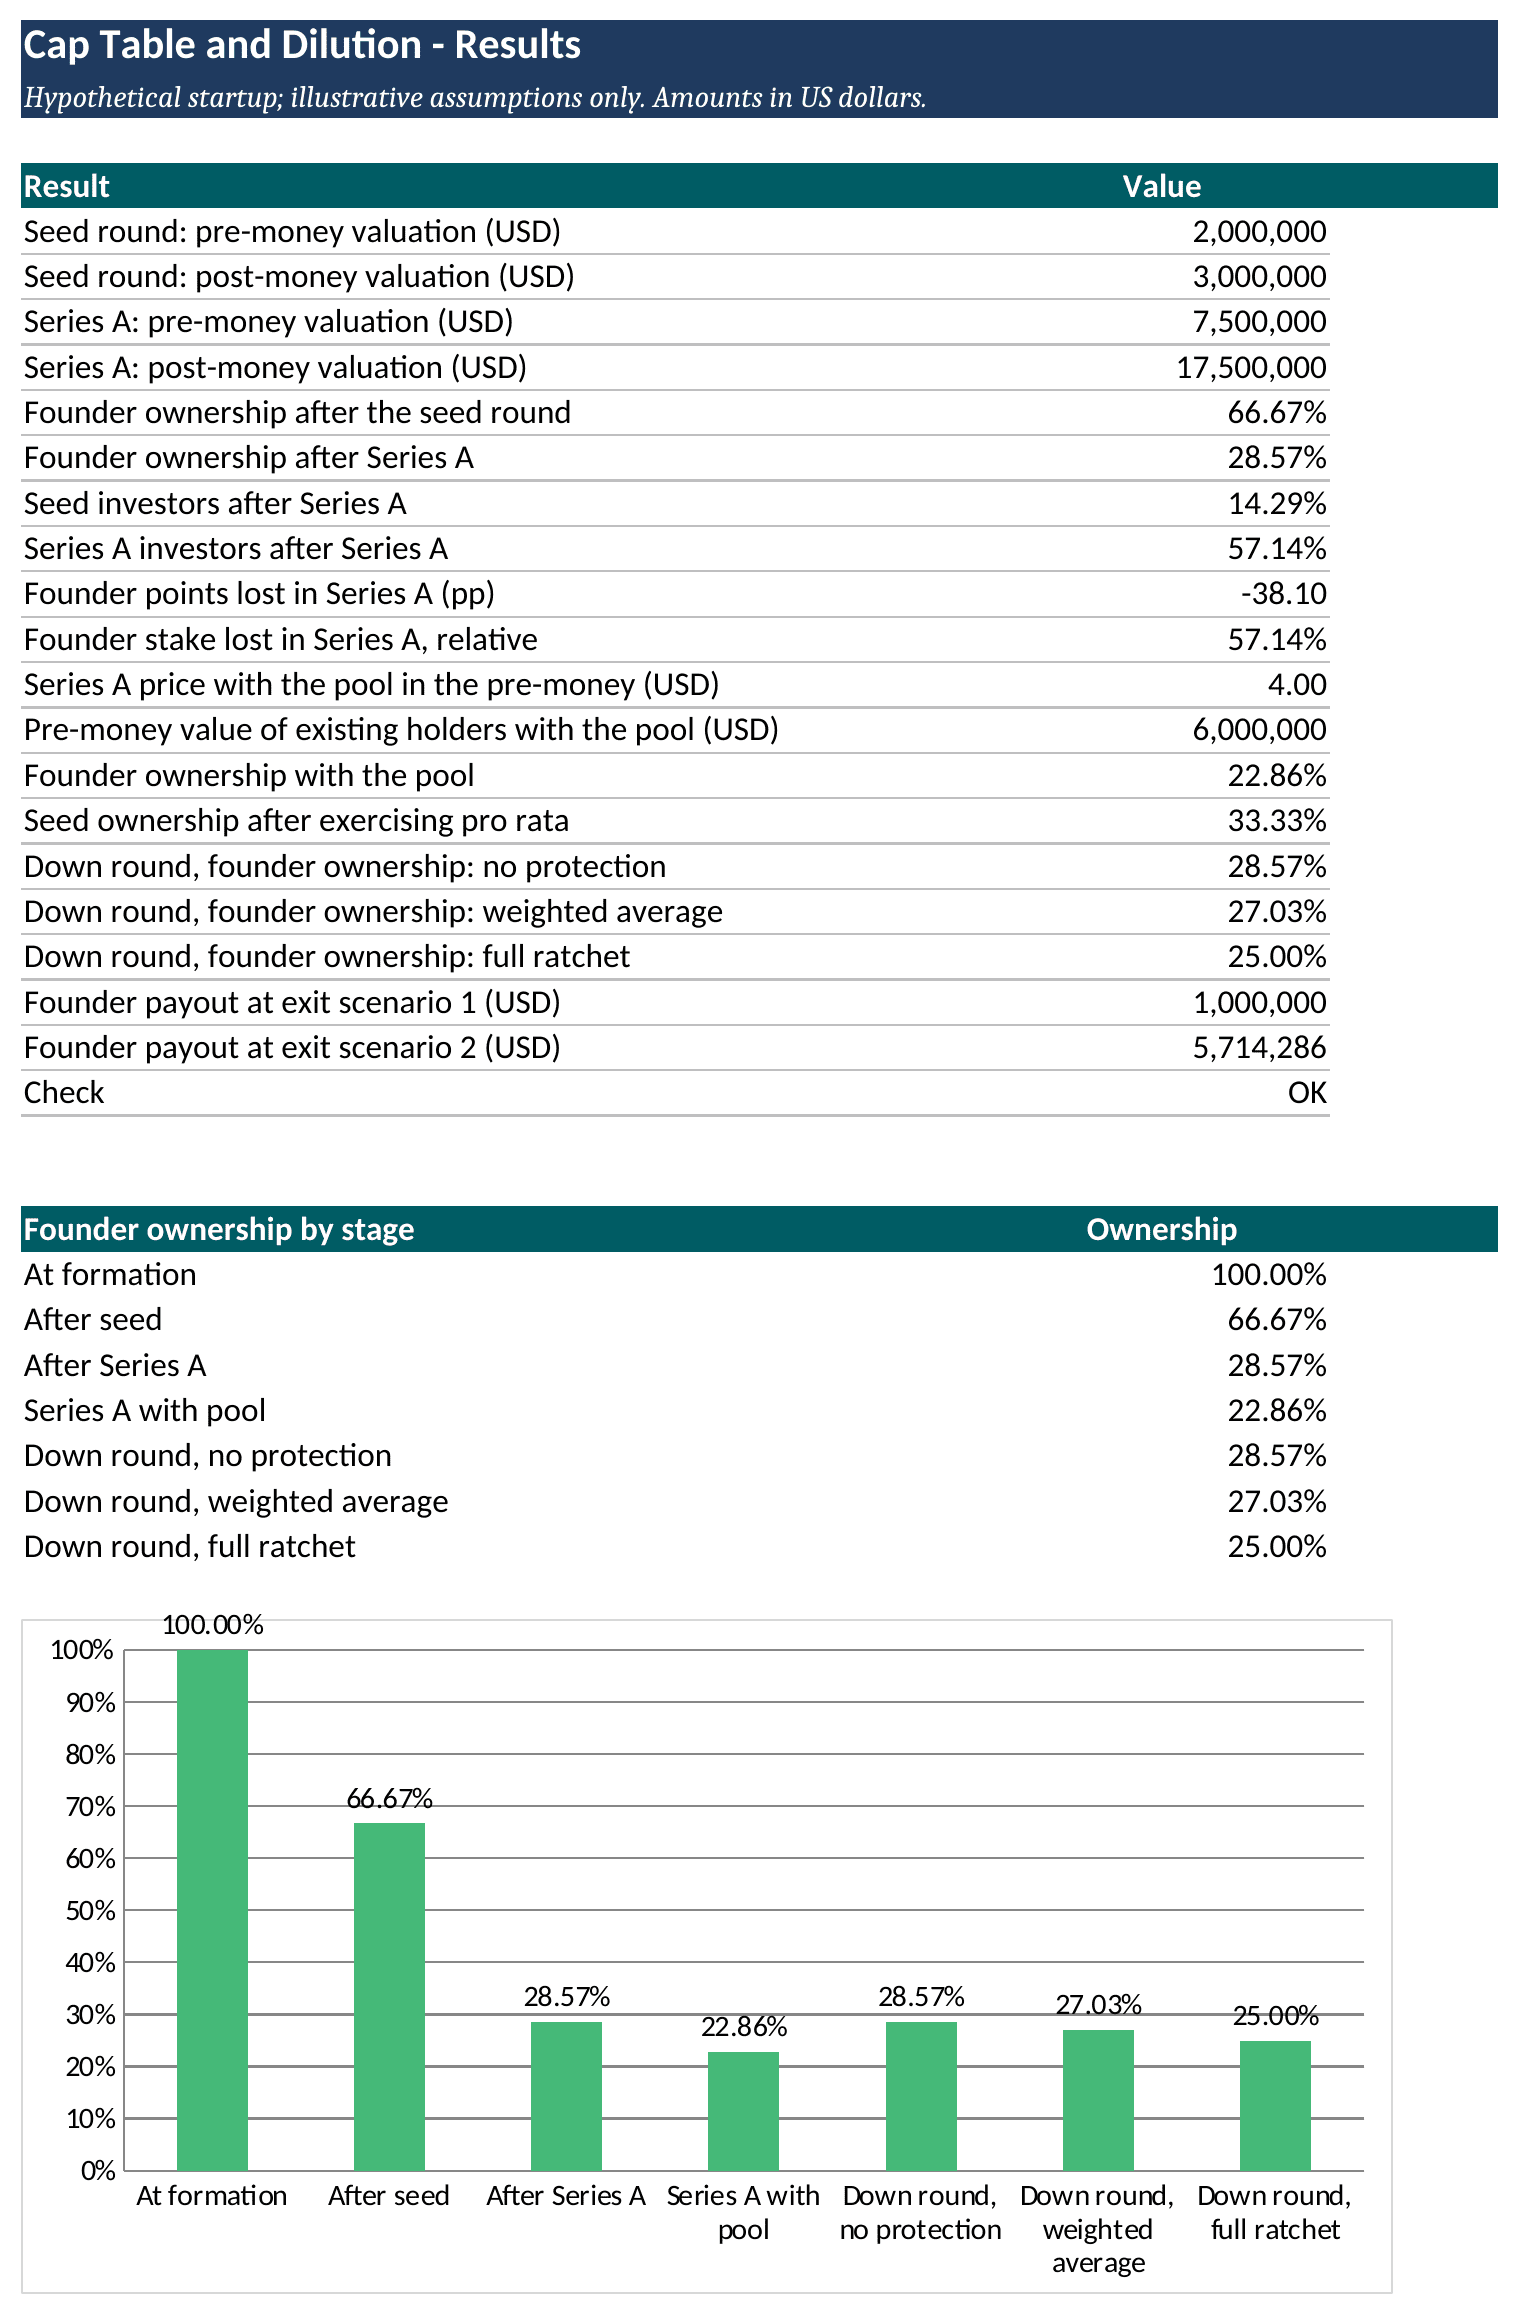
The results sheet collects the key outputs and charts how founder ownership falls round by round. Source: eFinancialModels Analysis
How to Build the Cap Table in Excel
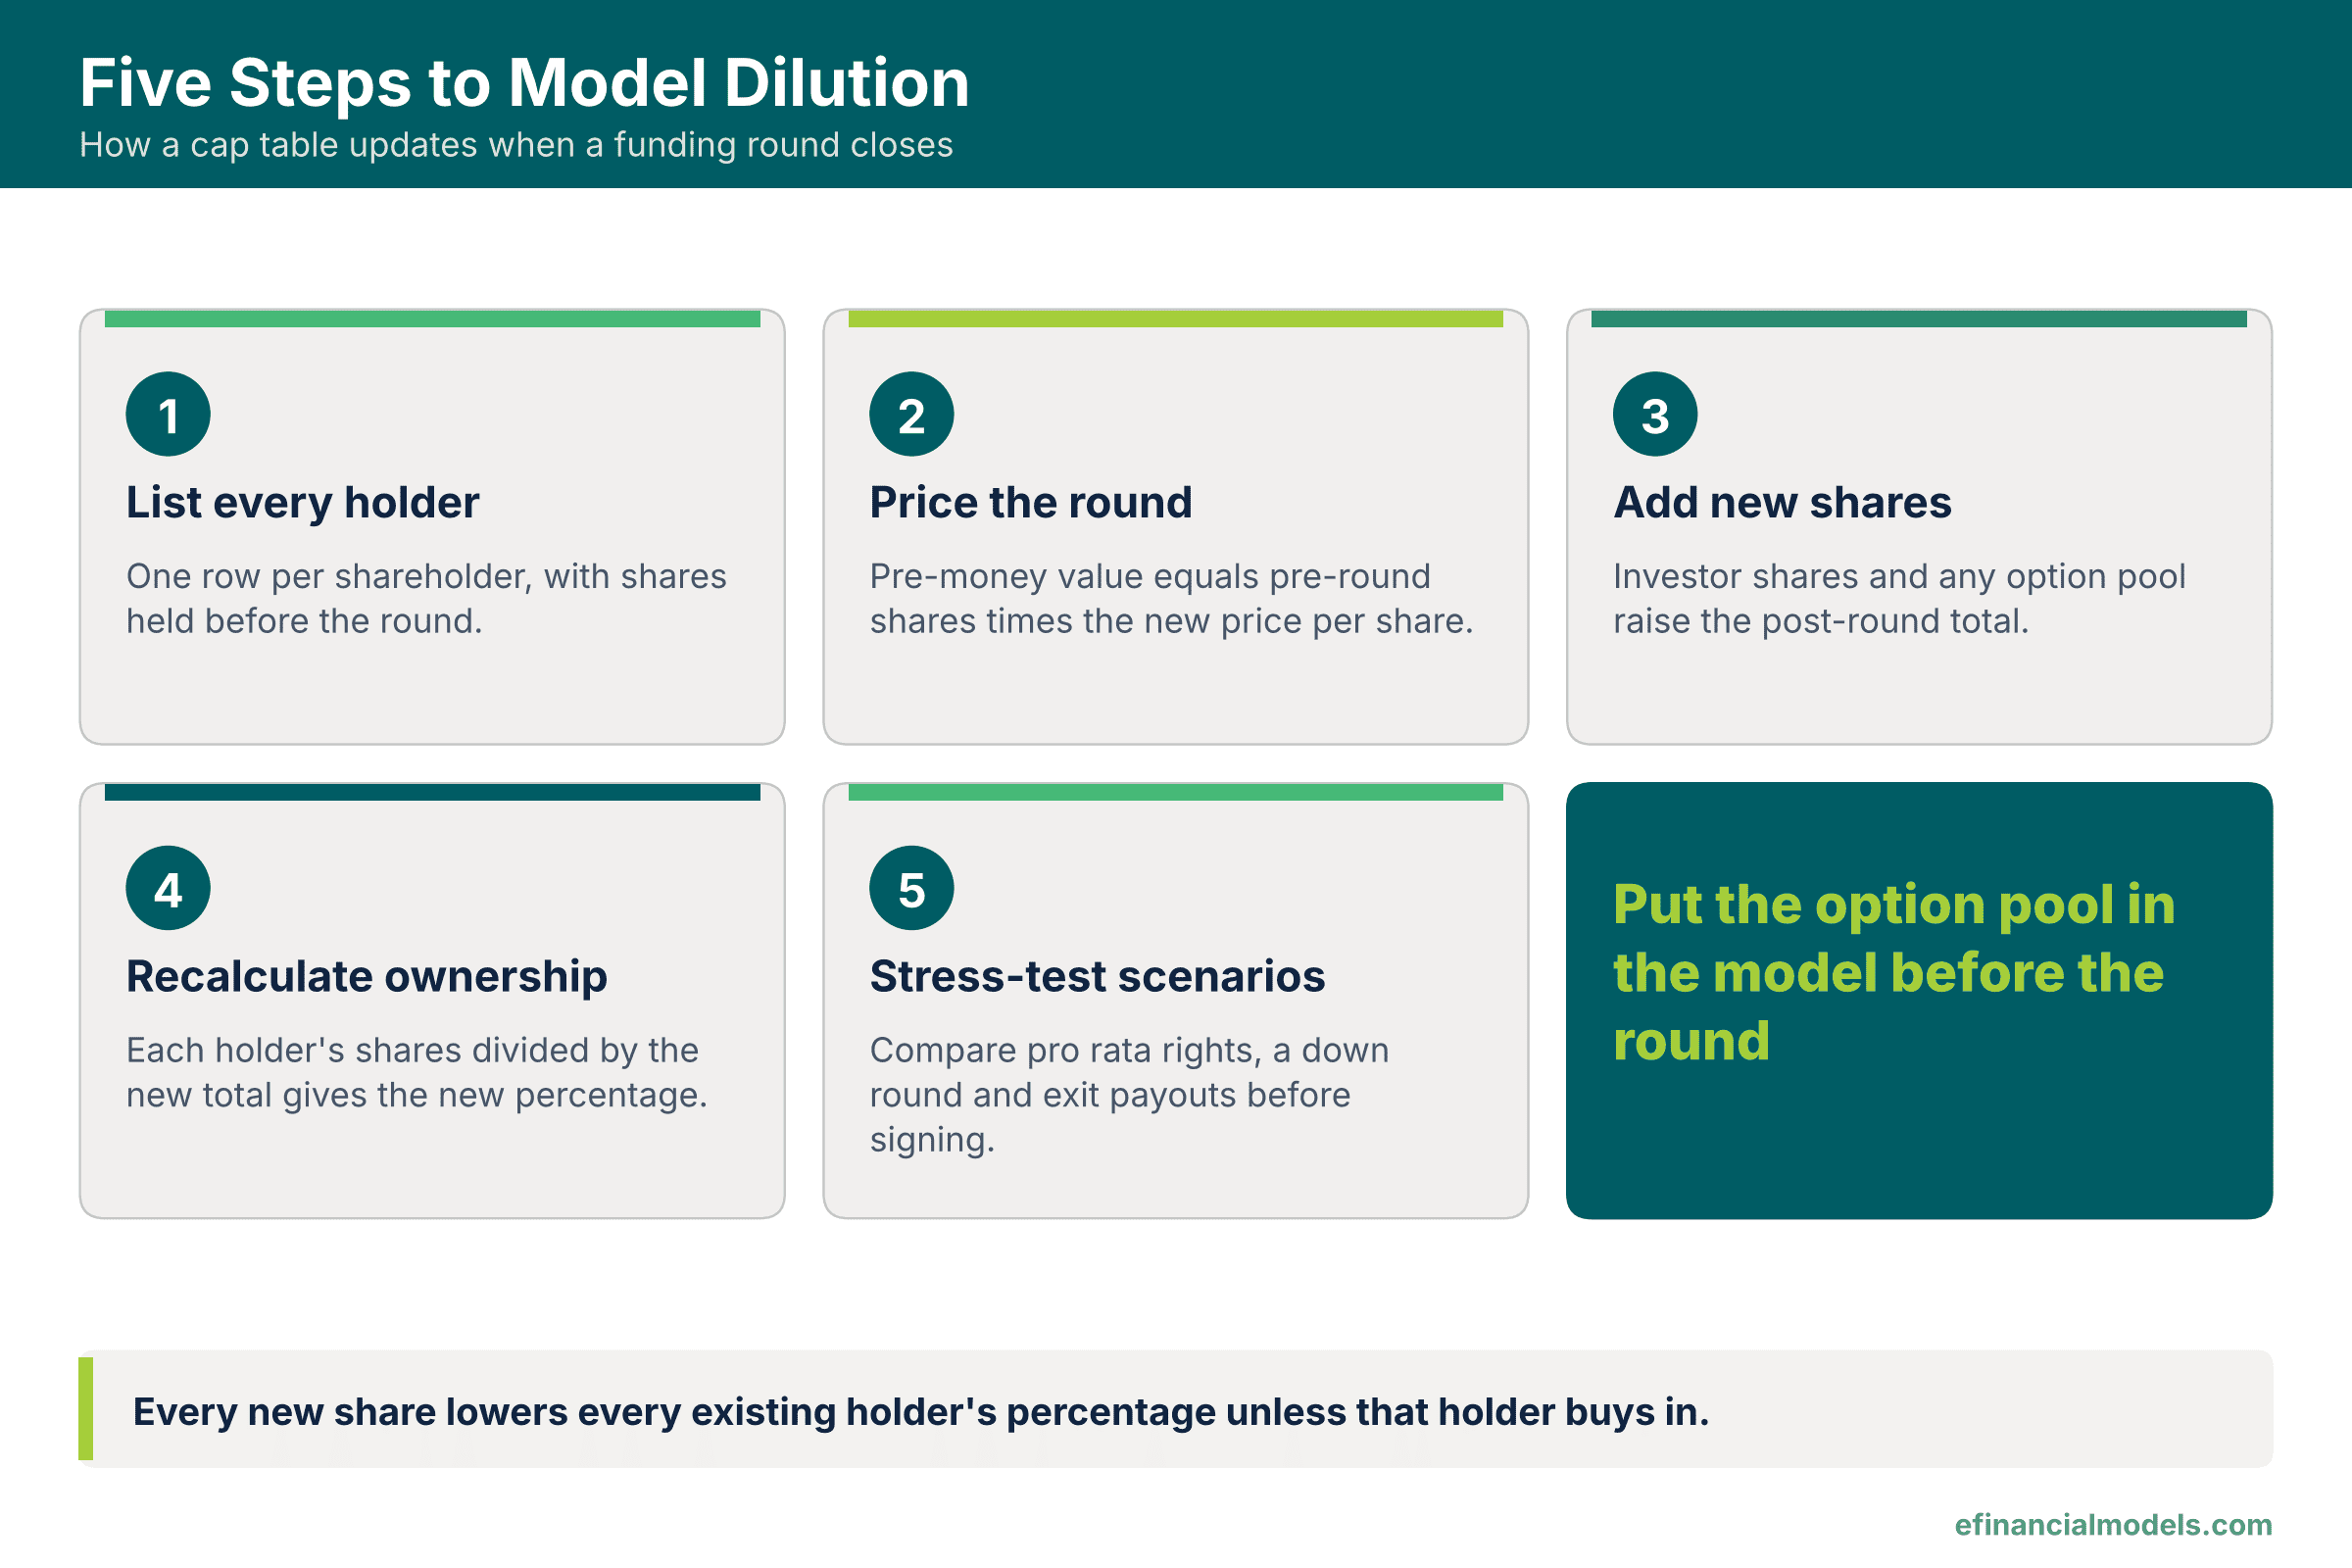
The five steps in order, drawn by eFinancialModels from the method described in this guide.
Use one block per round with five columns: shareholder, shares pre-round, new shares, shares post-round and ownership. Enter =B6+C6 for post-round shares and =D6/D$8 for ownership, where the dollar sign keeps the total row fixed when the formula is copied down. Without a pool, pre-money valuation is =B8*price and post-money valuation is =D8*price. With a pool inside the pre-money, pre-money is an input and price is the output, =pre-money/(B8+pool), and =B8*price then shows only the value left to existing holders. Add a check cell under the ownership column, =if(abs(sum(E6:E7)-1)<0.000001,"ok","error"), extended to every holder row above the total in later blocks, so a broken formula shows at once.
Copy the block into scenario tabs for base, pool, pro rata and down round, all reading one input sheet, so changing one input updates every tab like a simulator. The closed round’s cash then feeds the eFinancialModels five-year financial projections models.
| Feature | Excel | Dedicated cap table software |
|---|---|---|
| Formula transparency | Every formula is visible and editable | Calculations run inside the vendor’s platform |
| Scenario modeling | Built by the modeler on extra tabs | Usually built in |
| Change history | None by default | Usually recorded |
| Best fit | Modeling and early rounds with few holders | Many holders, frequent grants, investor reporting |
Simulator Scenarios: Liquidation Preferences, Reverse Splits and Vesting
Liquidation preference. Assume the seed and Series A investors hold 1x non-participating preferred stock that ranks equally, meaning each takes its invested amount back or converts to common stock, whichever pays more. Using the base case without an option pool, at a 12,000,000 sale converting would give the Series A investors 6,857,143, so they take their 10,000,000 preference. Converting would then give the seed investors only 666,667 of the remaining 2,000,000, so they take their 1,000,000, and the founder receives 1,000,000, or 8.33 percent. At 20,000,000 everyone converts: Series A 11,428,571, seed 2,857,143 and founder 5,714,286, or 28.57 percent.
Reverse split. A 1-for-10 reverse split turns each share into a fraction of a share, and state corporate law and the company’s articles generally govern it. The founder’s 1,000,000 shares become 100,000 and the price rises from 5.00 to 50.00, while every percentage and the 17,500,000 post-money valuation stay unchanged.
Option vesting. The standard schedule is 48 months with a 12-month cliff, with 25 percent vesting at the cliff, so a grant of 100,000 options vests 25,000 at month 12. Unissued options still count as fully diluted: in the pool case the founder holds 22.86 percent fully diluted but 25.00 percent of the 4,000,000 issued shares.
409A valuation. The 409A and reverse-split references in this guide are United States law, the anti-dilution methods reflect United States market practice, and founders elsewhere should ask a local adviser for the equivalent. A 409A valuation is an independent appraisal of common stock value used to set option exercise prices under section 409A of the Internal Revenue Code. The regulation says the exercise price may never be less than the fair market value of the stock, presumes an independent appraisal reasonable if dated no more than 12 months before the grant, and does not protect one that ignores later information that may materially affect value. Assume a common value of 1.50, well below the 5.00 base-case preferred price, and treat the 100,000 options as a separate illustration, so exercising the 25,000 vested options costs 37,500.
When Complex Structures Need a Modeler
Simple agreements for future equity (SAFEs) and convertible notes add conversion order and waterfall logic. In Y Combinator’s post-money SAFE, the Company Capitalization is the denominator in calculating the SAFE price, so each SAFE changes the ownership arithmetic before any priced round. SAFE and note conversion is outside this guide’s example, so a startup lawyer or modeler should check it before a priced round. For that complexity, eFinancialModels offers custom financial modeling services for Series A and Series B cap table analysis.
Frequently Asked Questions
How often should a founder update the cap table?
After every event that changes a share count: an issuance, an option grant, an exercise, a repurchase, a transfer or a closing. Each update should carry a date and be saved as a new version, never overwritten. Before a financing, the table should be reconciled to the signed documents and the company’s share ledger, because investors price the round from it and a mismatch can delay the closing or change the price.
When should a startup move from Excel to cap table software?
The move makes sense when the number of holders, option grants or investor reports grows beyond what one person can keep accurate by hand. Typical triggers are dozens of employee option holders, several closings a year, or investors asking for electronic access and signatures. Excel stays useful afterward, because a founder can test a proposed round in a copy of the table before changing the official record.
Does dilution always mean the founder loses money?
No, because dilution cuts the percentage, not necessarily the value. In the example, the founder’s 1,000,000 shares had a paper value of 2,000,000 at the seed price of 2.00 and 5,000,000 at the Series A price of 5.00 (common stock is worth less than preferred, 1.50 in the 409A example), even though the stake shrank across both rounds of the example. A real loss of value appears when a later round prices below an earlier one, as in the down-round case, or when a sale lands below the preference stack, as in the 12,000,000 exit case, where preferences cut the founder to 1,000,000.
What should a lawyer or tax adviser check?
A model shows arithmetic, not legal validity. A lawyer should confirm that each share and option issuance was authorized, that preference terms match the financing documents and that any reverse split followed state law and the company’s charter. A tax adviser should review option exercise taxes and the 409A appraisal, because tax treatment differs by country and by type of option, and an error in either area can create costs that no spreadsheet will reveal.
Conclusion
A founder can model dilution by listing every holder, pricing the round, adding new shares, recalculating ownership and then testing the pool, pro rata, down-round and exit cases before signing. Readers who want a ready-made starting point can open the eFinancialModels Simple Cap Table Template, a free Excel model that covers capital raising rounds from Seed to Series A through C, the dilution effect of issuing new equity and a stock option pool.