0 ITEMS

The 13-Week Cash Flow Forecast: The Turnaround Standard
A 13-week cash flow forecast is a rolling weekly schedule of cash receipts and payments that shows whether cash and unused credit stay above the lender’s minimum for the next quarter. It is built in six steps: fix the opening position, forecast receipts, schedule payments, apply the revolver, test liquidity, then roll it forward and explain each variance every week.
Key Takeaways
- A 13-week cash flow forecast lists expected receipts and payments by week for one quarter, so liquidity gaps show up before they arrive.
- Build it with the direct method: opening cash, receipts from receivables, scheduled payments, revolver draws and a weekly liquidity test.
- In the worked example, a hypothetical distributor draws its revolver to USD 2,355 thousand by week 12, leaving only USD 145 thousand of availability.
- Roll the forecast every week: replace the forecast week with actuals, add one new week at the end and explain the variance.
- Receipts carry the most risk, so build collection profiles from observed payment history rather than invoice due dates.
Why lenders and turnaround teams ask for 13 weeks
Thirteen weeks is one quarter, which is short enough to name every payroll run, tax payment and supplier batch, and long enough to see a funding gap a month or two before it arrives. A Financial Poise article on drafting cash collateral and debtor-in-possession financing orders, the court-approved terms under which a company in Chapter 11 may use cash or borrow, says the order’s budget typically takes the form of a 13-week cash flow forecast that “must be detailed, accurate, and constantly updated” (National Law Review, August 2025).
As context, business bankruptcy filings across all chapters in US federal courts rose 5.6 percent, from 22,762 to 24,039, in the 12 months ending 30 September 2025 (US Courts, November 2025); the count shows how many companies face court-supervised distress, not how many use the forecast. A company does not need to be in court to use the tool: in practice, lenders under forbearance or covenant pressure commonly ask for the same weekly view, and turnaround teams treat it as the usual format, which is the sense of “standard” in the title.
The direct method shows cash the way the bank sees it
The direct method forecasts operating cash flows as actual receipts and payments, while the indirect method starts from net income and adjusts for non-cash items and working capital, the cash tied up in receivables, inventory and payables. International Accounting Standard (IAS) 7, part of International Financial Reporting Standards (IFRS), allows an entity to report operating cash flows using either approach (Grant Thornton, Insights into IAS 7). A weekly forecast needs the direct method because profit is not cash: a sale raises profit when invoiced but raises cash only when the customer pays.
Build the forecast in six steps, from bank balance to liquidity test
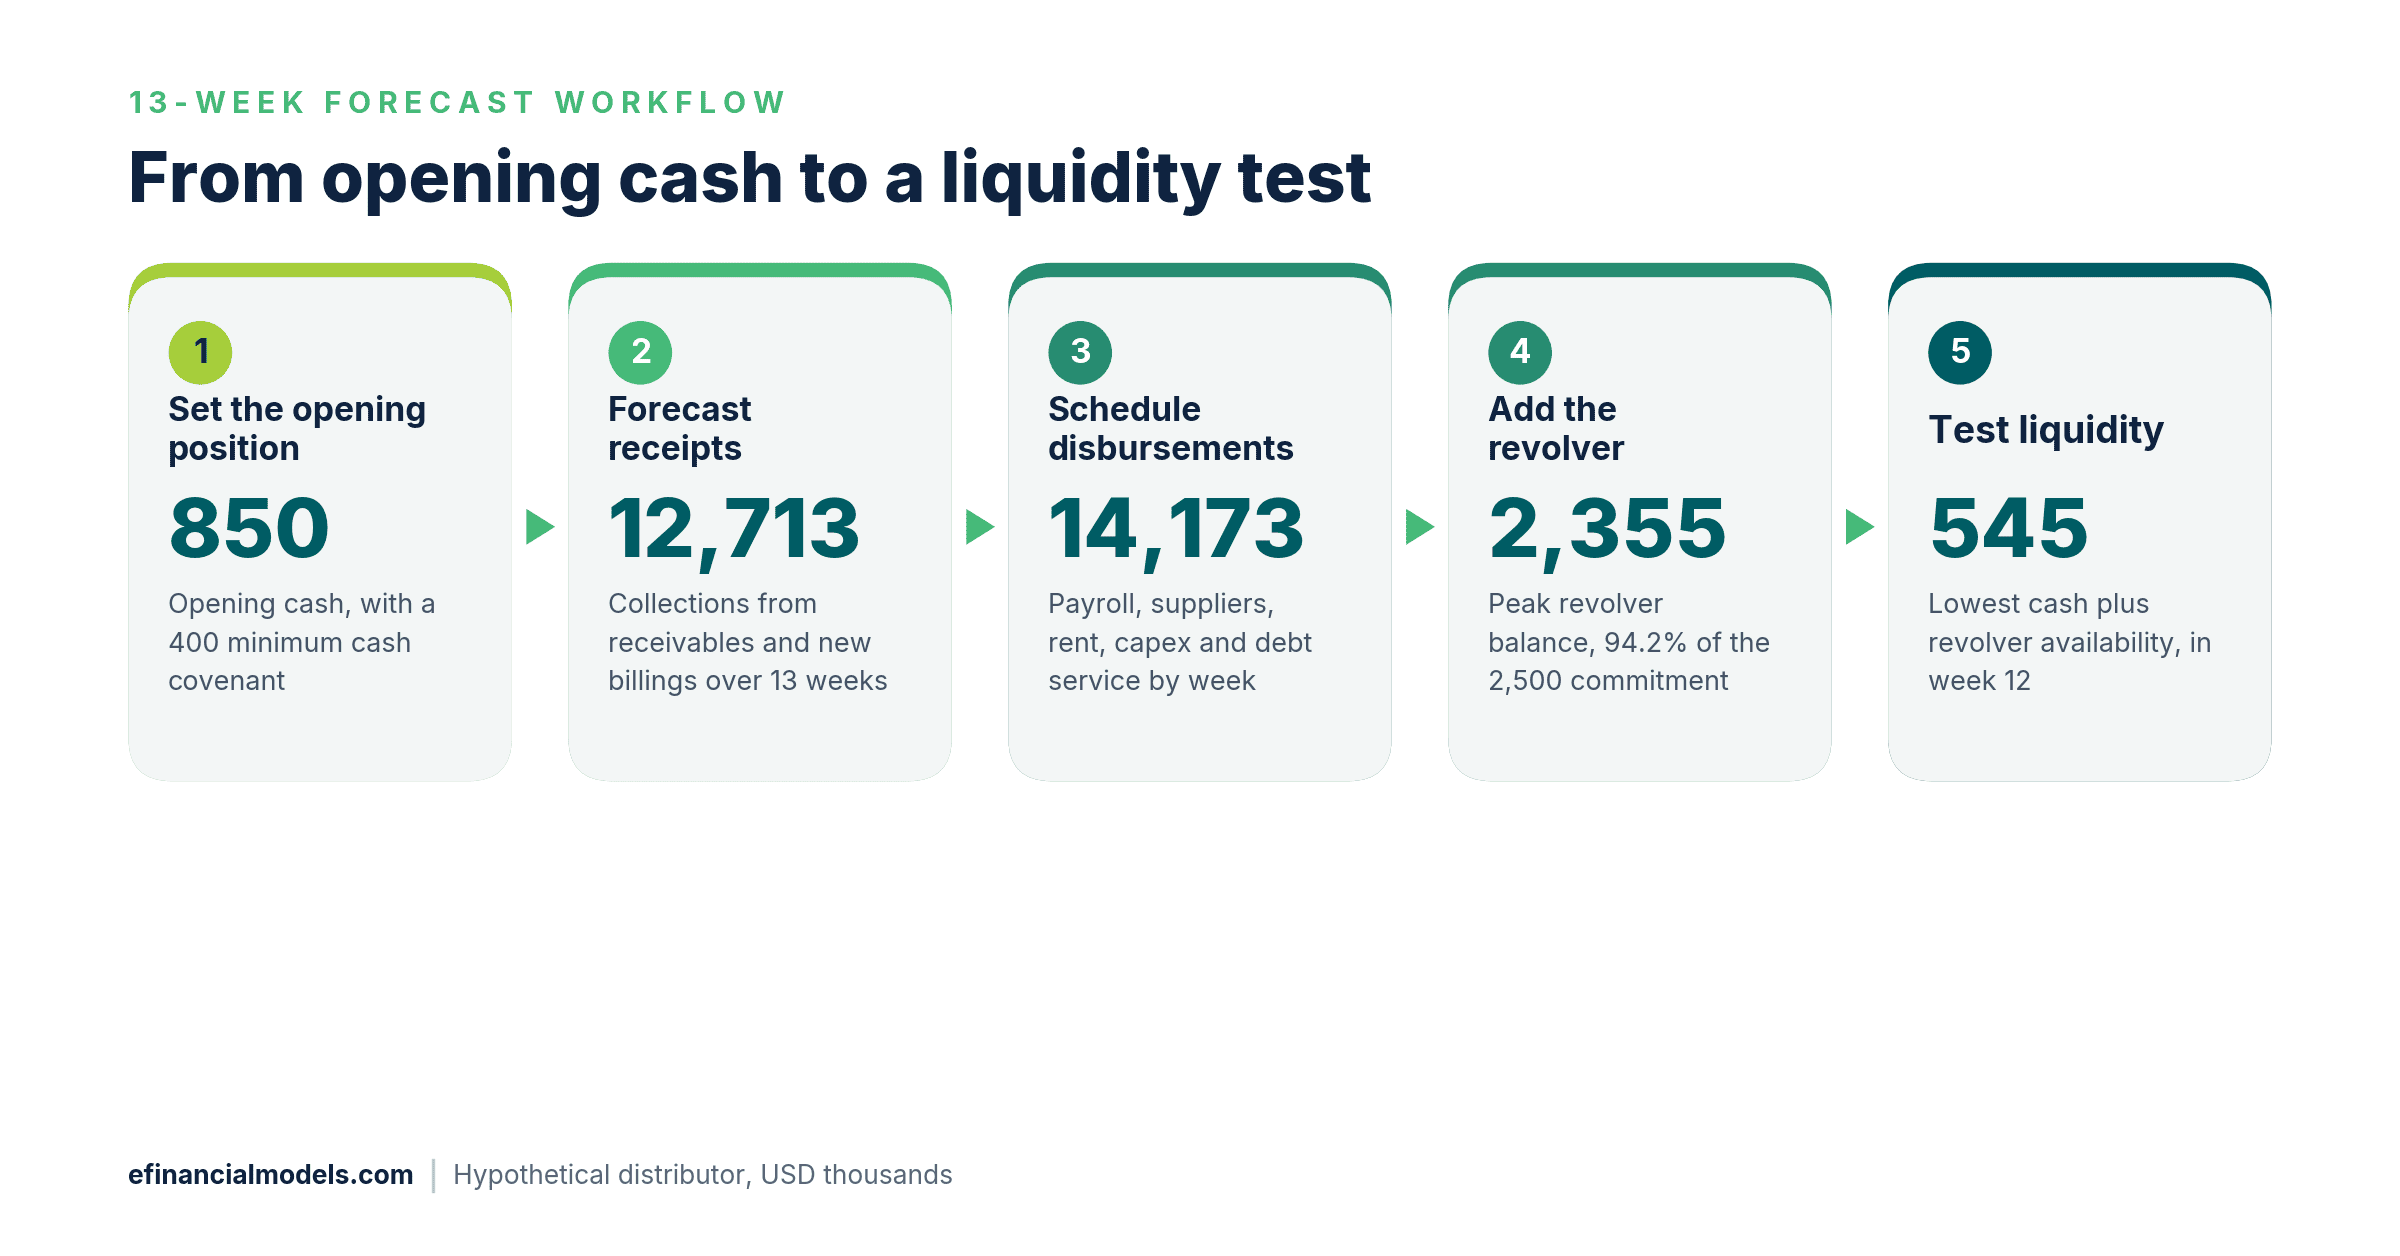
The six-step build condenses to five headline numbers of the hypothetical distributor, in USD thousands. Source: eFinancialModels Analysis
- Fix the opening position. Start from the reconciled bank balance, record the drawn and unused parts of the revolving credit facility (the revolver) beside it, and write down the minimum cash the lender requires.
- Forecast receipts from the receivables ledger. Age each open invoice, assign a collection percentage to each week, then add new billings collected after the observed lag.
- Schedule payments from the payables ledger. List payroll, payroll taxes, rent, insurance, supplier runs, capital expenditure and debt service in the week each leaves the bank.
- Apply the revolver rule. When cash before borrowing falls below the minimum, draw the shortfall up to the unused commitment; if the commitment runs out, flag a shortfall.
- Test liquidity. Closing cash plus unused revolver is the liquidity for each week; the weeks with the least headroom over the minimum drive the decisions.
- Roll and reconcile. Each week, replace the forecast with actuals, extend the horizon by one week and explain the variances.
Receipts deserve the most scepticism. PwC’s working capital study of listed companies worldwide found that days sales outstanding (DSO), the average number of days customers take to pay, rose from 47.3 days in 2015 to 50.0 days in 2024 (PwC, Working Capital Study, 2025). The same study reports that days payable outstanding (DPO), the average number of days a company takes to pay its suppliers, is up 11.5% since 2015. Both figures are listed-company context, not a measure of lateness, but they support basing collection and payment profiles on observed history rather than due dates.
Worked example: a distributor’s 13-week forecast
The example uses a hypothetical wholesale distributor in turnaround, with all amounts in USD thousands. It assumes opening cash of 850, a lender minimum cash covenant of 400, and a revolver with a 2,500 commitment of which 1,200 is drawn. The revolver costs an assumed prime rate of 7.00% plus a 2.00% margin, an all-in rate of 9.00%.
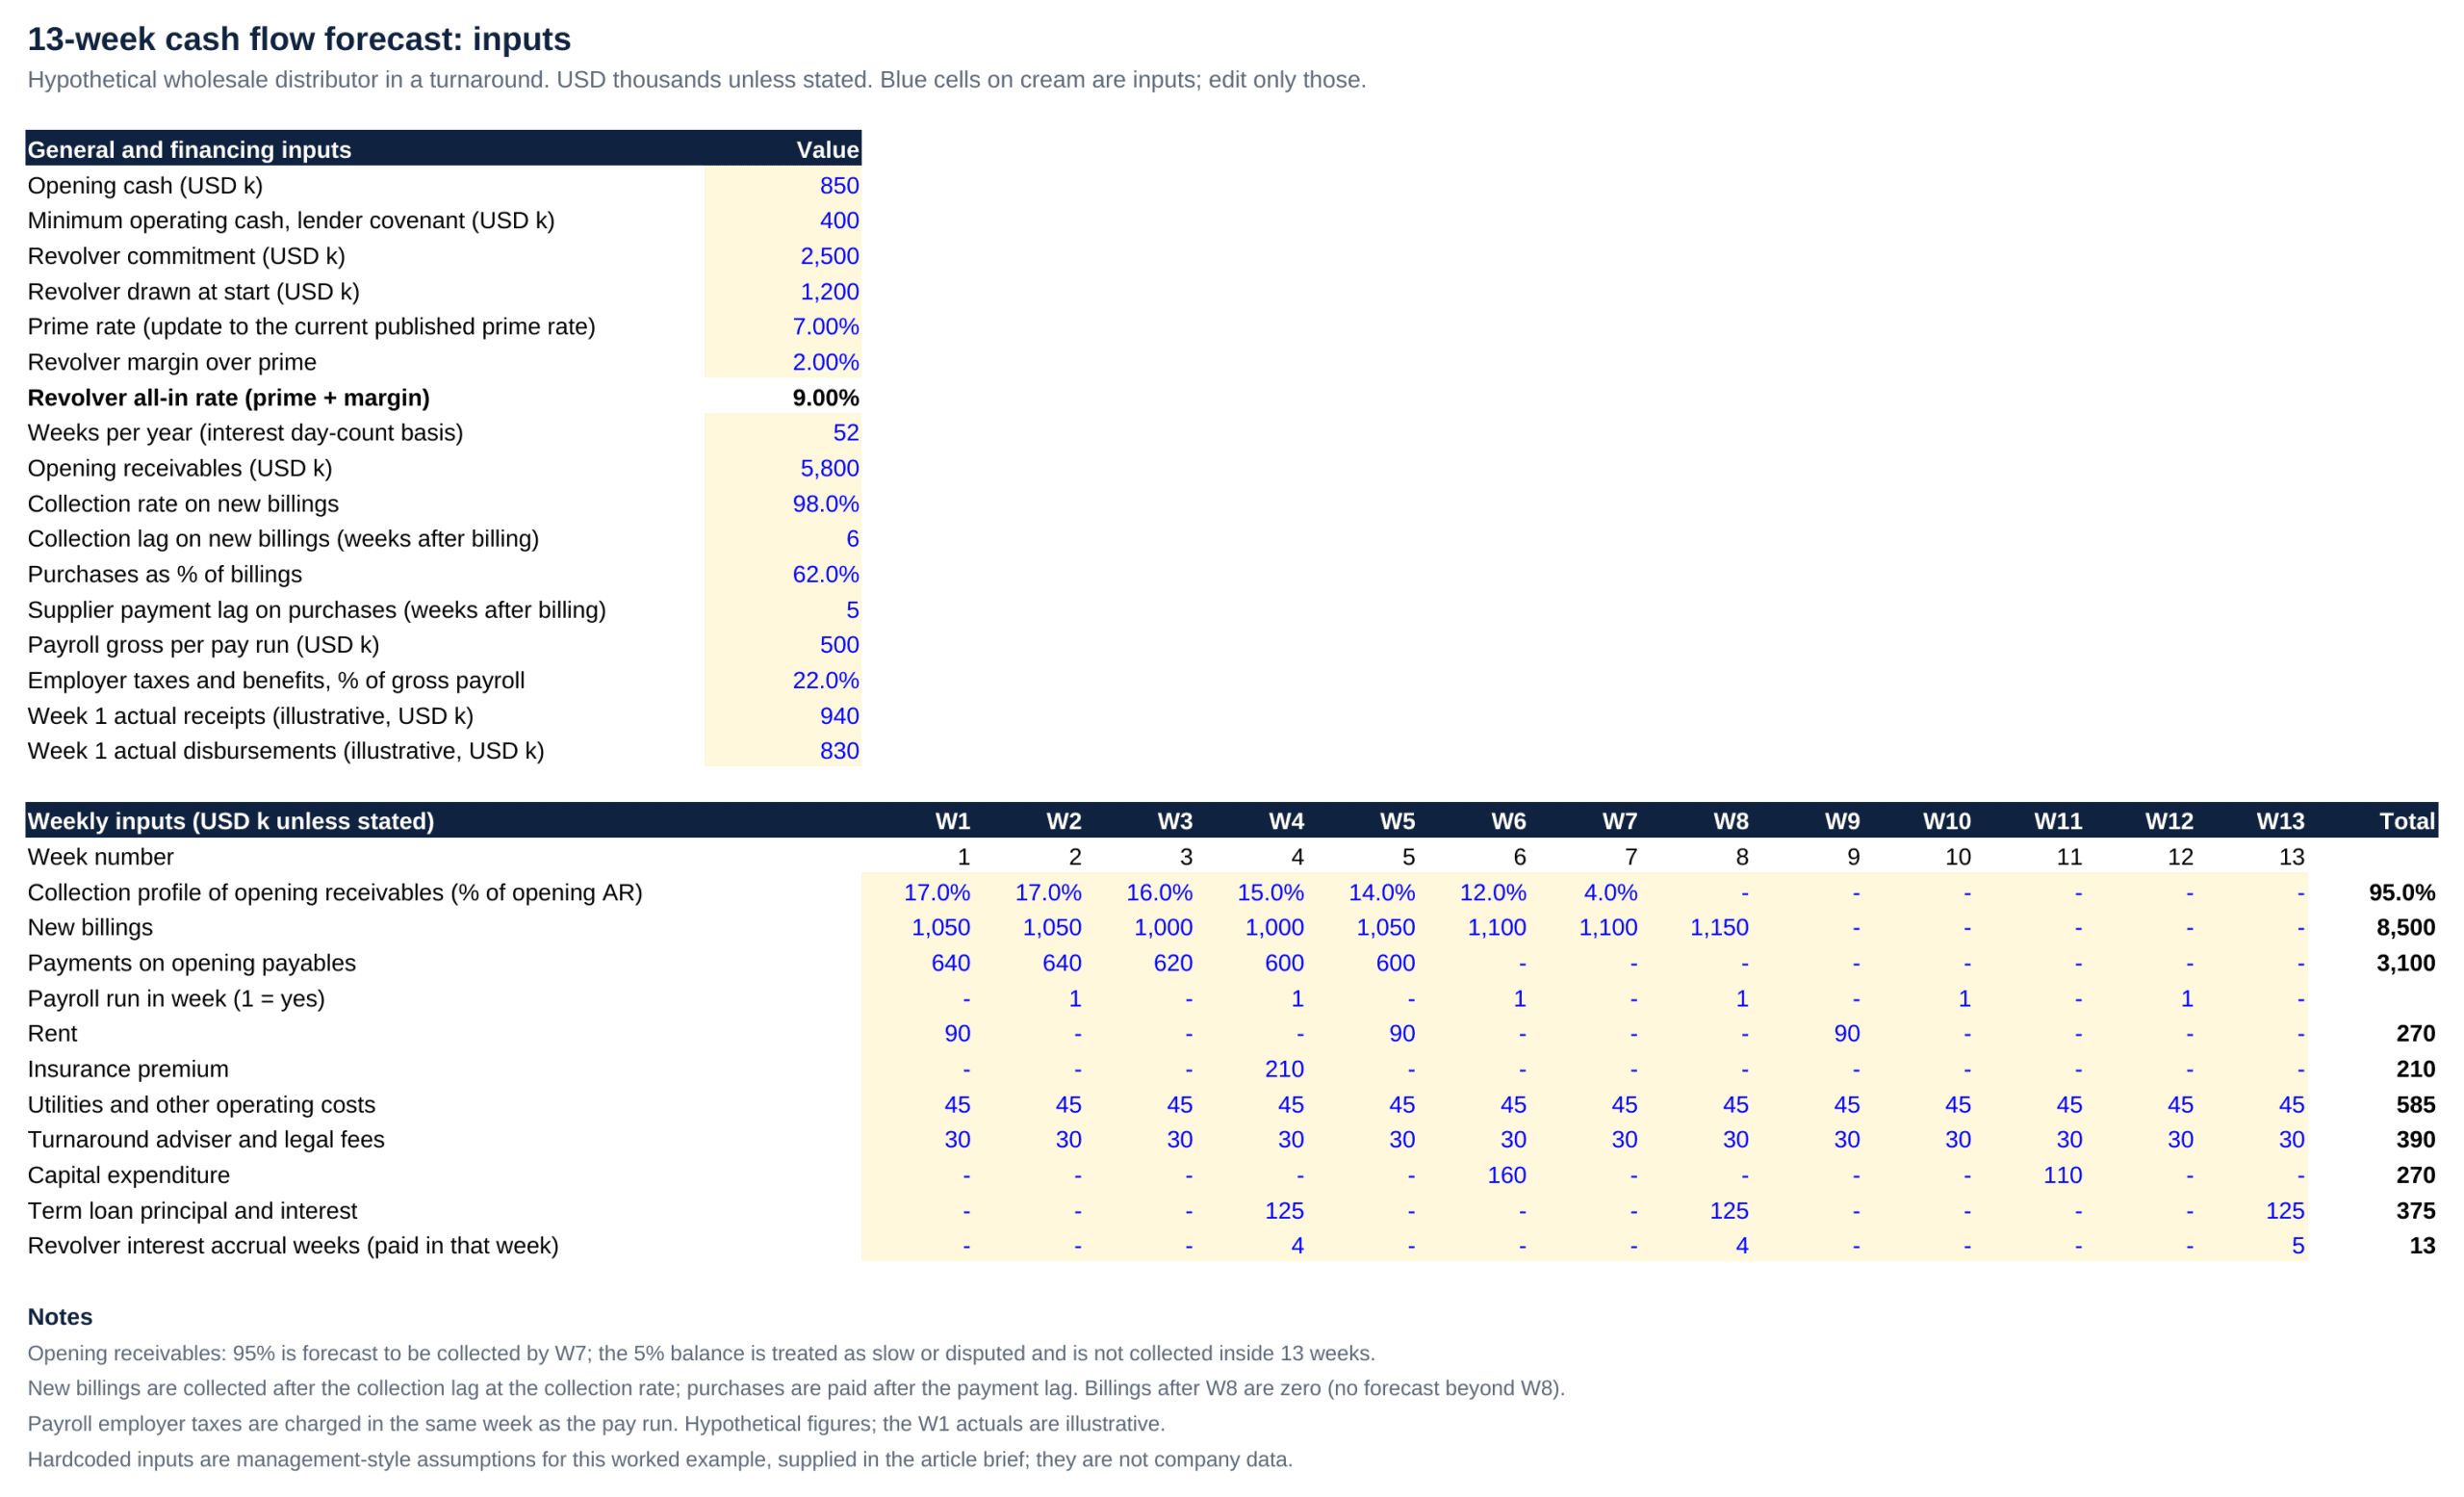
Every blue cell on the inputs sheet is an assumption the finance team can change. Source: eFinancialModels Analysis
Opening receivables are 5,800, and 95% of them are assumed collected inside 13 weeks, at 17%, 17%, 16%, 15%, 14%, 12% and 4% in weeks 1 to 7. New billings of 1,050 in weeks 1 and 2, and 1,000 to 1,150 in weeks 3 to 8, are assumed to be collected six weeks later at a 98% collection rate. Purchases equal 62% of billings and are paid five weeks later; opening payables of 3,100 are paid 640, 640, 620, 600 and 600 in weeks 1 to 5. Gross payroll is 500 every second week plus 22% employer taxes and benefits. Rent is 90 in weeks 1, 5 and 9, utilities and other costs are 45 and adviser fees 30 each week, insurance is 210 in week 4, capital expenditure is 160 in week 6 and 110 in week 11, and the term loan costs 125 in weeks 4, 8 and 13.
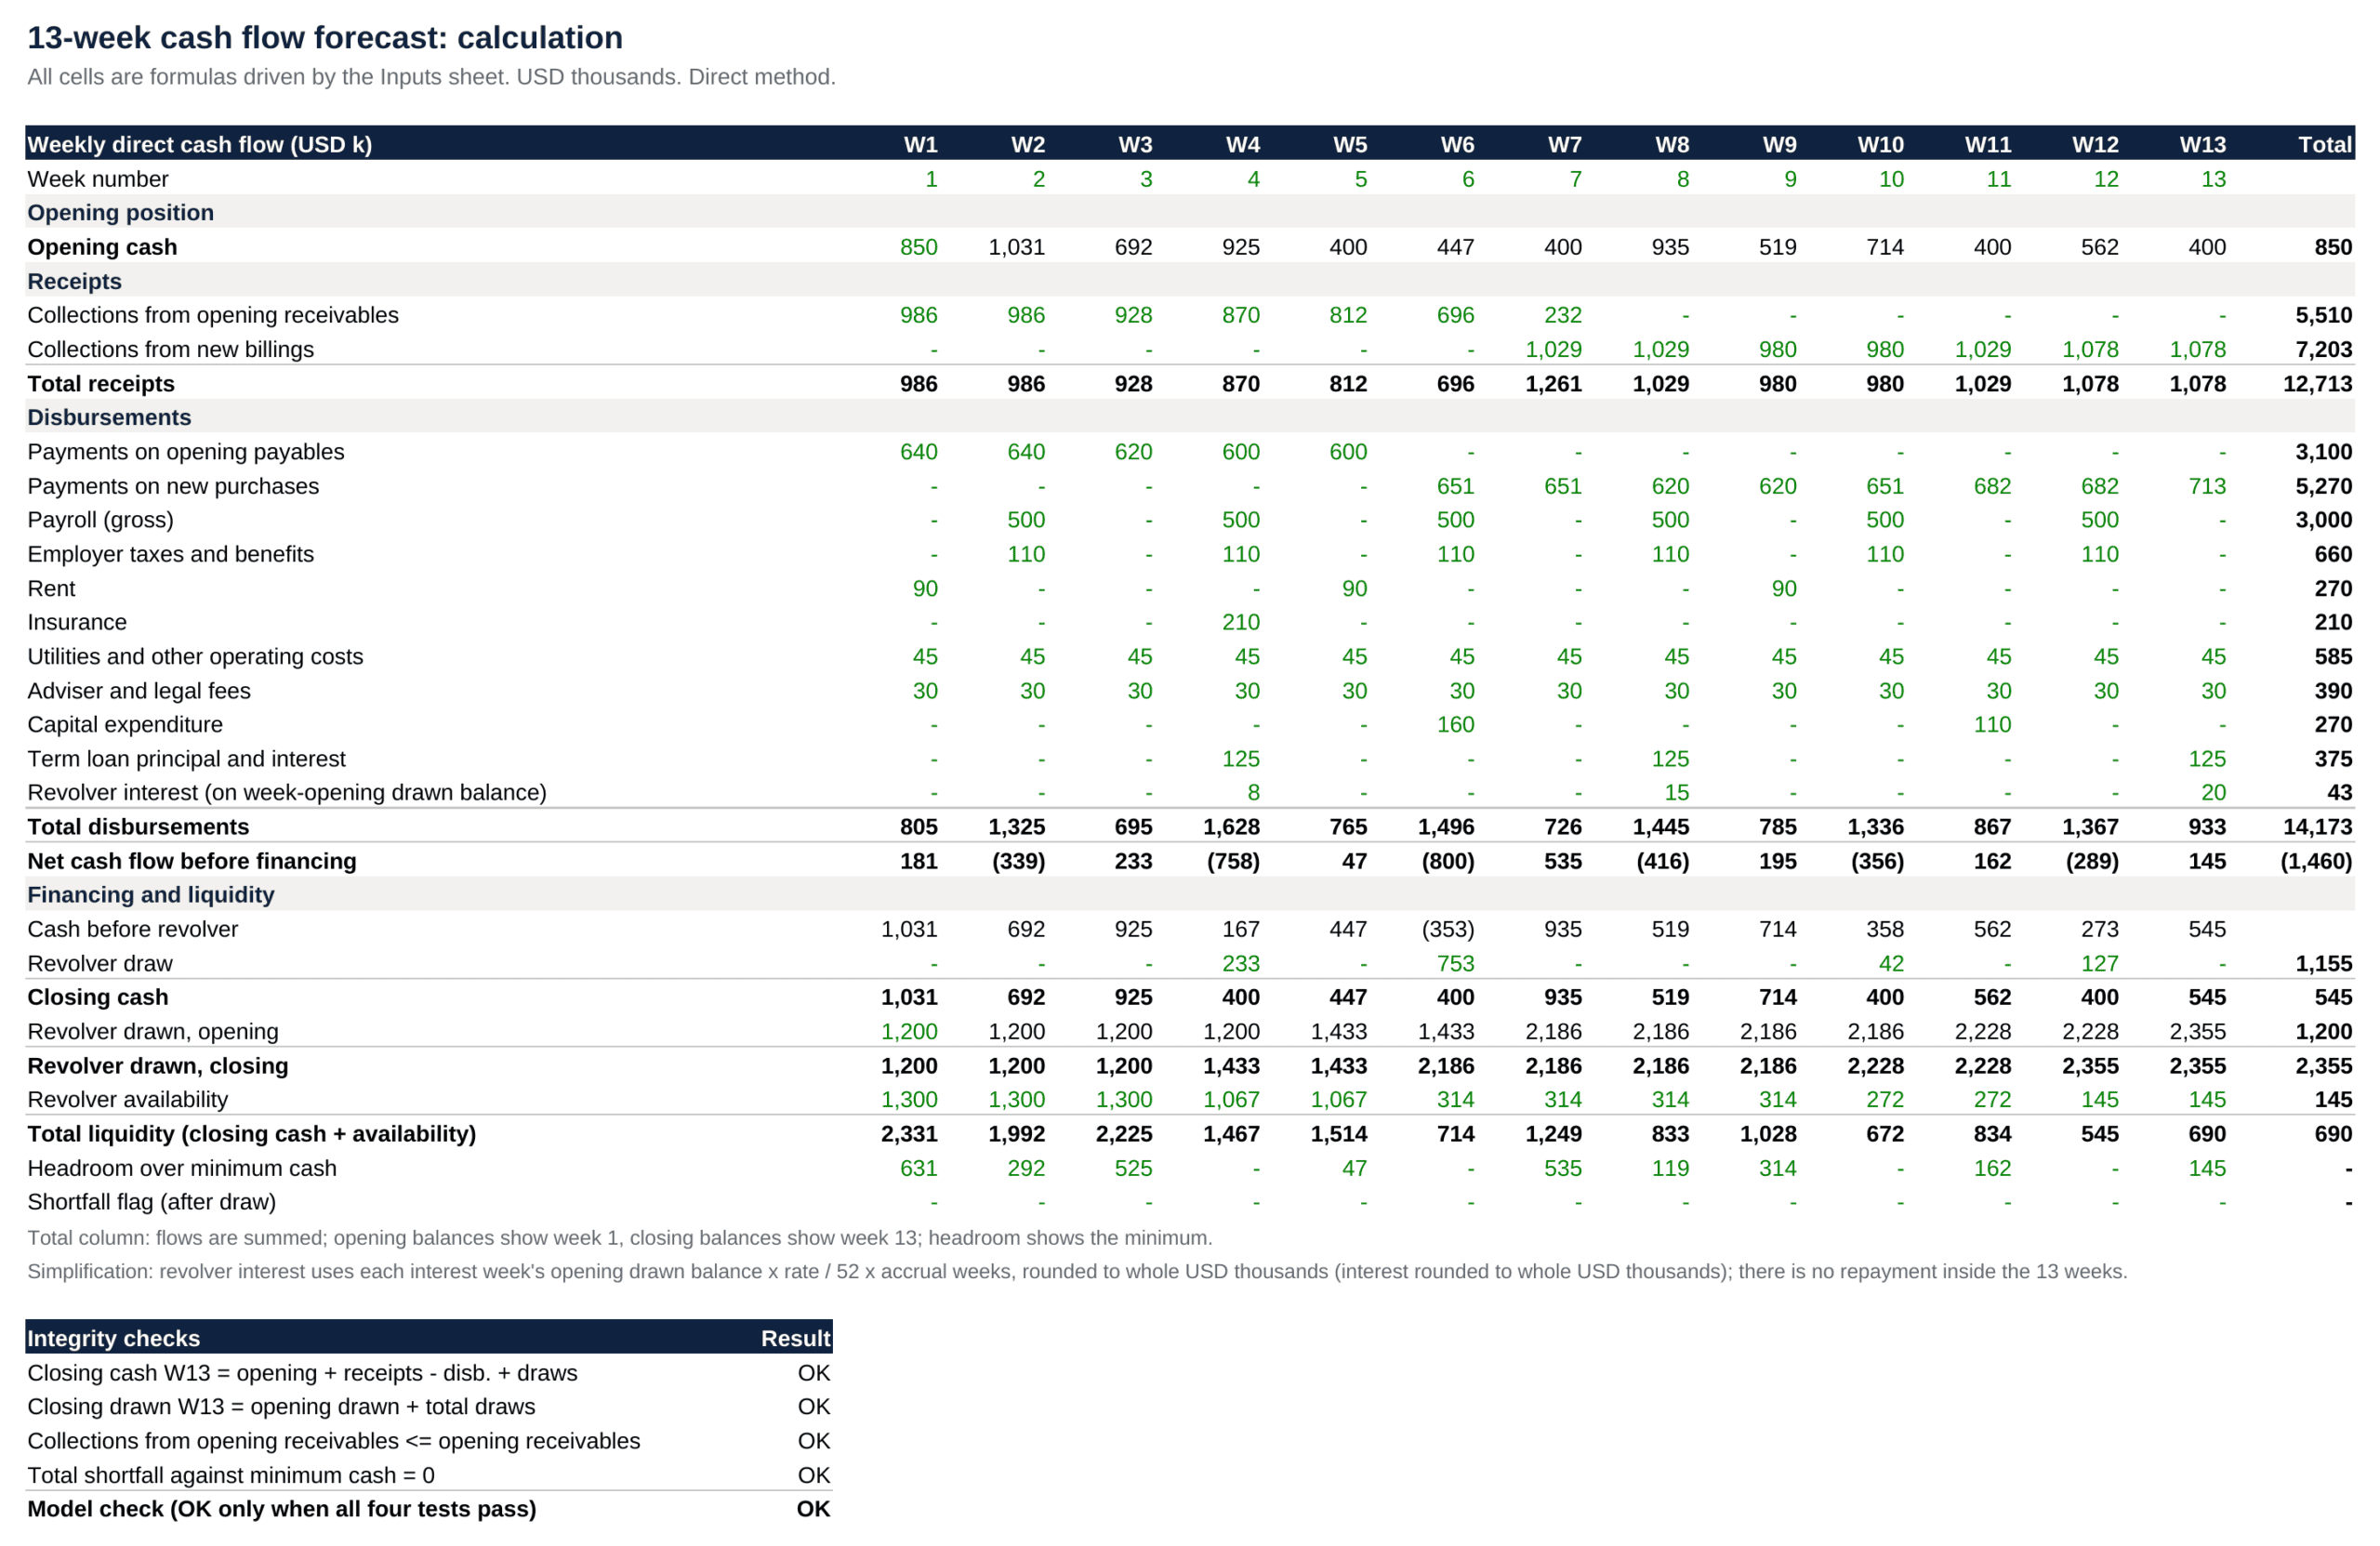
The calculation sheet moves receipts, disbursements and the revolver rule week by week into liquidity. Source: eFinancialModels Analysis
Two weeks show the mechanics. In week 4, receipts are 15% of 5,800 = 870. Payments are 600 to suppliers, 500 payroll, 110 payroll taxes, 210 insurance, 125 term loan, 45 other costs, 30 adviser fees and 8 revolver interest, a total of 1,628. Opening cash of 925 (the week 3 closing balance in the table below) + 870 – 1,628 leaves 167 before borrowing, so with a 400 minimum the draw is 400 – 167 = 233. In week 6, receipts are 12% of 5,800 = 696. Payments are 651 to suppliers (62% of 1,050), 500 payroll, 110 payroll taxes, 160 capital expenditure, 45 other costs and 30 adviser fees, a total of 1,496. Opening cash of 447 (the week 5 closing balance in the table below) + 696 – 1,496 leaves -353, so the draw is 400 – (-353) = 753. Cash sits exactly on the covenant minimum in weeks 4, 6, 10 and 12.
| Week | Opening cash | Receipts | Payments | Revolver draw | Closing cash | Revolver drawn | Liquidity |
|---|---|---|---|---|---|---|---|
| 1 | 850 | 986 | 805 | 0 | 1,031 | 1,200 | 2,331 |
| 2 | 1,031 | 986 | 1,325 | 0 | 692 | 1,200 | 1,992 |
| 3 | 692 | 928 | 695 | 0 | 925 | 1,200 | 2,225 |
| 4 | 925 | 870 | 1,628 | 233 | 400 | 1,433 | 1,467 |
| 5 | 400 | 812 | 765 | 0 | 447 | 1,433 | 1,514 |
| 6 | 447 | 696 | 1,496 | 753 | 400 | 2,186 | 714 |
| 7 | 400 | 1,261 | 726 | 0 | 935 | 2,186 | 1,249 |
| 8 | 935 | 1,029 | 1,445 | 0 | 519 | 2,186 | 833 |
| 9 | 519 | 980 | 785 | 0 | 714 | 2,186 | 1,028 |
| 10 | 714 | 980 | 1,336 | 42 | 400 | 2,228 | 672 |
| 11 | 400 | 1,029 | 867 | 0 | 562 | 2,228 | 834 |
| 12 | 562 | 1,078 | 1,367 | 127 | 400 | 2,355 | 545 |
| 13 | 400 | 1,078 | 933 | 0 | 545 | 2,355 | 690 |
| Total | 12,713 | 14,173 | 1,155 |
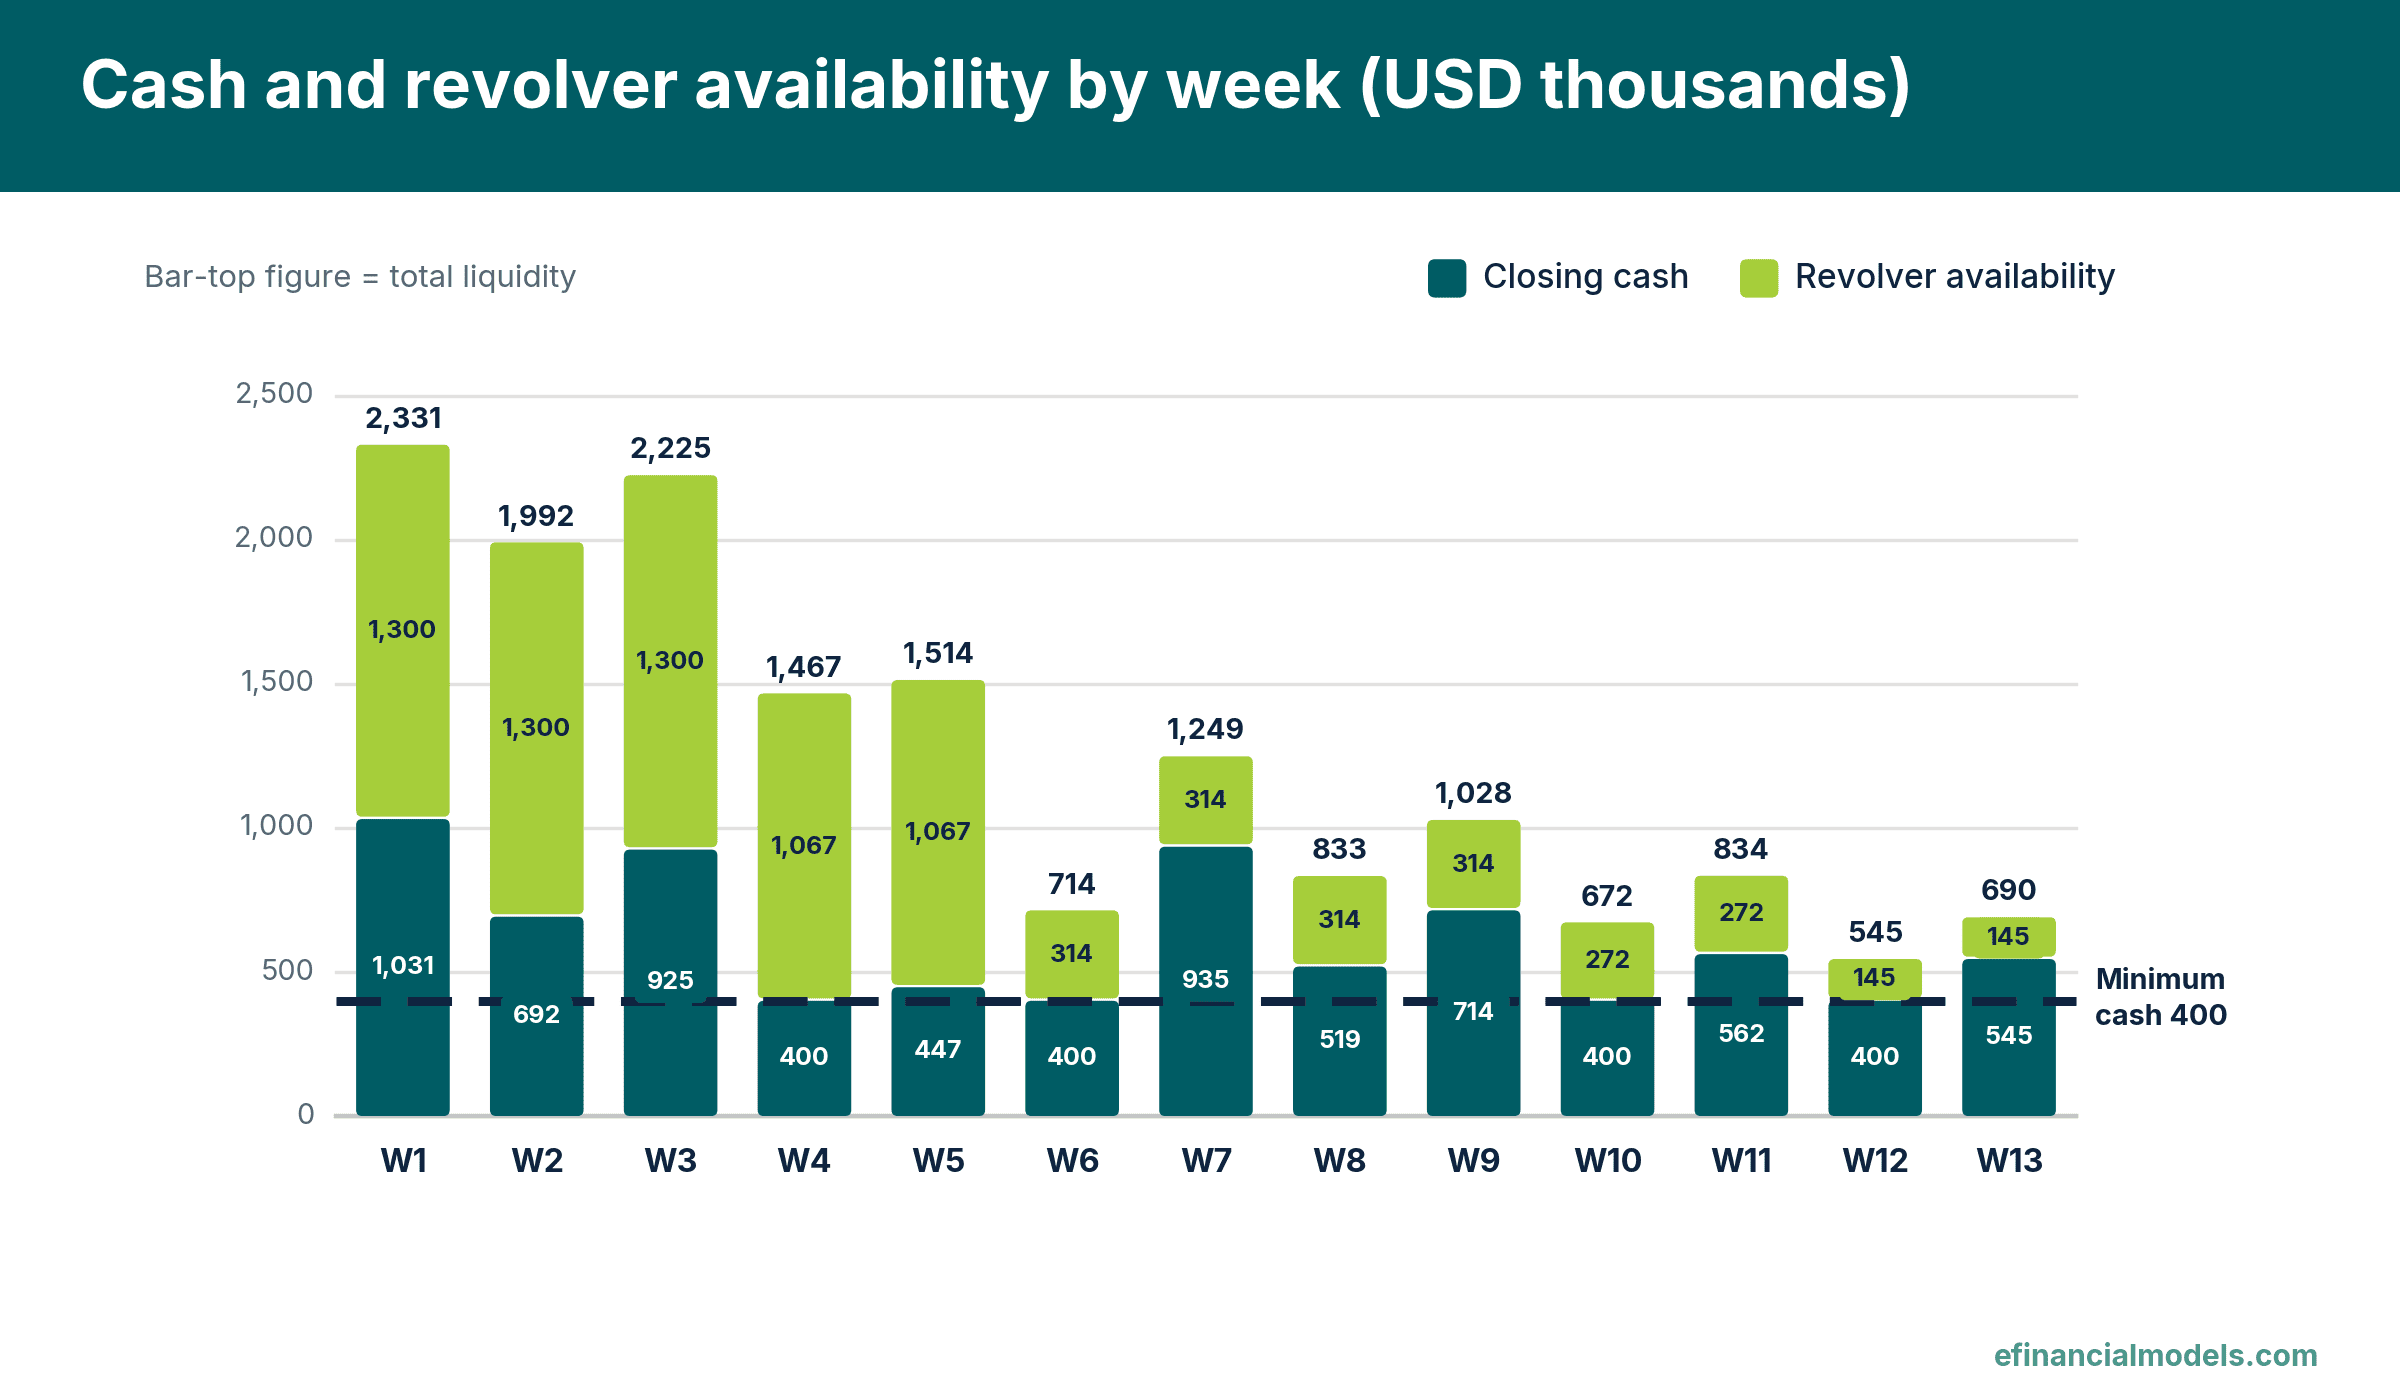
Liquidity shrinks as the revolver is drawn, and cash touches the covenant minimum in weeks 4, 6, 10 and 12. Source: eFinancialModels Analysis
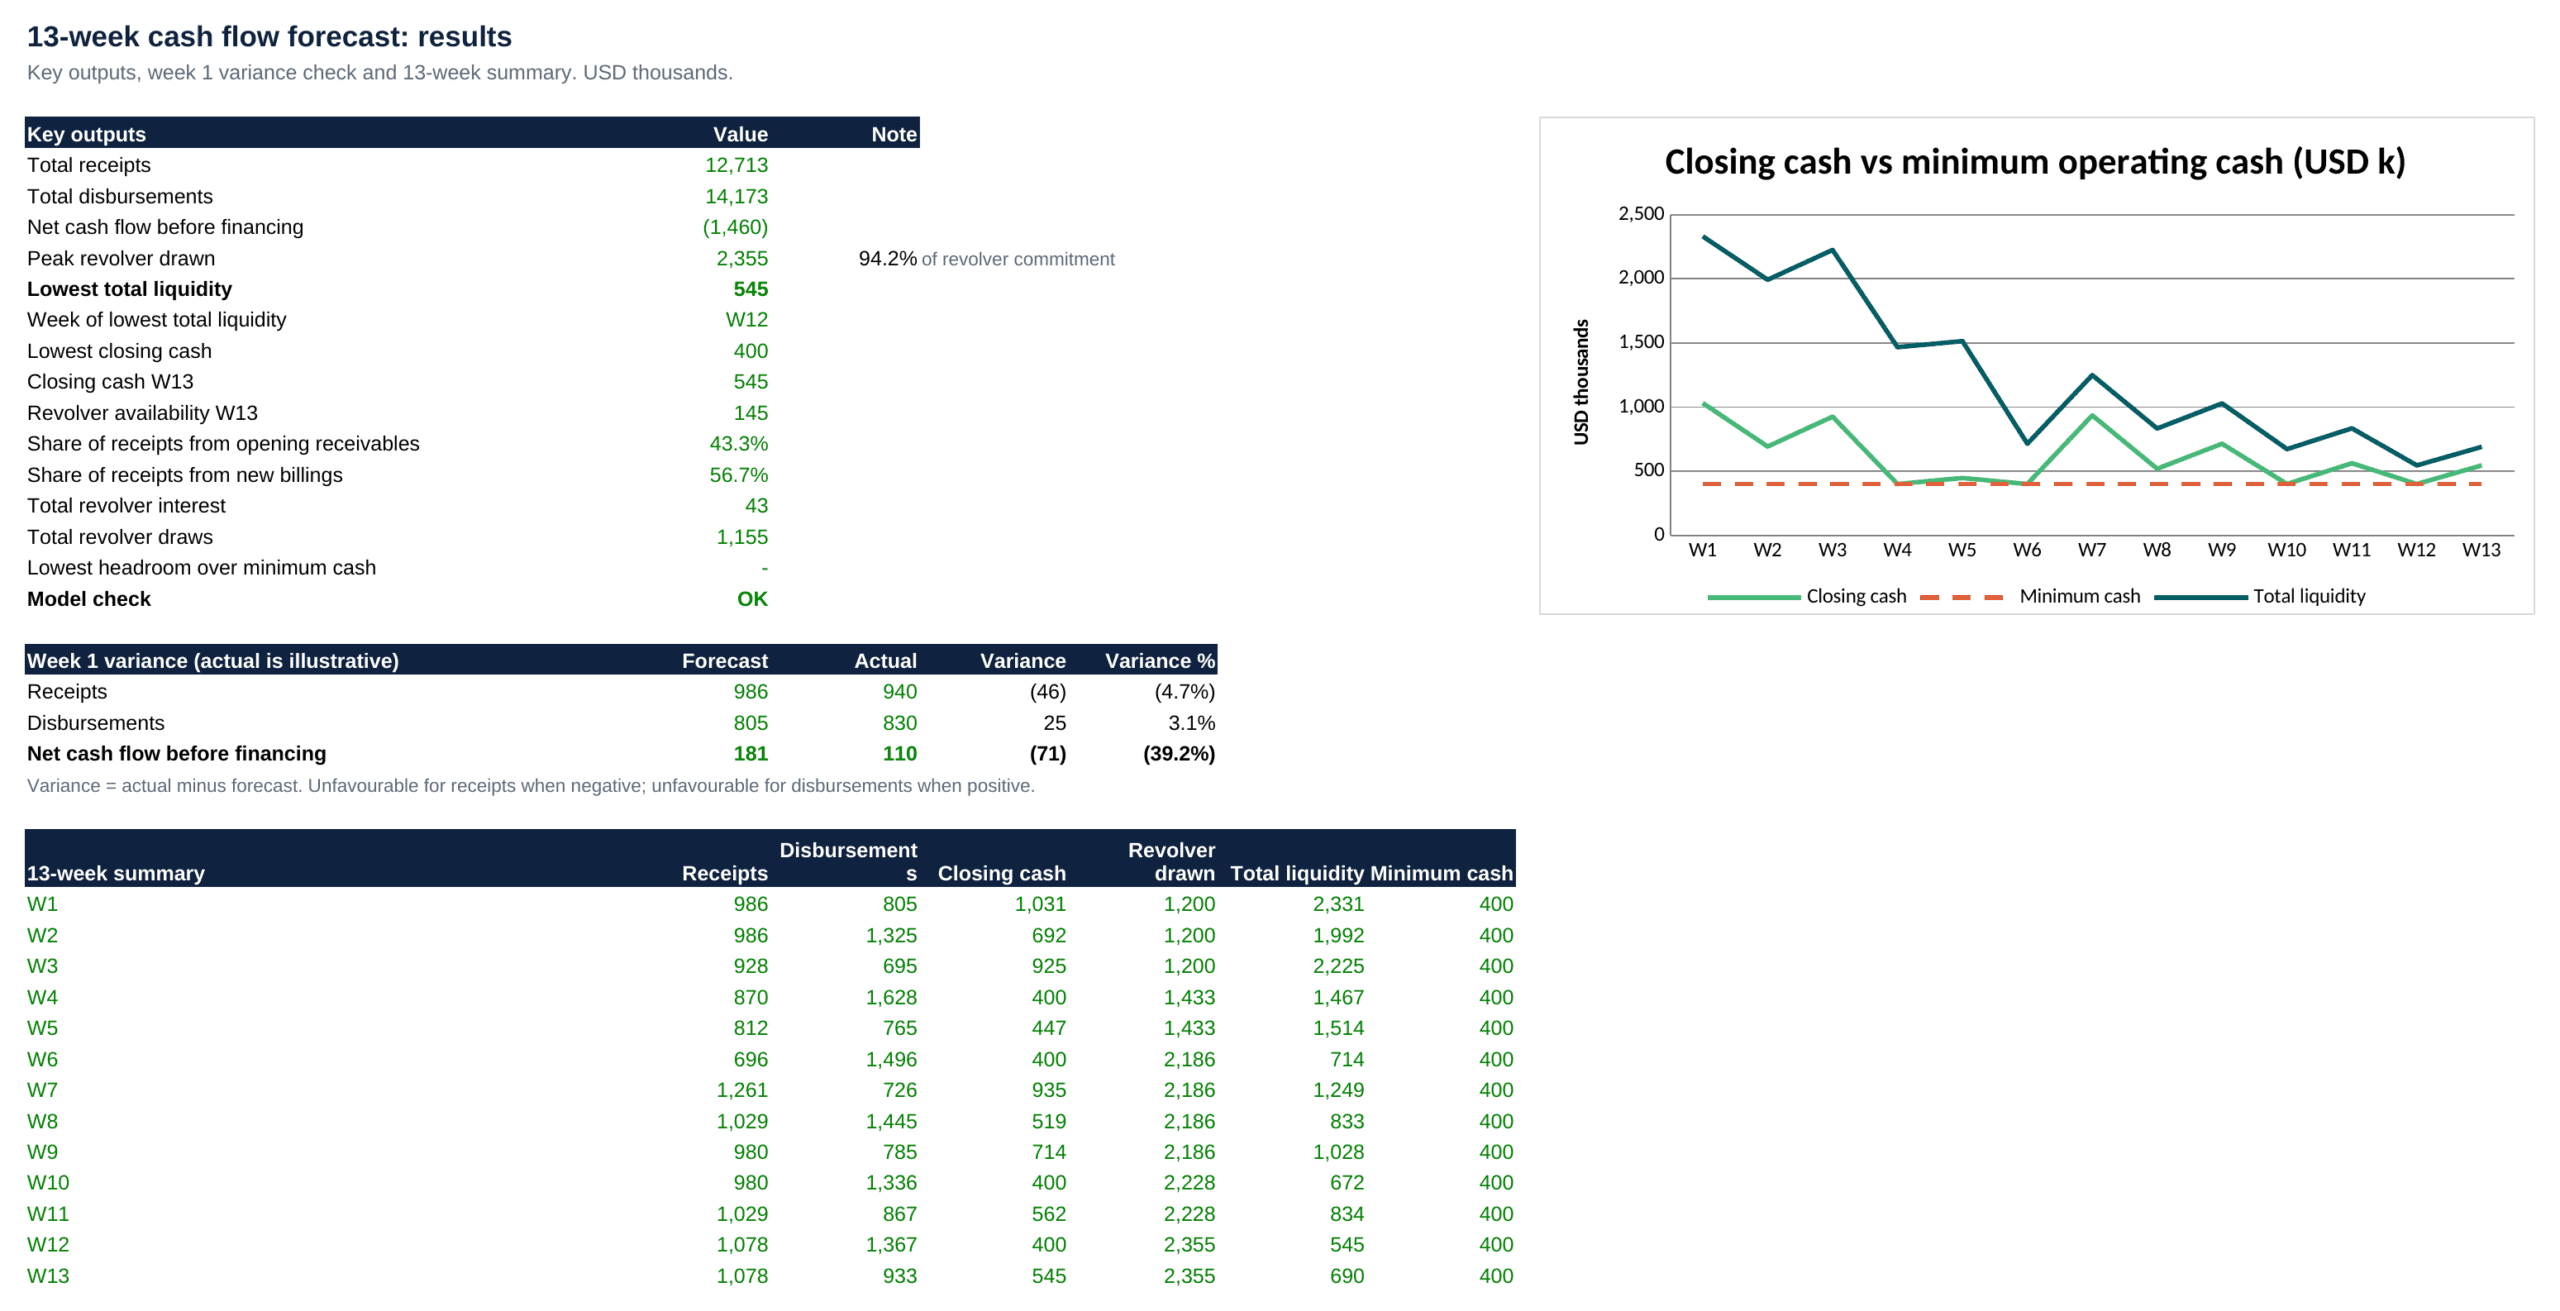
The results sheet gathers the headline cash and liquidity measures and the week 1 variance check. Source: eFinancialModels Analysis
The Total row of the table shows receipts of 12,713 and payments of 14,173, so the business spends 1,460 more than it collects before borrowing. Revolver draws of 1,155 in weeks 4, 6, 10 and 12 fund most of the gap, taking the balance from 1,200 to 2,355, or 94.2% of the commitment, and the remaining 305 comes from cash falling from 850 to 545. The lowest liquidity is 545 in week 12, and revolver interest over the quarter is 43. Interest accrues at 9.00% a year on the opening drawn balance of the payment week (1,200 in week 4, 2,186 in week 8 and 2,355 in week 13) for four, four and five weeks, and the model rounds it to whole thousands: 8, 15 and 20. The eFinancialModels debt amortization collection lists a guide and templates for building debt schedules like this one. Of total receipts of 12,713, collections from opening receivables are 5,510 (95% of 5,800), or 43.3%, and collections from new billings are 7,203, or 56.7%, so the forecast depends on billings made in the first seven weeks.
The same schedule shows the roll-forward. Suppose week 1 closes with actual receipts of 940 and actual payments of 830 (illustrative figures). Receipts miss the forecast of 986 by 46, or 4.7%, payments exceed the forecast of 805 by 25, or 3.1%, and net cash flow is 110 against a forecast of 181, a 71 shortfall.
Roll the forecast every week and explain the variance
Variance analysis compares each actual line with its forecast and records the cause. A practical routine has four moves: load the week’s actual receipts and payments; compare each line with the forecast; classify differences as timing, which reverses later, or permanent; then update the assumptions and add week 14. The eFinancialModels variance analysis collection lists budget-versus-actual and forecast variance templates.
Avoid two common mistakes
- Forecasting from the income statement. Sales and costs are not receipts and payments; use the receivables and payables ledgers.
- Collecting at invoice terms. Customers rarely pay on the due date, so use observed payment history.
Covenant definitions, borrowing-base limits, tax timing and any court-ordered budget format vary by agreement and jurisdiction. The lender’s counsel, a restructuring adviser or a tax adviser should confirm those parts before the forecast is shared.
Frequently Asked Questions
Who should own the 13-week cash flow forecast?
The controller or treasurer usually owns the file, because the bank data, ledgers and payment runs sit in that team. Sales, purchasing and payroll owners each supply their own expected dates and sign off the lines they control. Many turnaround programmes name one accountable person who presents the weekly variance to the lender or board, so that explanations come from the people closest to the cash.
How is it different from a monthly budget or a cash flow statement?
A budget plans profit by month for the year and a cash flow statement reports what already happened. The 13-week forecast looks only forward, uses weekly buckets and records cash on the date money moves, not the date a sale or cost is booked. That timing difference is why a company can show a profit in the budget and still miss a payroll run in week six.
Which items does the forecast usually leave out?
Non-cash entries such as depreciation, accruals and provisions never appear, because they do not move the bank balance. Items that do belong are often forgotten: sales tax and payroll tax remittances, annual insurance premiums, bonus payments, capital expenditure deposits, professional fees and customer refunds. A checklist of the bank statement categories from the last two quarters is a quick way to find them.
What if the forecast shows a shortfall that the revolver cannot cover?
Treat the first shortfall week as the deadline and work backwards. Typical levers include delaying discretionary capital expenditure, negotiating supplier payment plans, accelerating collections with early-payment incentives, and asking the lender for a temporary increase in the limit. Each lever should be modelled as its own line with a probability and a date, so the base case stays honest and the mitigation case is clearly separate.
Can a spreadsheet handle it, or is treasury software required?
A spreadsheet with live formulas is enough for most companies with one or a few bank accounts, and lenders generally accept it when the logic is transparent and the check cells reconcile. Treasury software starts to pay off when many entities, currencies or bank feeds make manual loading error-prone. The structure stays the same either way, so a clean spreadsheet is a good prototype for later automation.
Conclusion
A 13-week cash flow forecast works when it is built from the receivables and payables ledgers, tested against the lender’s minimum every week, and rolled forward with a written explanation of each variance. Finance teams that want to extend the forecast into longer-range planning can browse the eFinancialModels Cash Flow Analysis collection, which includes the guide How to Do a Cash Flow Analysis and Excel templates such as a cash flow planning tool and a multi-tranche debt schedule with a revolver.