0 ITEMS

Airbnb Spreadsheet Template: Model Revenue, Tax & ROI
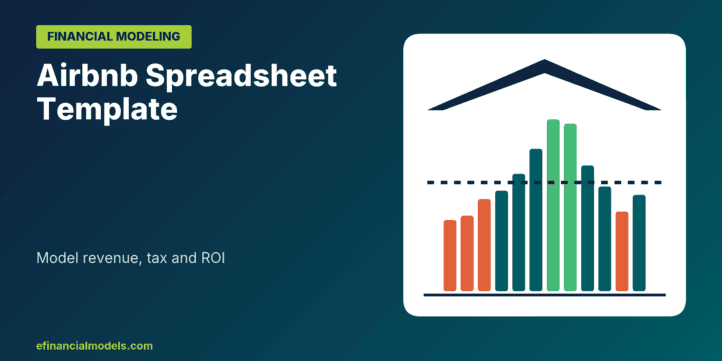
An Airbnb spreadsheet template should tie nightly rate, occupancy, costs, mortgage and tax into one live model, so a host sees profit and return before pricing or buying. The worked example below uses illustrative inputs for one self-managed furnished home, which earns USD 29,667 of net operating income and a 4.82% pre-tax cash-on-cash return in year 1.
Key Takeaways
- An Airbnb spreadsheet needs four linked parts: inputs, a monthly revenue build, costs with financing, and scenarios that test occupancy.
- The illustrative example, a self-managed furnished home with no capital reserve, earns USD 29,667 of net operating income and a 4.82% pre-tax cash-on-cash return.
- Revenue swings by month with occupancy and rate multipliers, so a model needs seasonality instead of one average nightly rate.
- Mortgage interest and an assumed 39-year depreciation cut year-1 taxable income to USD 767, a US federal illustration at 24% with state tax excluded.
- Break-even occupancy of 55.8% sits about 8 percentage points below the 64.1% base case, a thin margin that scenarios expose.
An Airbnb spreadsheet template needs four sheets that feed each other
An Airbnb spreadsheet template is a workbook that turns booking assumptions into profit and return. It works when formulas link four parts: an inputs sheet, a monthly revenue build, a block for costs and financing, and a scenario table.
The inputs sheet holds every assumption in one place. The revenue build multiplies nights booked by the rate for each month. The cost block subtracts fees, cleaning, supplies, fixed costs and the mortgage. The scenario table shifts occupancy to find where cash flow reaches zero. Return on investment (ROI) measures profit against the money put in, and this article uses the pre-tax cash-on-cash return as its ROI measure.
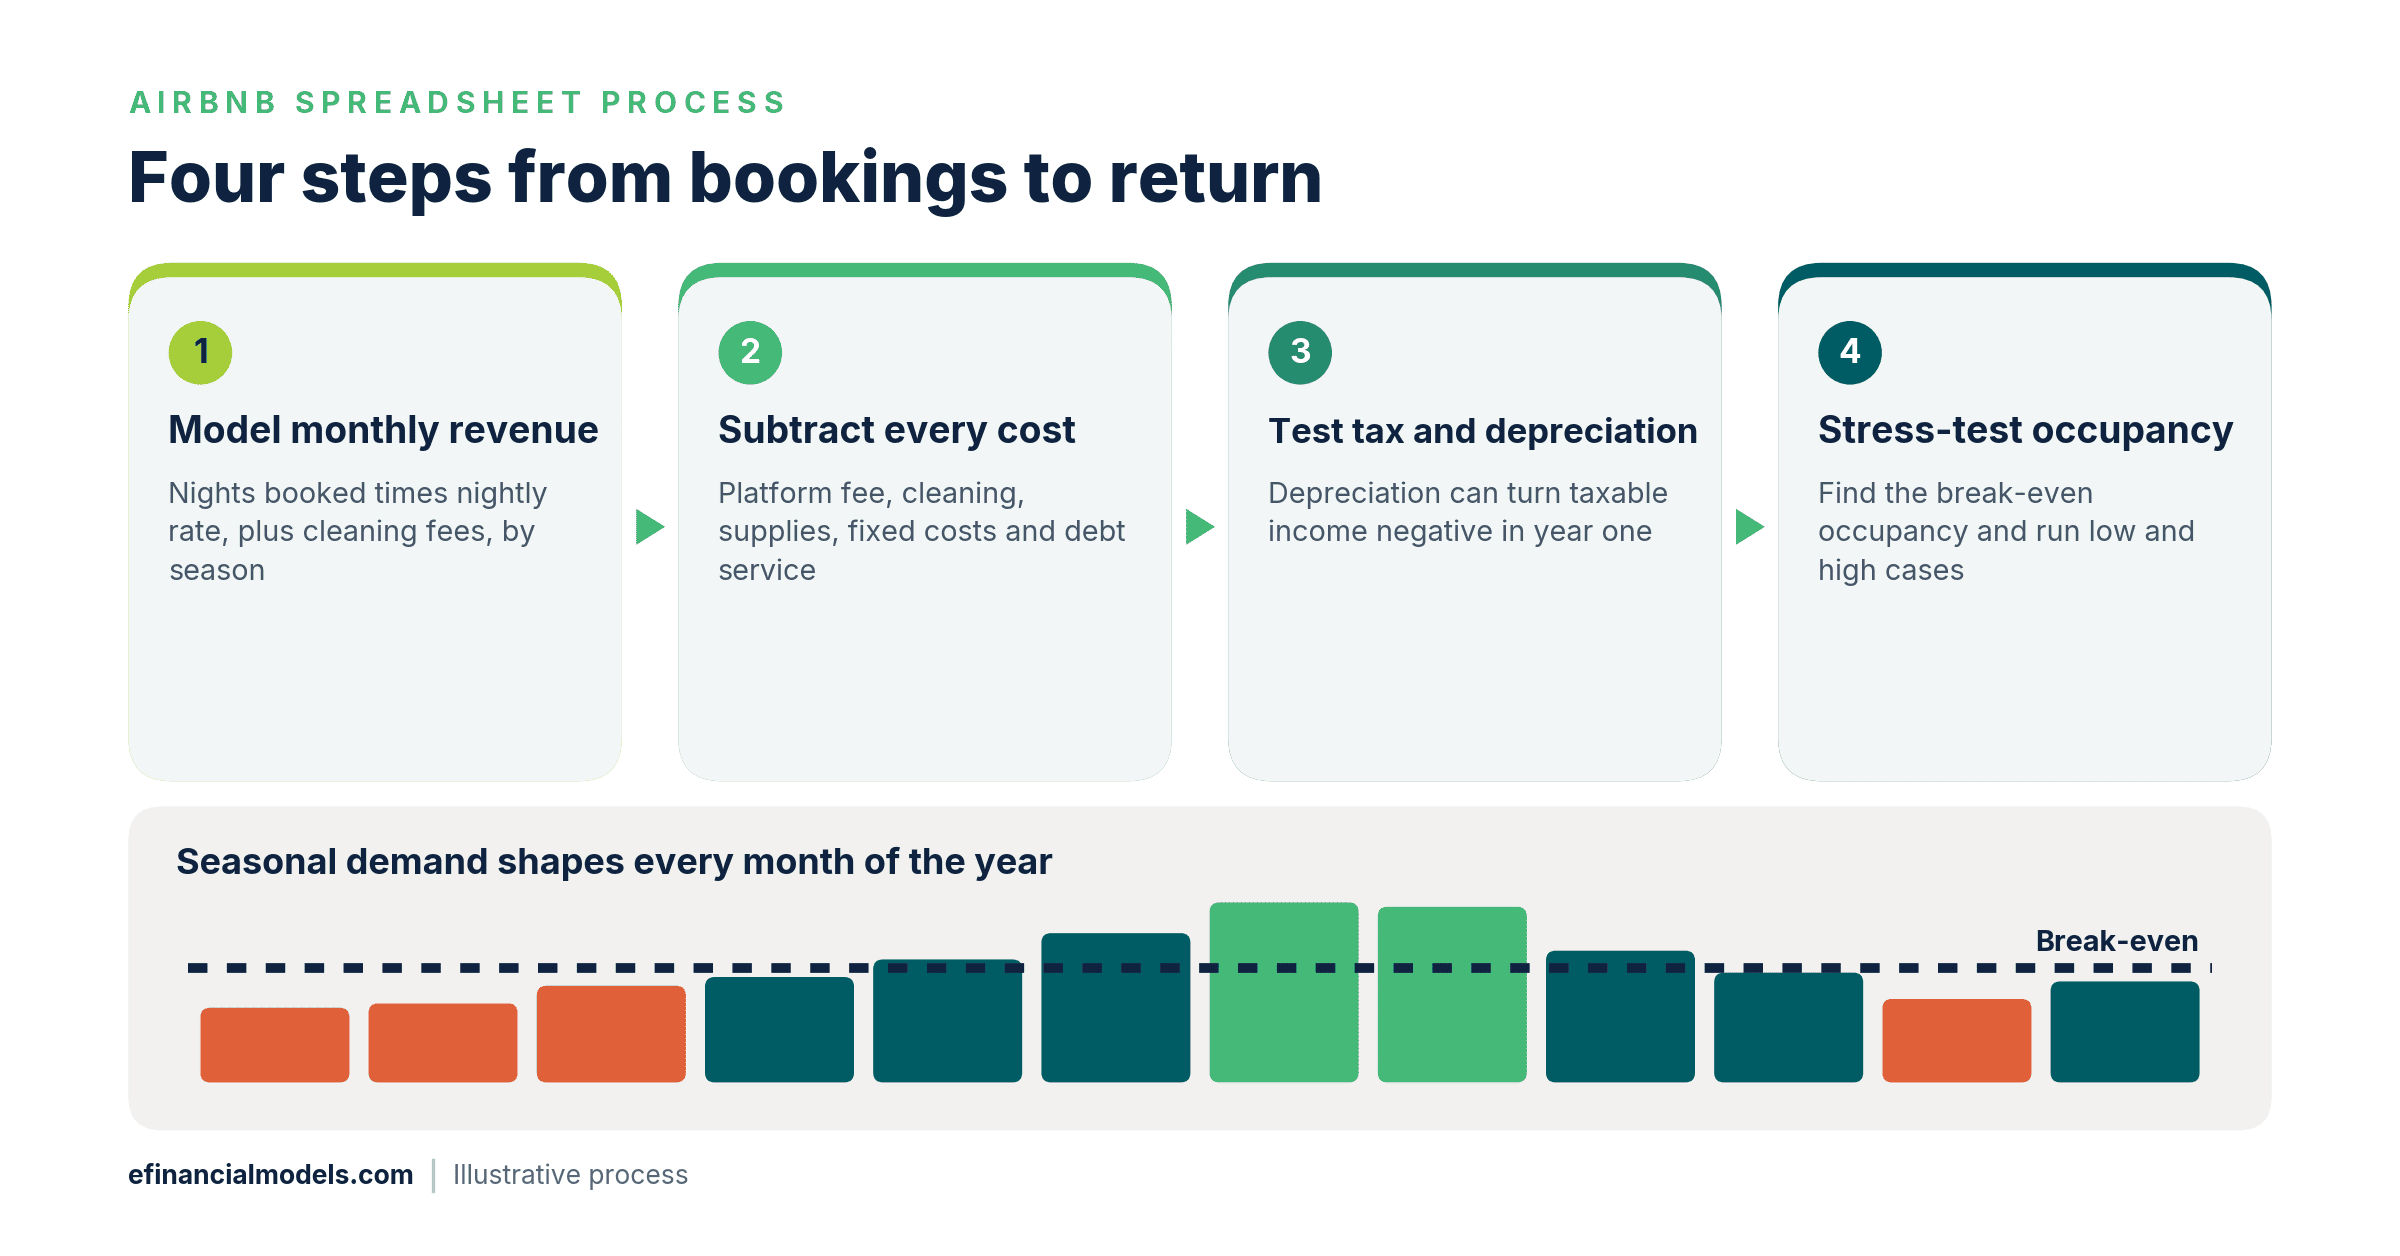
The four-step flow of an Airbnb spreadsheet, with seasonal demand and a break-even line shown below. Source: eFinancialModels Analysis.
Readers who want a finished structure can browse the eFinancialModels Airbnb category, which holds a collection of short-term rental models built on this same logic.
Revenue is nights booked times a seasonal rate, not one average price
The average daily rate (ADR) is the gross booking value divided by the nights booked. In its third-quarter 2026 shareholder letter, Airbnb reported a global ADR of $179, up 4% on the same quarter of 2025 (Airbnb Q3 2026 shareholder letter). That figure mixes every market and property type, and it is not a like-for-like match for the model’s base nightly rate, which excludes cleaning fees. It works as a rough sanity check, never as the forecast.
Rates differ by market and month, so the model applies a rate multiplier and an occupancy percentage to each month separately. Occupancy is the share of nights guests book.
Platform fees come off the top. Airbnb’s help center states that most hosts pay a 3% service fee, although some hosts pay more (Airbnb Help Center, service fees, 2026). The fee input should match the structure the listing uses. The worked example applies the 3% rate to nightly revenue plus cleaning fees, and it assumes self-management, so it carries no property management fee or capital reserve.
Worked example: the inputs sheet drives every number
This worked example uses illustrative figures for one furnished two-bedroom home. It is not market data. The base nightly rate is USD 195, the average stay is 3.5 nights, and guests pay a USD 85 cleaning fee per stay while the cleaner costs USD 75. Supplies take 3% of gross revenue and repairs 5%. Utilities cost USD 450 a month, insurance USD 2,400 a year, and property tax is 1.1% of the price.
The purchase price is USD 400,000 with a 20% down payment, 3% closing costs and USD 20,000 of furnishing. The mortgage rate is 6.5% over 30 years. Occupancy runs from 45% in January to 88% in July, with rate multipliers from 0.90 to 1.20, as the table lists.
| Month | Occupancy | Rate multiplier |
|---|---|---|
| January | 45% | 0.90 |
| February | 50% | 0.90 |
| March | 58% | 0.95 |
| April | 62% | 0.95 |
| May | 68% | 1.00 |
| June | 78% | 1.10 |
| July | 88% | 1.20 |
| August | 86% | 1.20 |
| September | 70% | 1.00 |
| October | 60% | 0.95 |
| November | 48% | 0.90 |
| December | 55% | 1.05 |
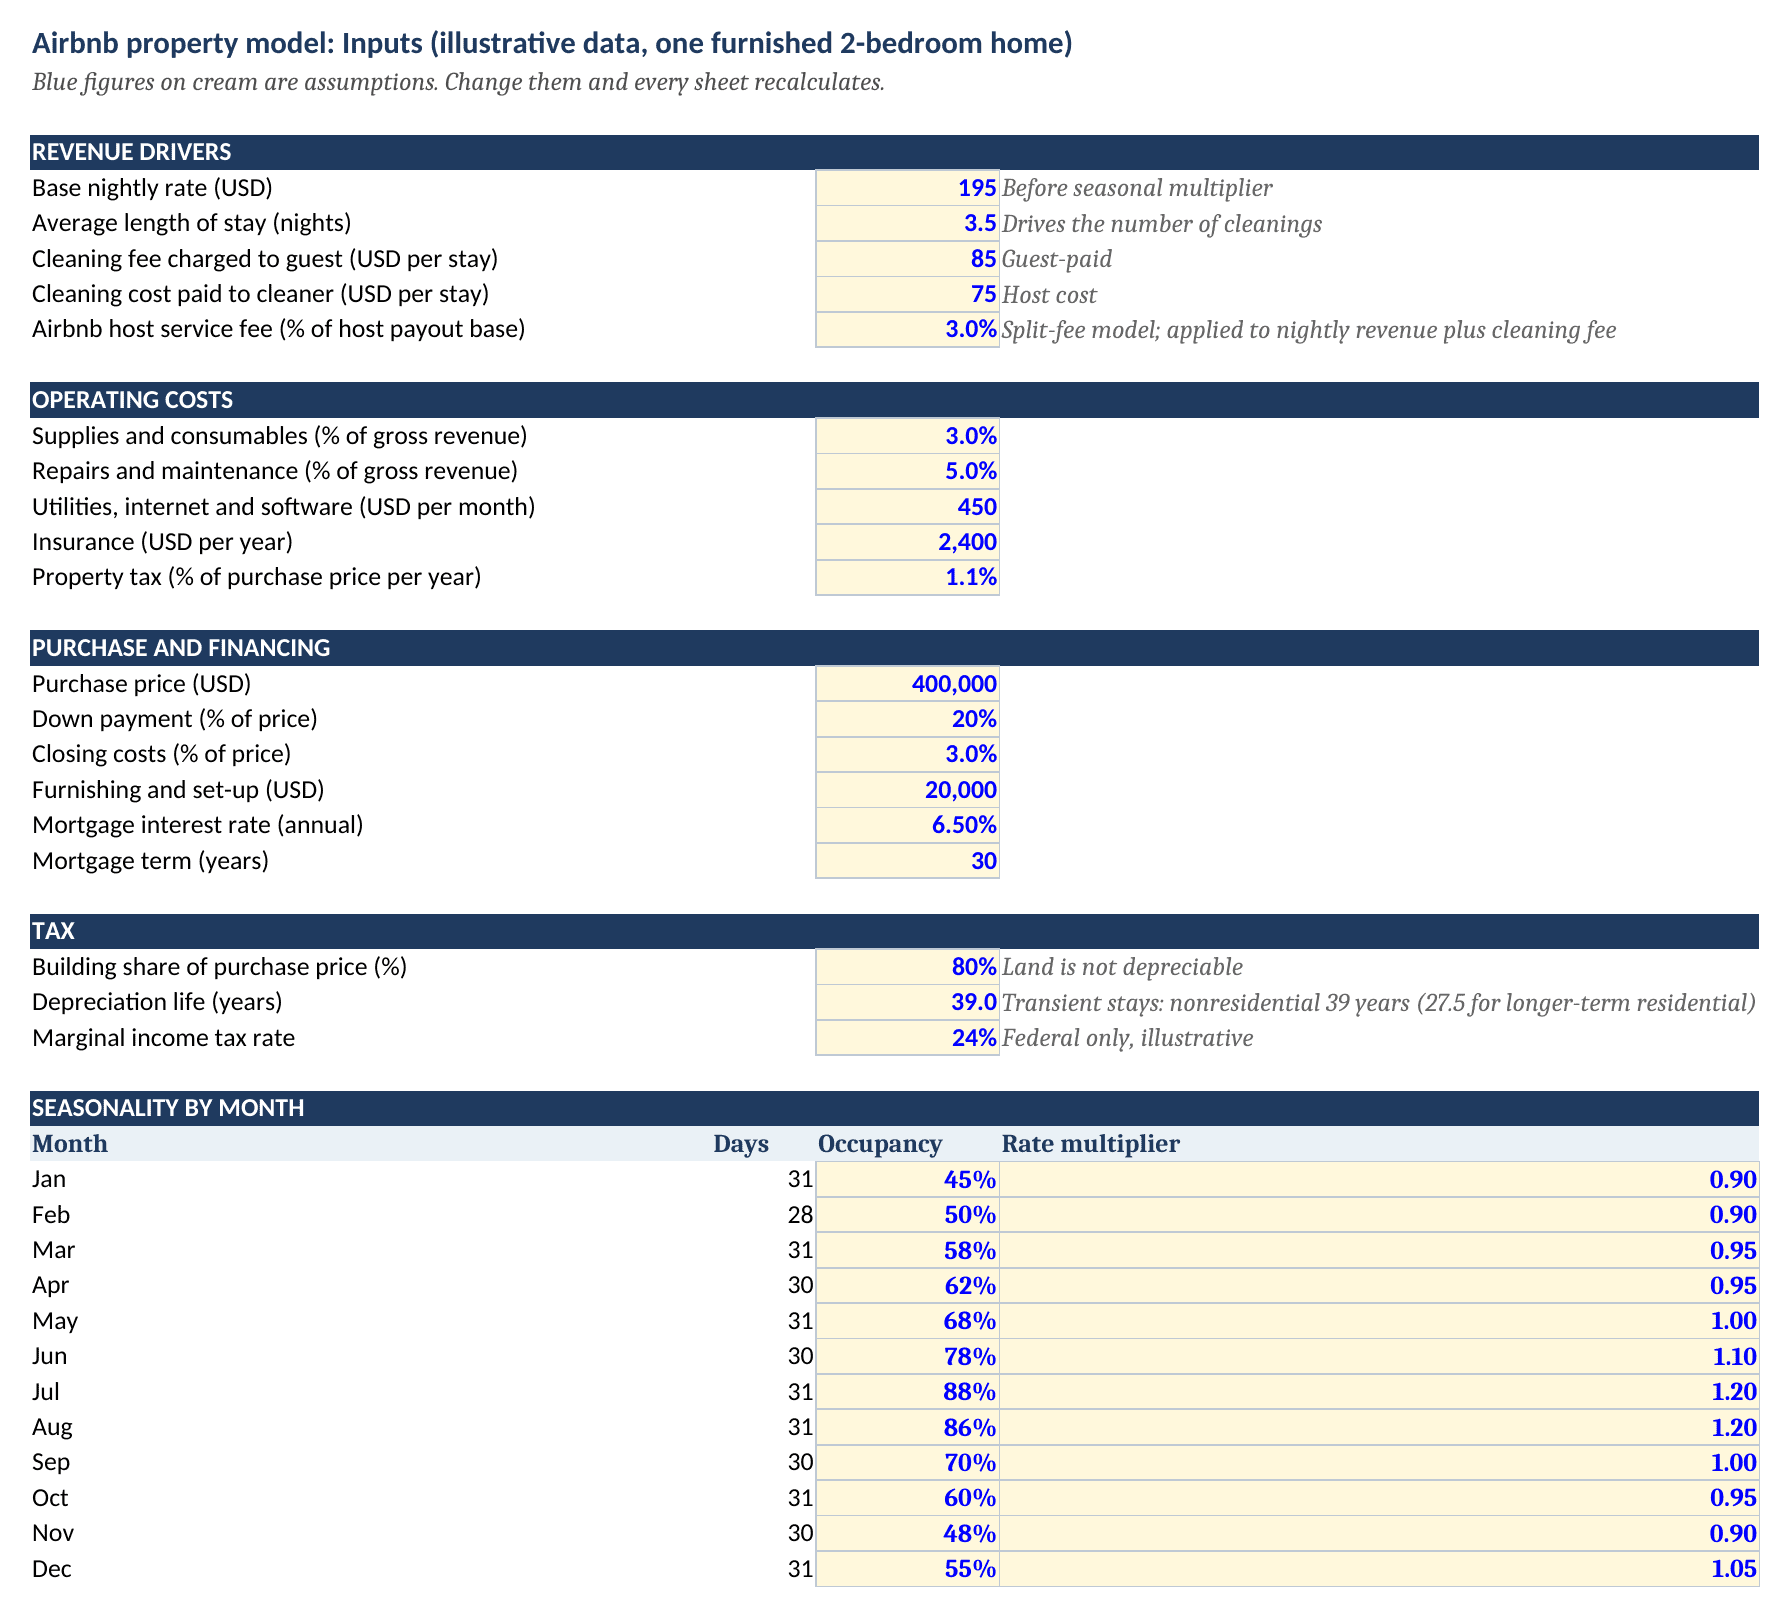
The inputs sheet: blue figures on cream cells are the only values a user changes. Source: eFinancialModels Analysis.
Worked example: the monthly calculation gives USD 29,667 of net operating income
Net operating income (NOI) is revenue minus operating costs, before mortgage payments and income tax. January shows the method. The model assumes 45% occupancy over 31 days, which is an expected average of 13.95 nights, because the sheet works with averages rather than whole bookings. At a rate of USD 195 times the January multiplier of 0.90, or USD 175.50 a night, nightly revenue is USD 2,448.
Stays equal nights divided by 3.5, or about 3.99, so cleaning fees add USD 339 and gross revenue reaches USD 2,787. The 3% platform fee takes USD 84, cleaning costs USD 299, and supplies and repairs at 8% take USD 223. Fixed costs are USD 450 plus USD 200 of monthly insurance plus USD 367 of monthly property tax, or USD 1,017. January NOI is therefore about USD 1,165.
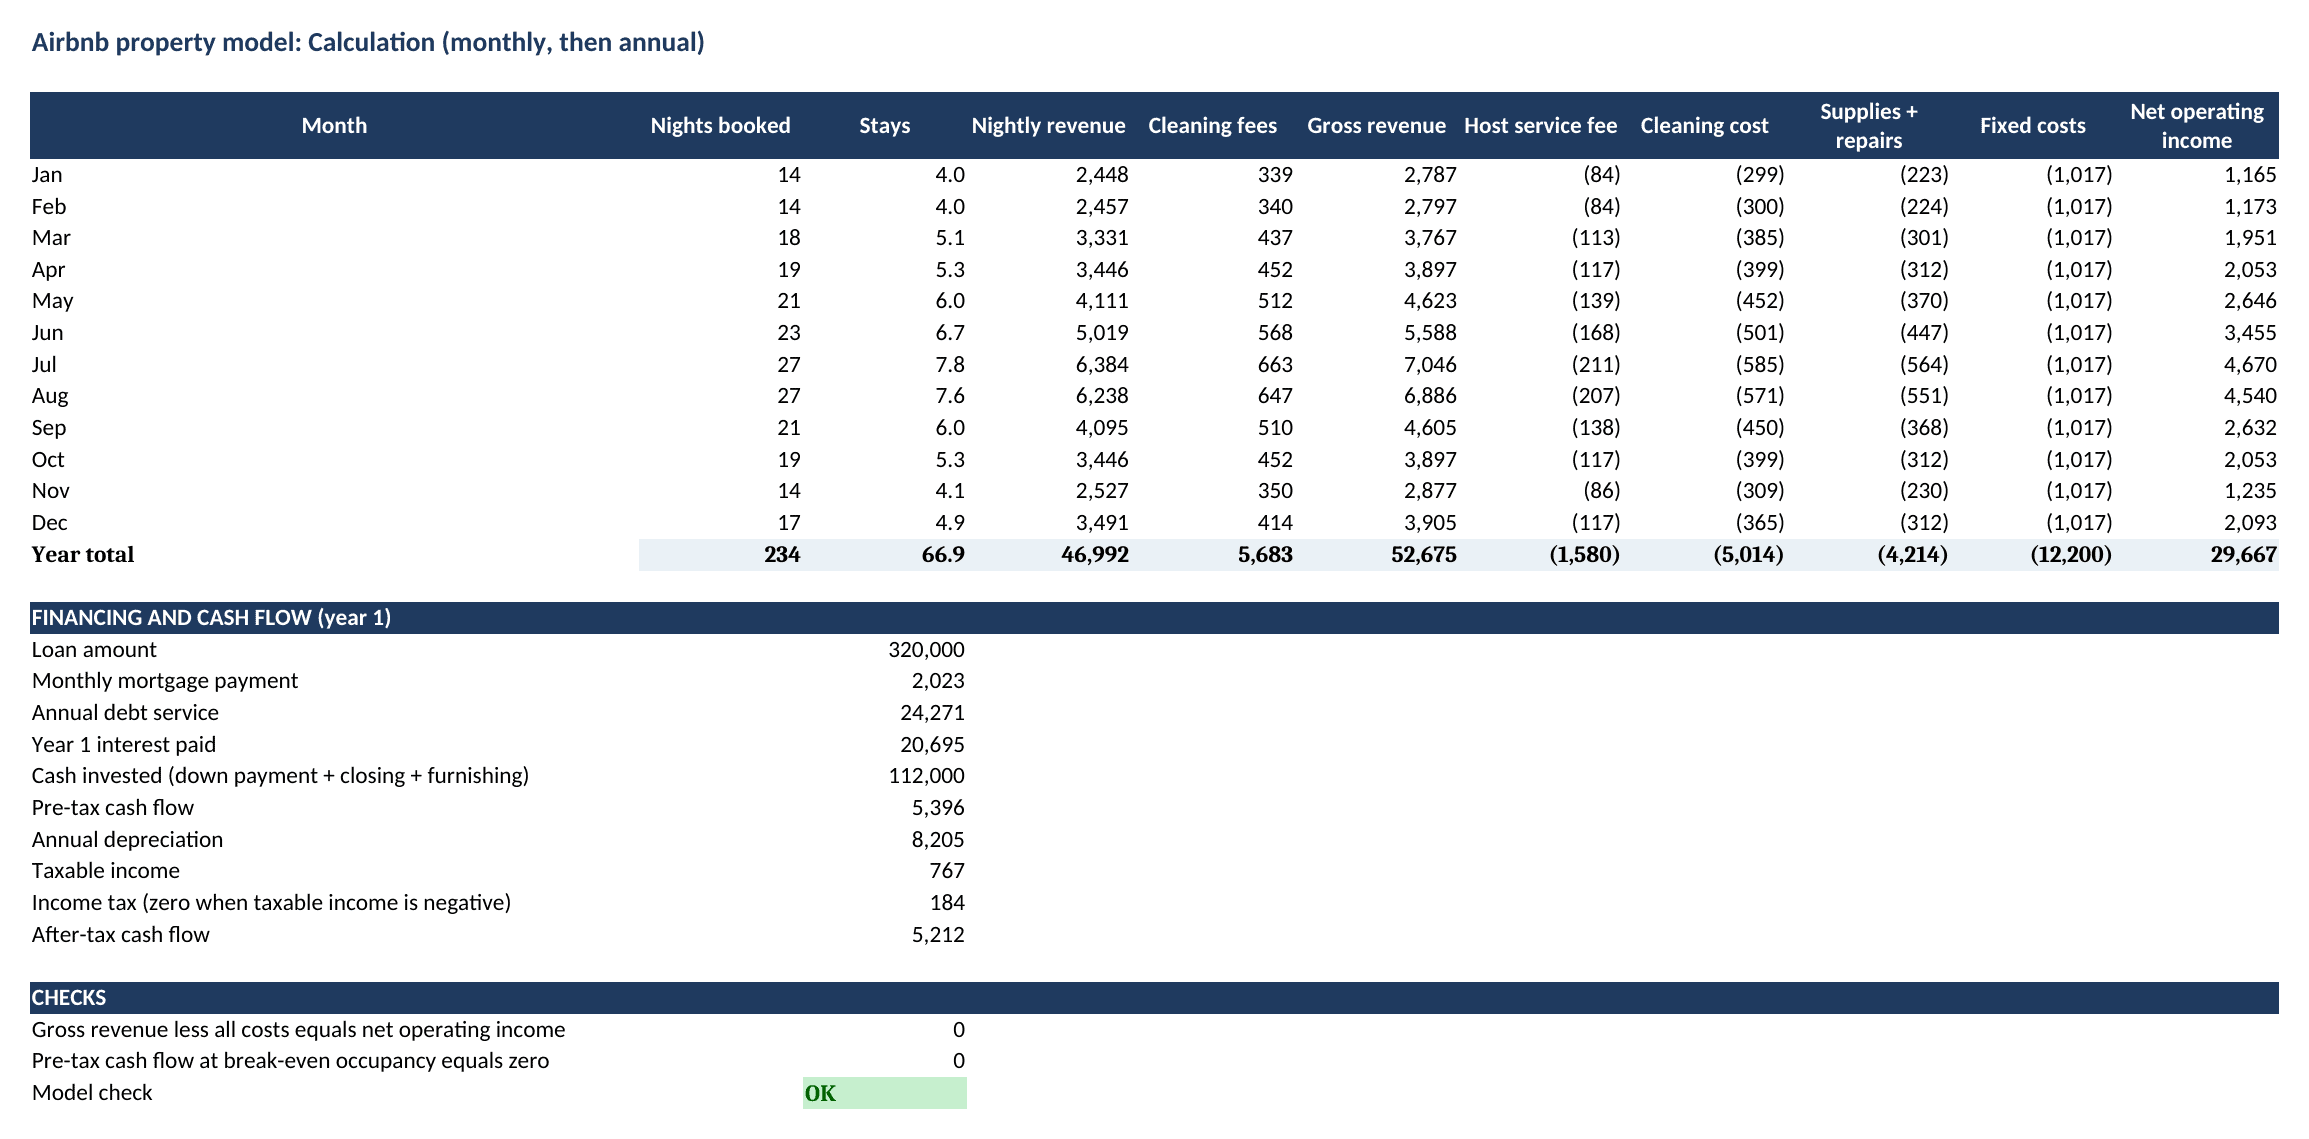
The calculation sheet runs the same formulas for all twelve months, then adds financing, tax and a check cell. Source: eFinancialModels Analysis.
Summed over twelve months, gross revenue is USD 52,675 and NOI is USD 29,667. The capitalization rate, which is NOI divided by the purchase price, equals 7.42%. The loan is USD 320,000, so the mortgage payment is USD 2,023 a month and debt service, meaning the loan payments of the year, is USD 24,271. Pre-tax cash flow is NOI of USD 29,667 less debt service of USD 24,271, which leaves USD 5,396.
Cash invested is the down payment of USD 80,000 (20% of USD 400,000), closing costs of USD 12,000 (3%) and furnishing of USD 20,000, which adds up to USD 112,000. Cash-on-cash return, the annual pre-tax cash flow divided by cash invested, is therefore USD 5,396 divided by USD 112,000, or 4.82%.
Taxes depend on how income is classified, and depreciation is the other lever
This section covers United States federal rules only, and hosts elsewhere should ask a local tax adviser. The Internal Revenue Service (IRS) sets rules that change what a host reports. Rent from a home used as a residence and rented for fewer than 15 days in a year does not count as income (IRS Topic 415). Above that threshold, how income is classified depends on the services the host provides, so the classification belongs in the model as an input that a tax adviser confirms.
Depreciation, the deduction that spreads a building’s cost over its recovery period, is the other large tax lever. The recovery period depends on how the property is classified. The example below assumes 39 years, the more cautious choice for a home rented to transient guests, and treats 27.5 years as the alternative for longer-term residential rentals. Both lives are assumptions that a tax adviser should confirm. Occupancy taxes are a separate matter: Airbnb collects and remits certain occupancy taxes on behalf of hosts (Airbnb Help Center, occupancy taxes), and a host should still confirm what applies to the listing.
Worked example: depreciation shrinks the year-1 tax bill
Assume 80% of the USD 400,000 price is building and 20% is land, which is not depreciable. Yearly depreciation is USD 400,000 times 0.80 divided by 39, or about USD 8,205. Year-1 mortgage interest is USD 20,695.
Taxable income equals NOI of USD 29,667 minus interest of USD 20,695 minus depreciation of USD 8,205, which is USD 767. At an assumed 24% marginal rate, the tax is USD 184 (24% of USD 767 is 184.08 before rounding), so after-tax cash flow is about USD 5,212 (USD 5,396 minus USD 184). With the 27.5-year life, depreciation would be about USD 11,636, taxable income negative USD 2,664 and tax zero. With no depreciation at all, taxable income would be USD 8,972 and tax about USD 2,153.
The example is simplified. It depreciates the building only, leaves out the USD 20,000 of furnishing and the USD 12,000 of closing costs, and ignores state tax, passive loss limits and the eventual sale. A tax adviser should confirm the treatment.
Worked example: occupancy scenarios put break-even at 55.8%
Average occupancy in the base case is 64.1%, which is 234 booked nights out of 365. Revenue, platform fees, cleaning, supplies and repairs all move with booked nights, so they form a variable contribution of USD 41,867 (revenue USD 52,675 minus USD 1,580 of fees, USD 5,014 of cleaning and USD 4,214 of supplies and repairs). Fixed costs of USD 12,200 plus debt service of USD 24,271 total USD 36,471.
Each percentage point of occupancy carries about USD 653.15 of that contribution (41,867 divided by 64.1). Break-even occupancy is the costs that must be covered divided by that amount: 36,471 divided by 653.15 gives 55.84%, or 55.8% rounded. The scenarios and break-even use this average contribution per point, a simplification that shifts every month by the same amount. The sheet then shifts all months together by 10 percentage points. At 54.1% occupancy, pre-tax cash flow is about negative USD 1,100 and cash-on-cash return is about negative 1.0%. At 74.1%, cash flow is about USD 11,900 and the return is about 10.6%.
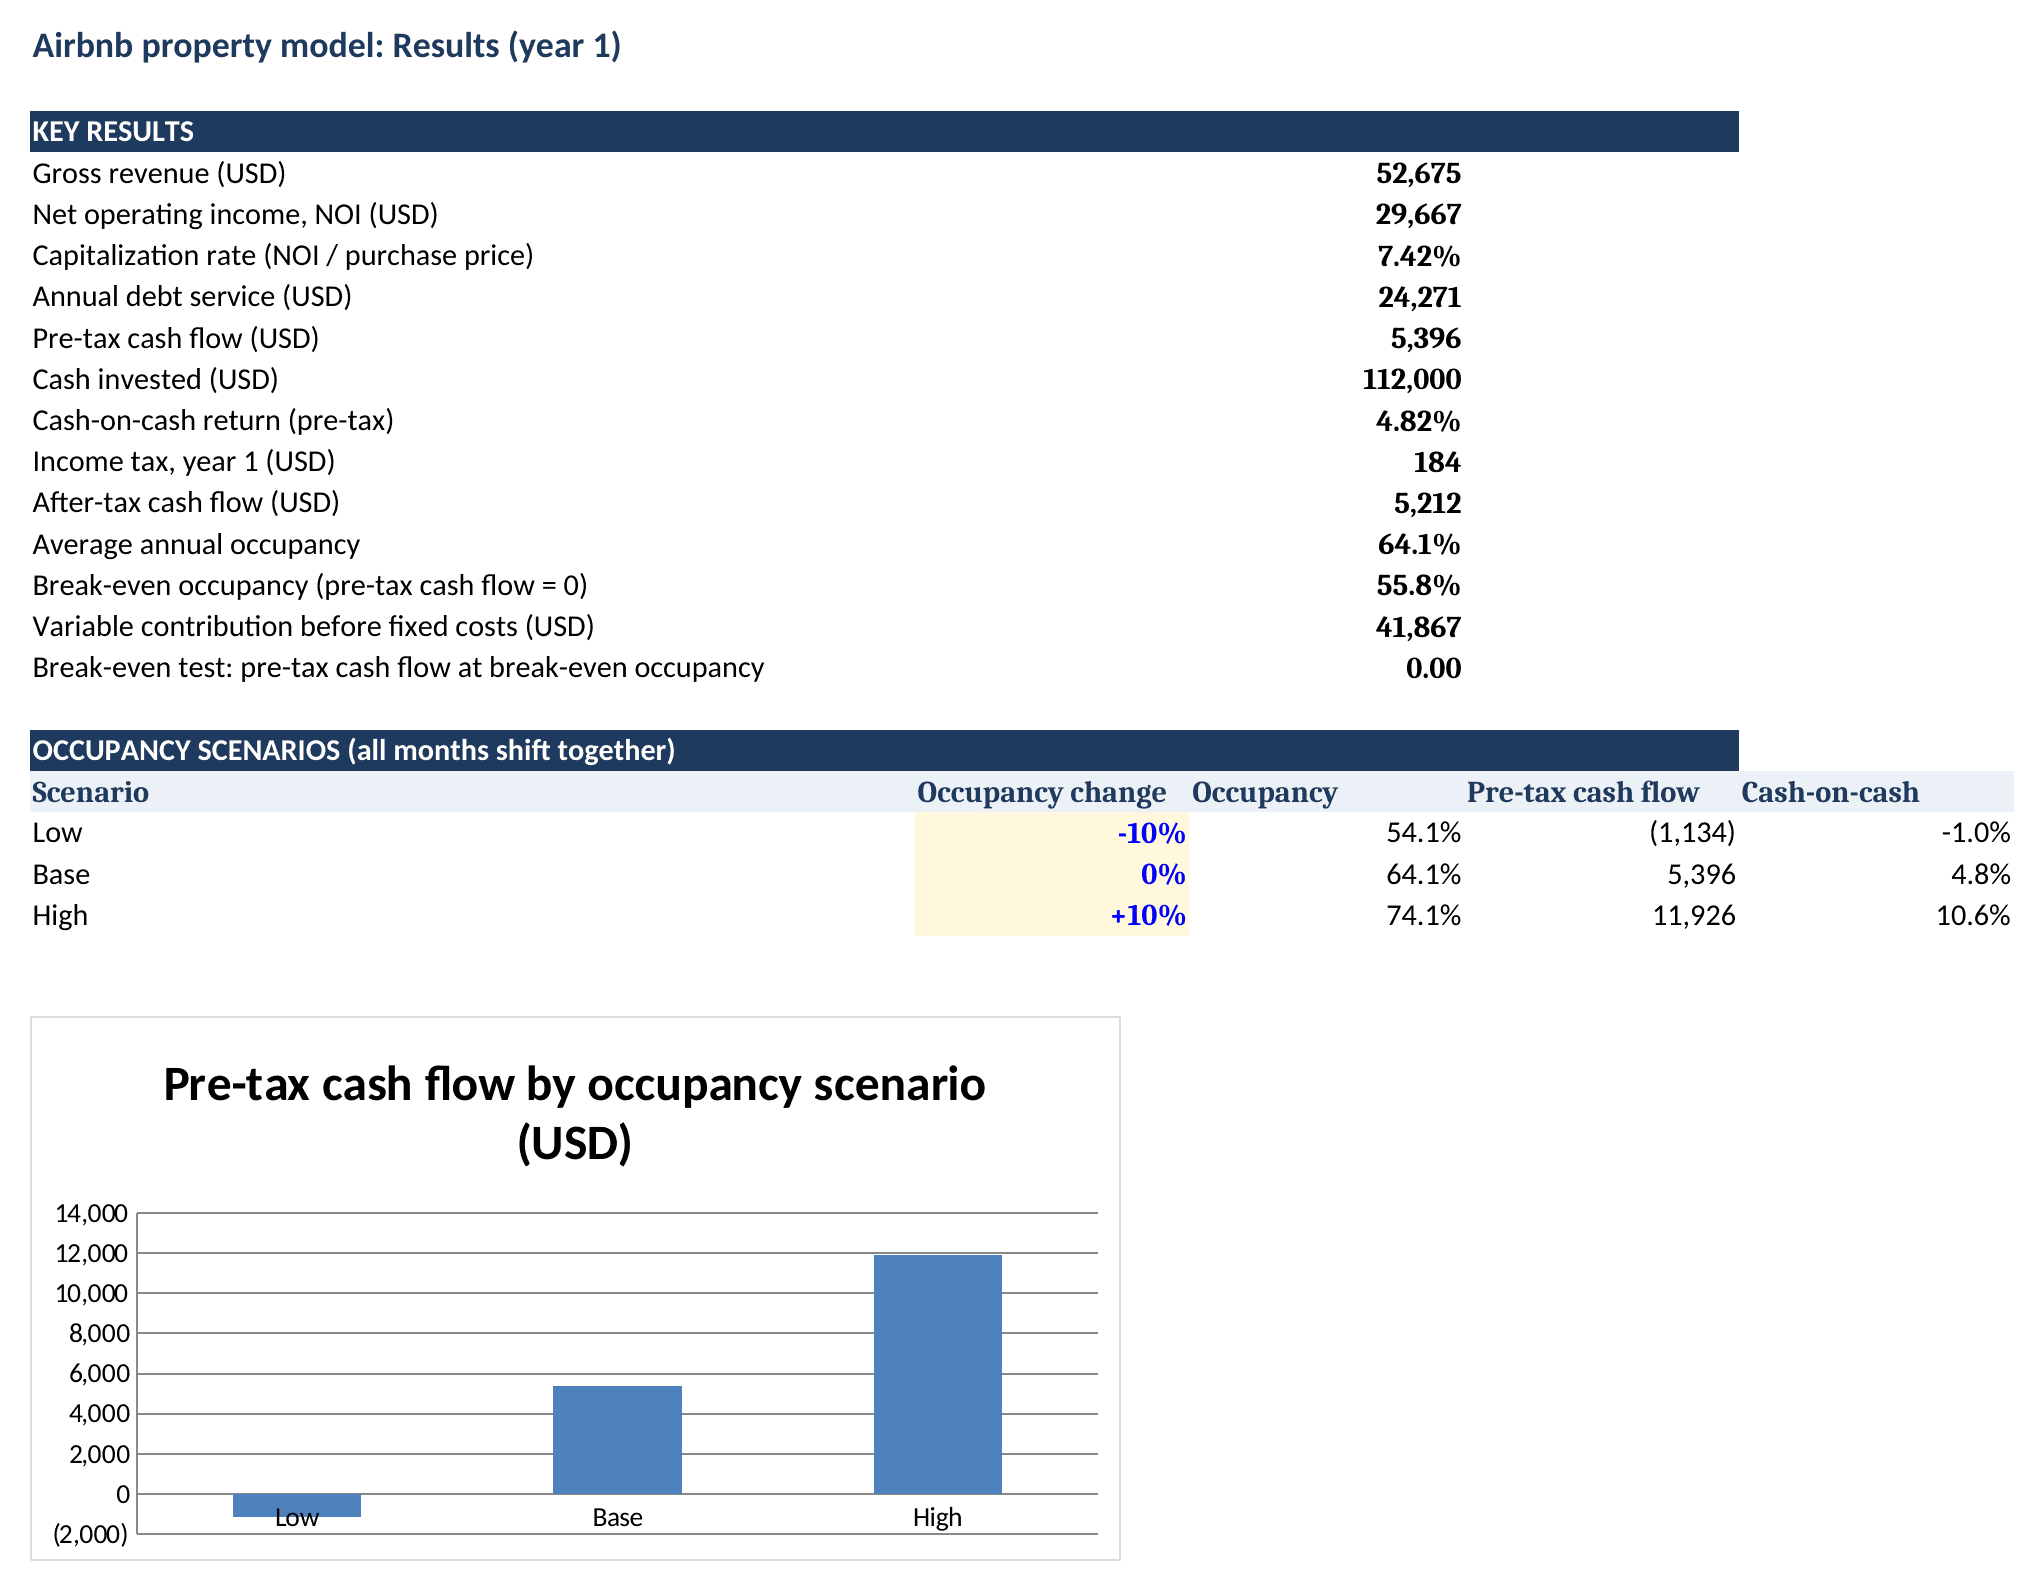
The results sheet: key results, three occupancy cases and a column chart of pre-tax cash flow. Source: eFinancialModels Analysis.
A ten-point swing in occupancy moves cash flow by about USD 6,500 in either direction. That sensitivity tells a buyer how much risk the purchase carries. The pre-tax cash-on-cash figure, this article’s ROI measure, can turn negative quickly.
Three kinds of host need three versions of the same workbook
| Host type | Extra sheet | Main question answered |
|---|---|---|
| New host | Purchase, loan and set-up costs | Is the break-even occupancy realistic? |
| Multi-property operator | One tab per unit, rolled into a portfolio total | Which unit drags down the portfolio? |
| Tax planner | Depreciation schedule and income classification | How much of NOI is taxable this year? |
The rental income tag page and the break-even tag page collect eFinancialModels resources for these needs.
Frequently Asked Questions
How many months of data does an Airbnb forecast need?
A new listing has no history, so the first forecast leans on the nightly rates and booking calendars of similar local homes. Twelve months of pattern is the minimum for seasonality, because one summer cannot show winter demand, and a second year confirms whether the pattern repeats. Once the listing has bookings, replace comparable-based inputs with actuals month by month, and keep the original assumptions in a separate column.
Should cleaning fees count as revenue or as a pass-through?
Cleaning fees paid by guests are income to the host, and cleaning paid to a cleaner is a cost, so both belong in the model. Separate lines beat netting, because a shorter stay means more turnovers, so cleaning cost rises faster than nightly revenue. Both lines reveal whether the fee covers the work, and a host who raises the fee can test the effect on bookings in the scenario table.
Is cash-on-cash return or the capitalization rate better for comparing properties?
The capitalization rate ignores financing, so it compares two properties on operations alone. Cash-on-cash return includes the loan, so it shows what the buyer’s own cash earns. A fair comparison uses both: the first says whether the property performs, the second whether this financing helps. A strong property can still return little cash when the mortgage is expensive, which is why lenders and investors ask for both numbers.
Conclusion
An Airbnb spreadsheet template earns its place when it links rate, occupancy, costs, financing and tax, and when it shows break-even before the purchase. Hosts and investors who want a ready structure with a 10-year monthly forecast, an income statement, a balance sheet and a cash flow statement can use the eFinancialModels Single Airbnb Rental Unit Financial Model, which includes inputs for daily rate, occupancy, seasonality and cleaning fees and reports cash-on-cash yield and payback period.