0 ITEMS

Is an Aquaponics Startup Profitable? A Break-Even Model

An aquaponics startup can cover its monthly operating costs within 12 to 20 months in an illustrative, pre-tax, undiscounted model of an 856 m2 farm, yet repaying the investment takes about 7.7 years in the base case, from 5.5 years with premium prices to more than 10 years in weaker scenarios, so profit is conditional on selling price, electricity cost and ramp-up speed.
Key Takeaways
- In one self-reported survey, 31% of aquaponics operators reported a profit in the previous 12 months, so profit must be modeled, not assumed.
- In the worked example, monthly operating cash flow turns positive between month 12 and month 20, long before the investment is repaid.
- Payback ranges from 5.5 years with premium prices to beyond 10 years with lower prices or electricity costing half again as much.
- Peak cash need, the deepest cumulative cash deficit, exceeds the upfront funding because losses continue during ramp-up, so funding must cover the whole dip.
- Selling price, electricity cost and ramp-up speed each shift the payback date materially, so each deserves its own scenario.
Only 31% of Surveyed Aquaponics Operators Reported a Profit
Aquaponics raises fish and grows plants in one recirculating water system, so fish waste feeds the crops. Heavy upfront spending is why lenders and investors ask for a break-even analysis before they commit.
In an international survey of aquaponics operators reported by Love and colleagues in the journal Aquaculture, 31% of respondents reported being profitable in the previous 12 months, while 55% predicted profitability in the next 12 months. The 257 respondents came from the United States and 22 other countries and reported their own results through a self-selected online survey, so it may not represent large commercial farms.
A Southern Regional Aquaculture Center (SRAC) review of published studies reports that annual net returns ranged from losses of more than $11,000 to a profit of $278,038. The top figure is a hypothetical large-scale system, not actual farm data. Capital-heavy indoor farming can also fail: AeroFarms, an indoor farming company, announced the closure of its Virginia facility in December 2025, with 173 employees set to lose their jobs.
Five Levers Shape the Break-Even Date, and Three Are Tested Here
Five inputs shape the break-even date: capital cost and output, ramp-up speed, selling price, electricity and labor. The scenarios below vary three of them (ramp-up speed, selling price and electricity) and hold the other two fixed.
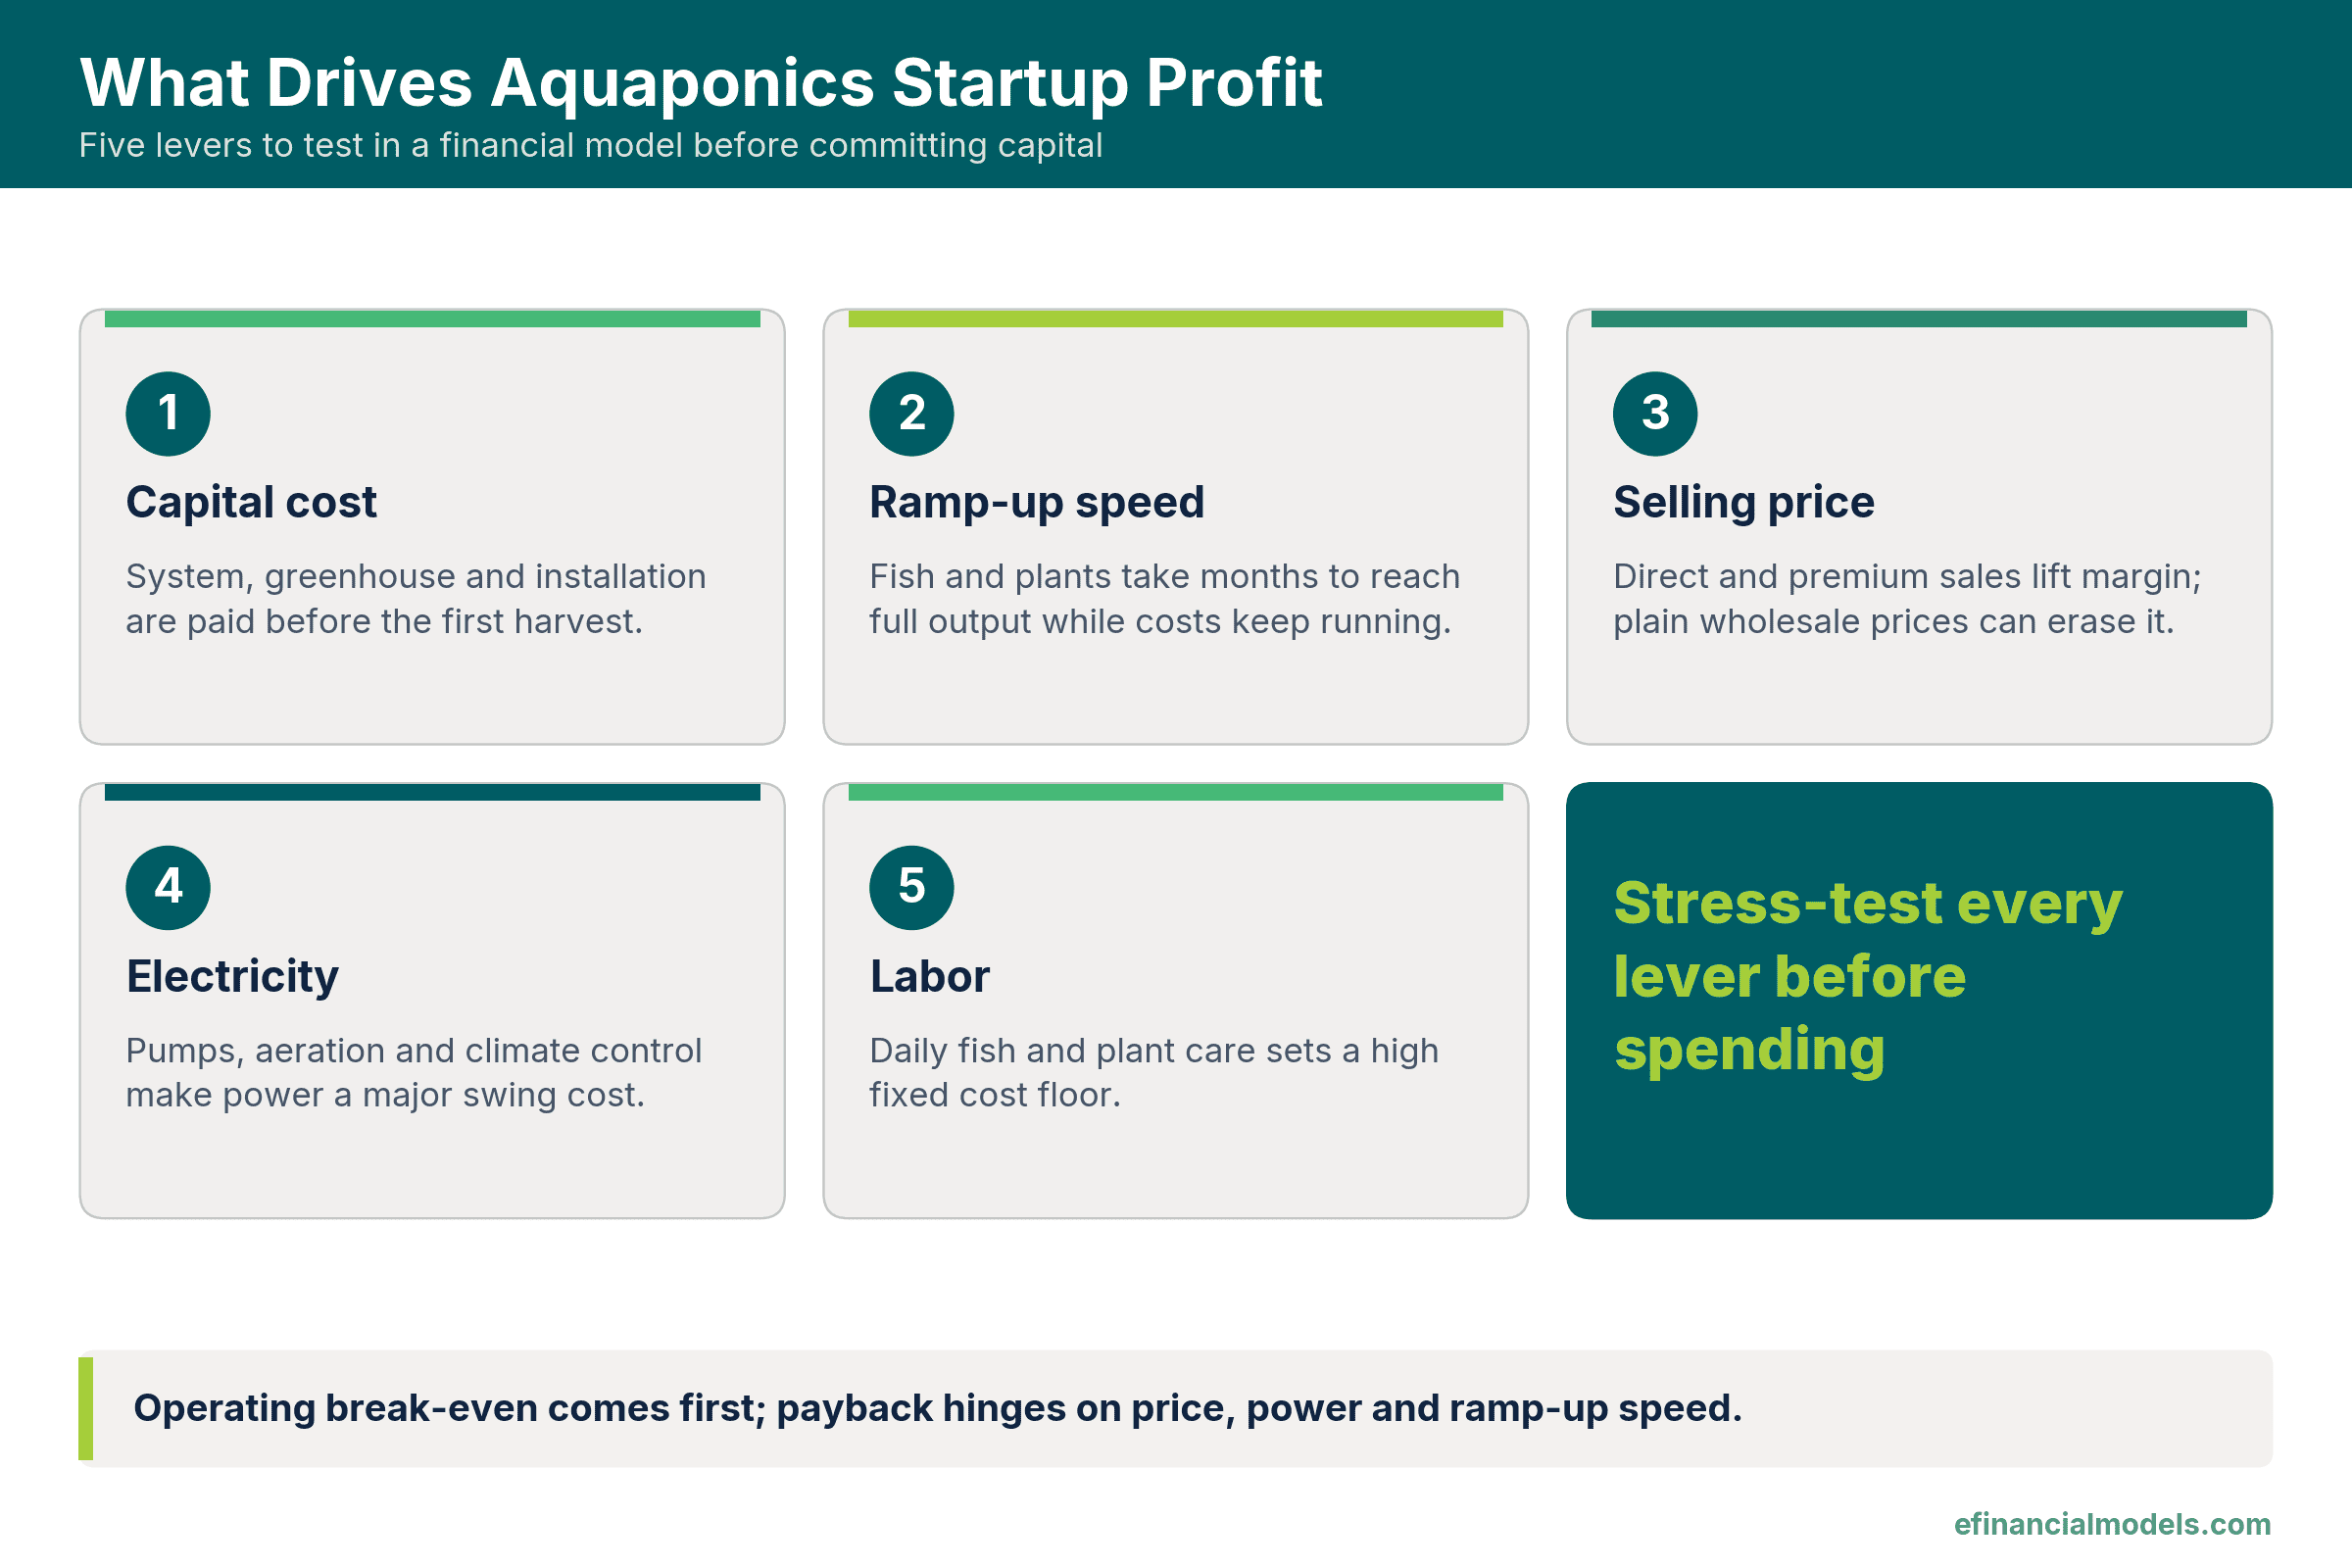
The five inputs behind the break-even date; the scenarios below vary three of them.
Capital cost and output. The example assumes 856 m2 of plant area, 157.5 heads of lettuce and 23.4 kg of tilapia per m2 per year. Real farms must replace these illustrative yields with tested figures.
Ramp-up speed. Fish need months to reach harvest size and customers take time to win, while labor, power and rent start on day one. The example assumes no sales for three months, then a straight-line climb over the next 15 months, so output reaches 100% in month 18.
Selling price. The example assumes $3.50 per pound for locally sold tilapia. This is an illustrative assumption with no verified benchmark behind it. The lettuce price of $1.70 per head is likewise an assumption.
Electricity. The example assumes 400 kilowatt-hours (kWh) per m2 per year at $0.14 per kWh, then tests a price half again as high. An October 2026 study of a tiny reference system found electricity was its largest cost, at $38.60 of $126.70 a year, so treat it as direction, not a benchmark.
Labor. Daily fish and plant care keeps labor high even when output is low. One 2015 study cited in the SRAC review put labor at 46% of total operating costs, but that is a single-study figure. The example assumes $95,000 per year, about 33% of its operating cost and still its largest line.
Worked Example: 856 m2 Farm Across Five Scenarios
Two dates matter. Operating break-even is the first month in which operating cash flow is zero or higher, and payback is the month in which cumulative cash returns to zero, ignoring the time value of money. The workbook models a hypothetical farm over 120 months using illustrative assumptions, and it stops at operating cash flow, so tax, loan interest and repayments are excluded.
Inputs
The base case assumes 856 m2 of plant area, which yields 134,820 heads of lettuce and 20,030 kg of tilapia, about 44,159 pounds, per year at full output. It assumes a capital cost of $450,000 plus $40,000 of working capital, the cash tied up in stock and early bills before sales arrive, for $490,000 of upfront funding. Base prices are $1.70 per head of lettuce and $3.50 per pound of tilapia.
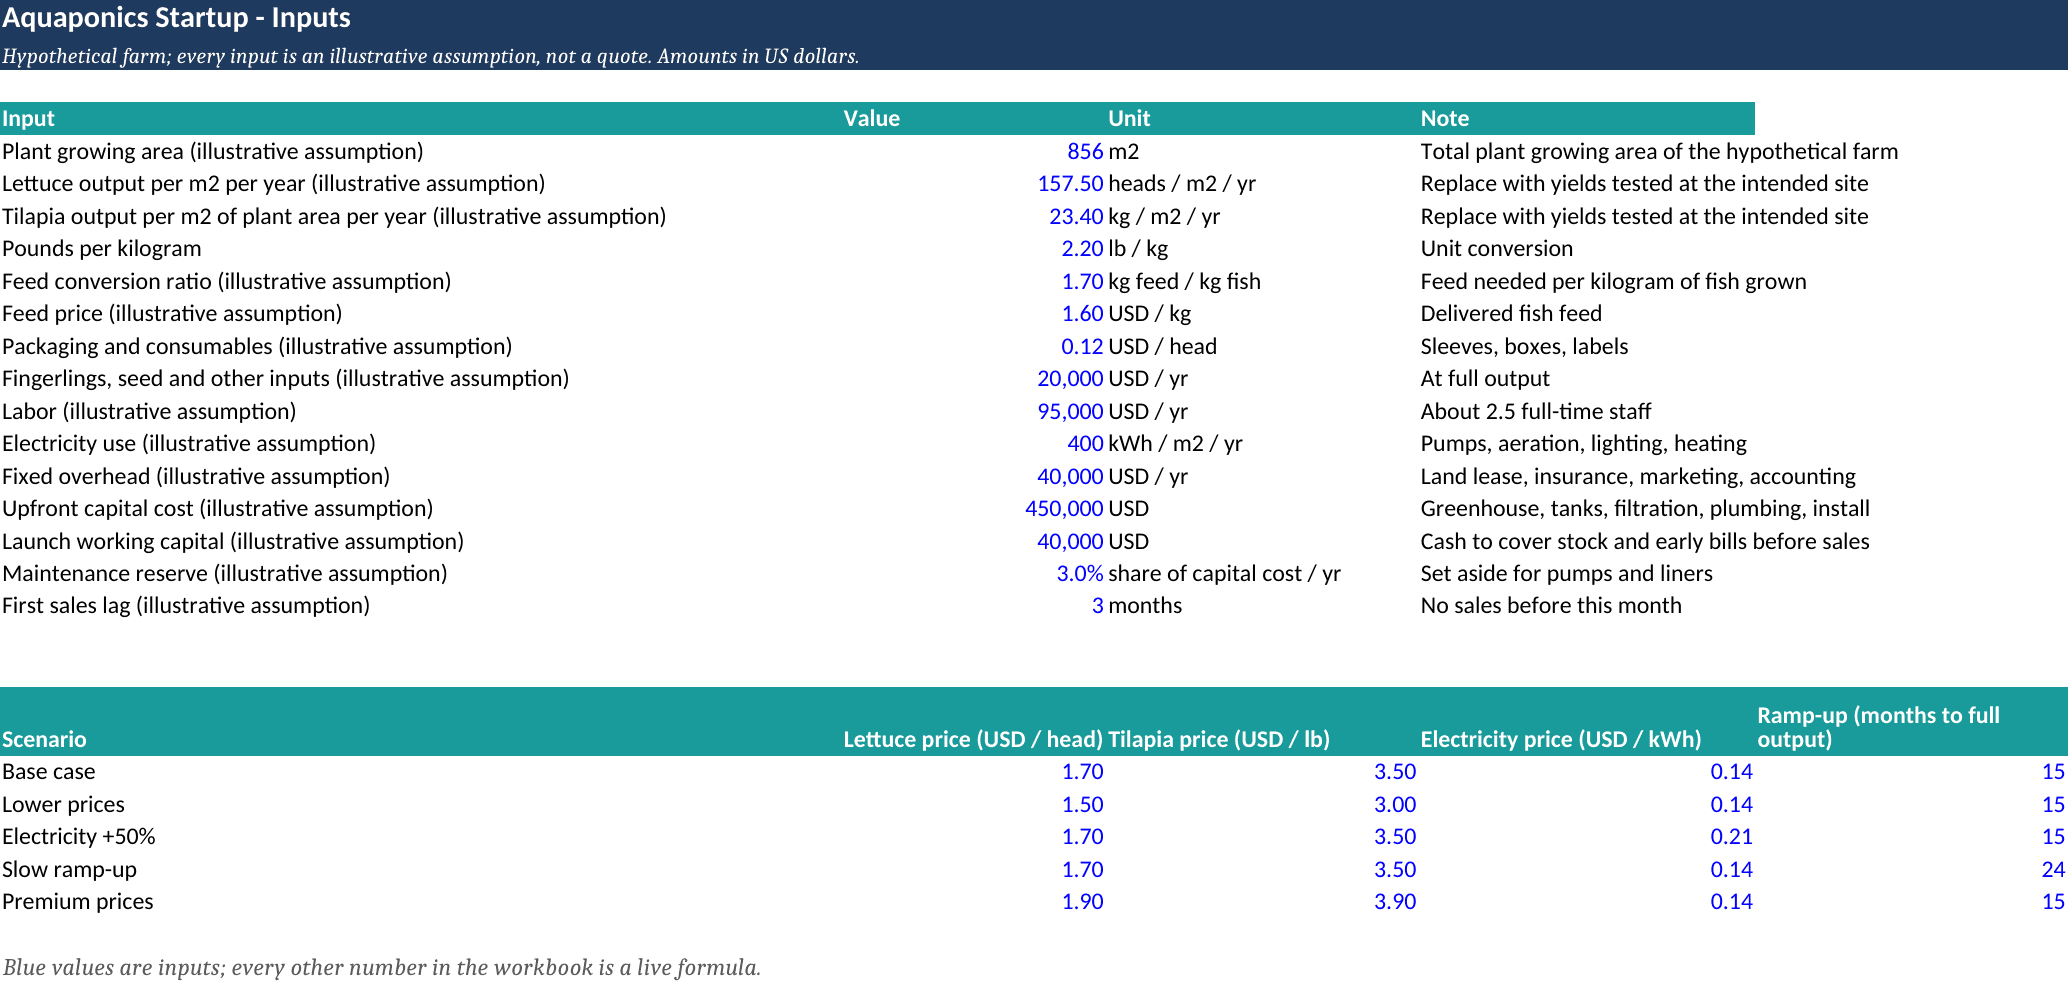
Inputs sheet: every blue value is an illustrative assumption. Source: eFinancialModels Analysis
Calculation
At full output the base case earns $383,751 of revenue ($229,194 from lettuce and $154,557 from tilapia) and carries $287,097 of operating cost, so operating cash flow is $96,654 a year, about $8,054 a month, a margin of 25.2%. Fixed costs cover labor ($95,000), electricity ($47,936), overhead ($40,000) and a maintenance reserve of 3% of capital cost ($13,500). Variable costs cover feed (1.7 kg per kg of fish at $1.60 per kg), packaging at $0.12 per head and $20,000 of fingerlings and other inputs. Cumulative cash starts at minus $490,000. The scenario moves are round-number steps, not equal percentage changes, so they rank the levers only roughly.
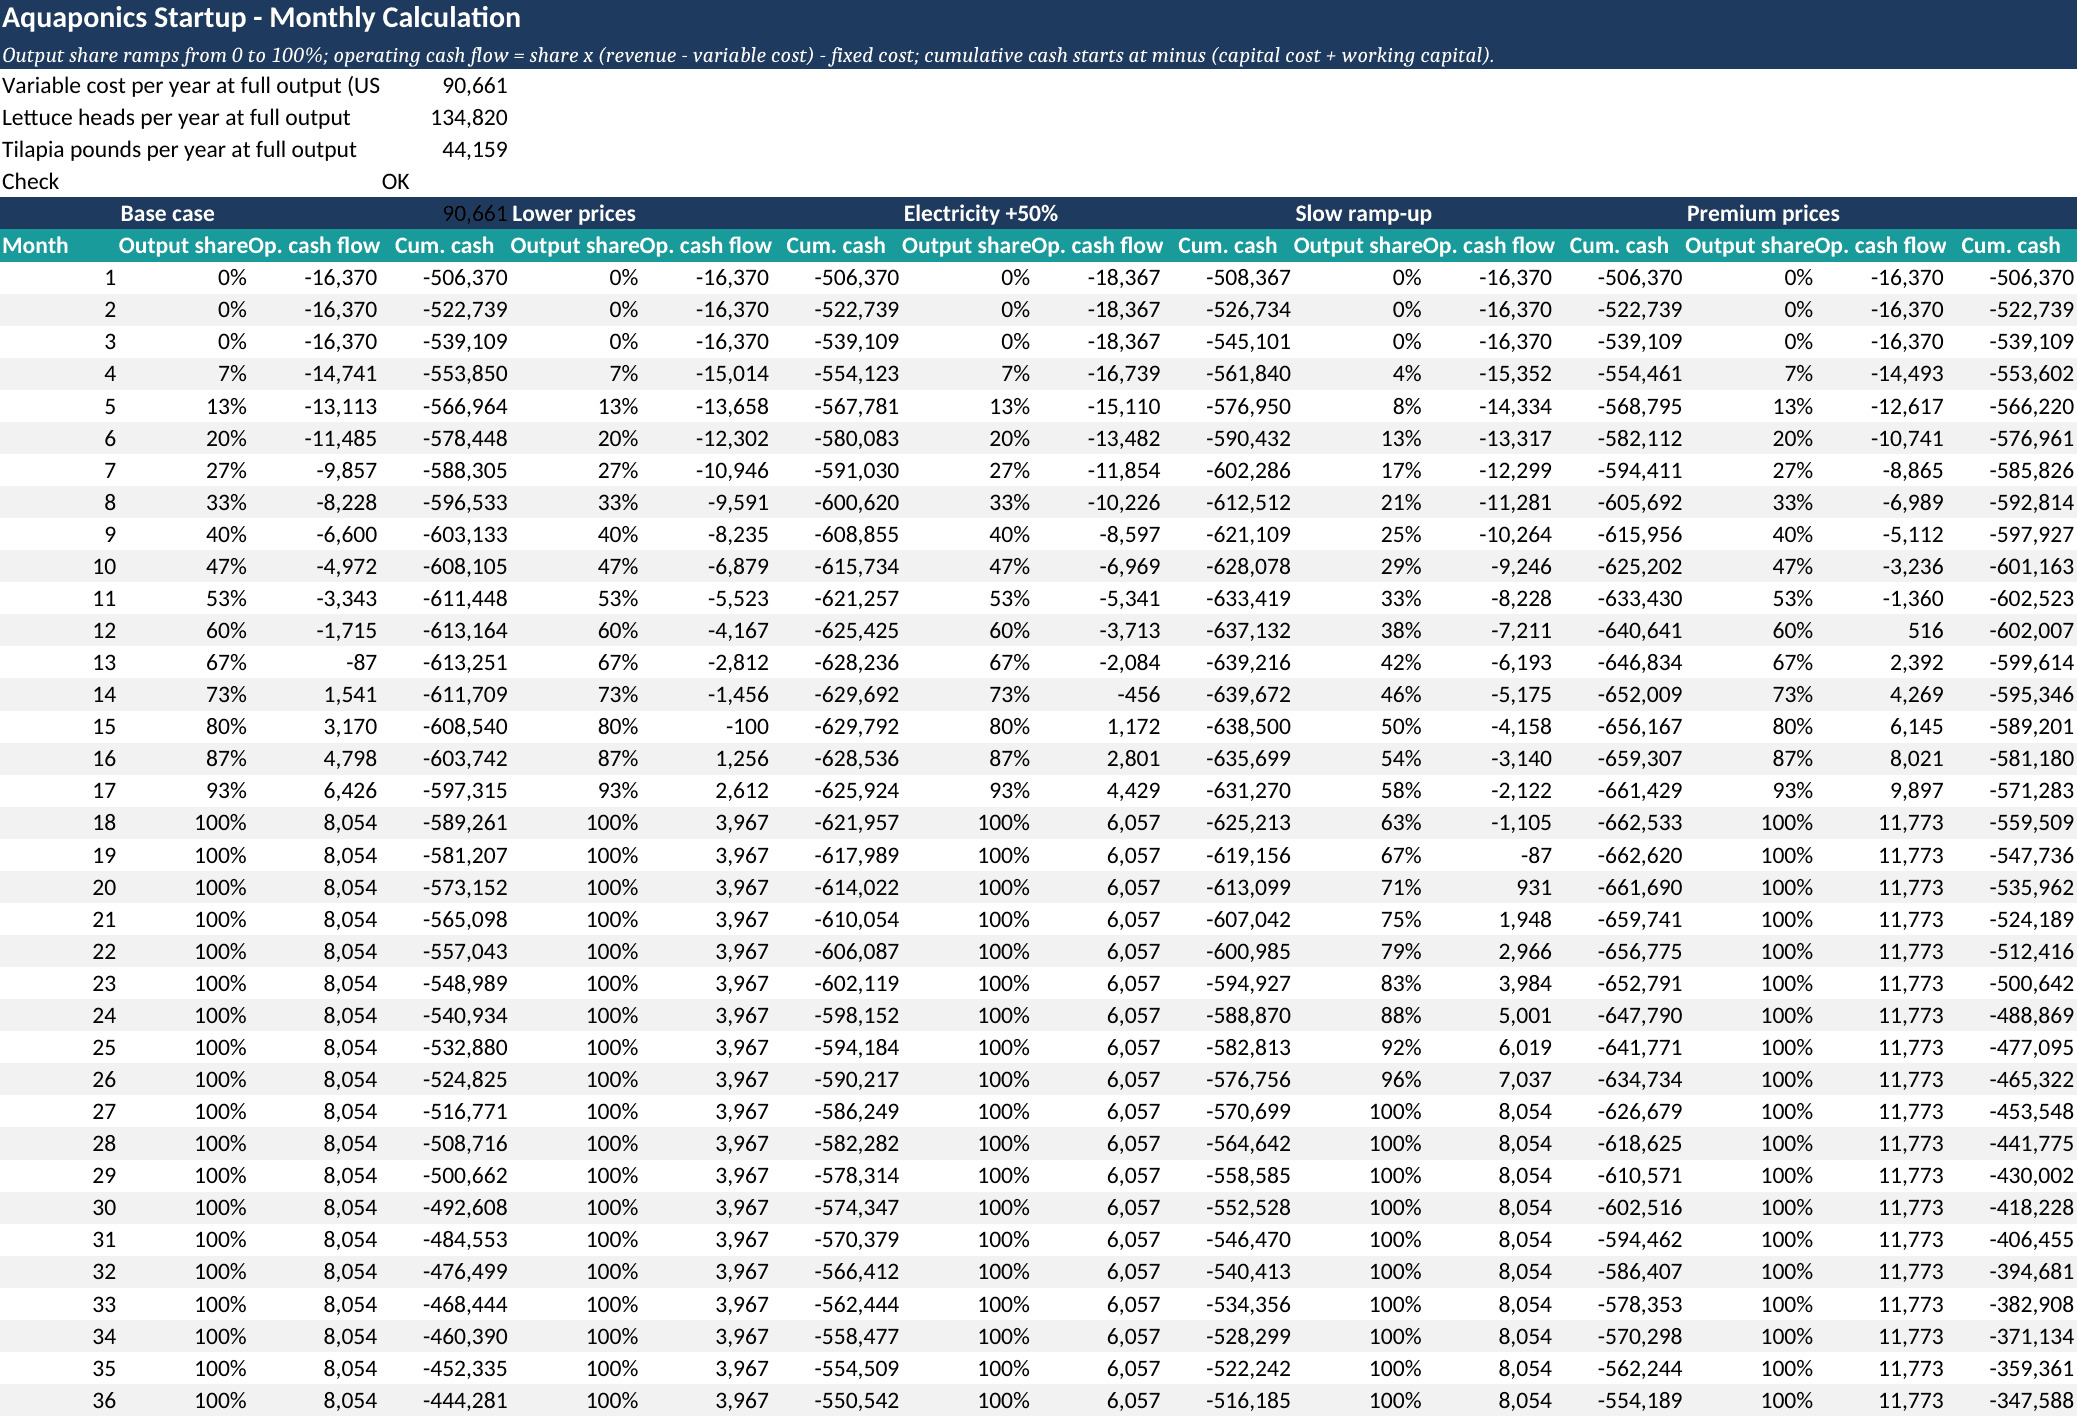
Calculation sheet: the first three years of the 120-month projection. Source: eFinancialModels Analysis
Results
| Scenario | First month with operating cash flow at or above zero | Peak cash need (USD) | Payback month | Cumulative cash at month 120 (USD) |
|---|---|---|---|---|
| Base case | 14 | 613,251 | 92 | 232,294 |
| Lower prices | 16 | 629,792 | Beyond 120 | -217,272 |
| Electricity +50% | 15 | 639,672 | Beyond 120 | -7,386 |
| Slow ramp-up | 20 | 662,620 | 105 | 122,385 |
| Premium prices | 12 | 602,523 | 66 | 641,380 |
In the base case, operating cash flow turns positive in month 14, yet cumulative cash does not return to zero until month 92, or 7.7 years. Peak cash need, the deepest cumulative cash deficit, reaches $613,251 in month 13, which is $123,251 more than the upfront funding, because losses continue during ramp-up.
To verify the base case, monthly revenue at full output is $31,979, variable cost is $7,555 and fixed cost is $16,370, so a fully producing month adds $24,424 of contribution before fixed costs. Output share equals (month minus 3) divided by 15, capped at 1, and monthly operating cash flow equals that share times $24,424, less $16,370. At a 100% share, reached in month 18, this is about $8,054 a month. Operating cash flow reaches zero at an output share of about 67% ($16,370 divided by $24,424), which the ramp passes in month 14, so cumulative cash bottoms out at minus $613,251 in month 13 and stands at minus $589,261 in month 18. Repaying that deficit at $8,054 a month takes 73.2 months. Cumulative cash is still negative at the end of month 91 (minus $1,286) and positive at the end of month 92, so payback falls in month 92.
Cutting prices to $1.50 per head and $3.00 per pound lowers full-output operating cash flow to $47,610 and leaves cumulative cash at minus $217,272 after ten years. Raising the electricity price to $0.21 per kWh leaves it at minus $7,386, just short of payback. A slow 24-month ramp-up delays payback from month 92 to month 105. Premium prices of $1.90 per head and $3.90 per pound bring payback forward to month 66.
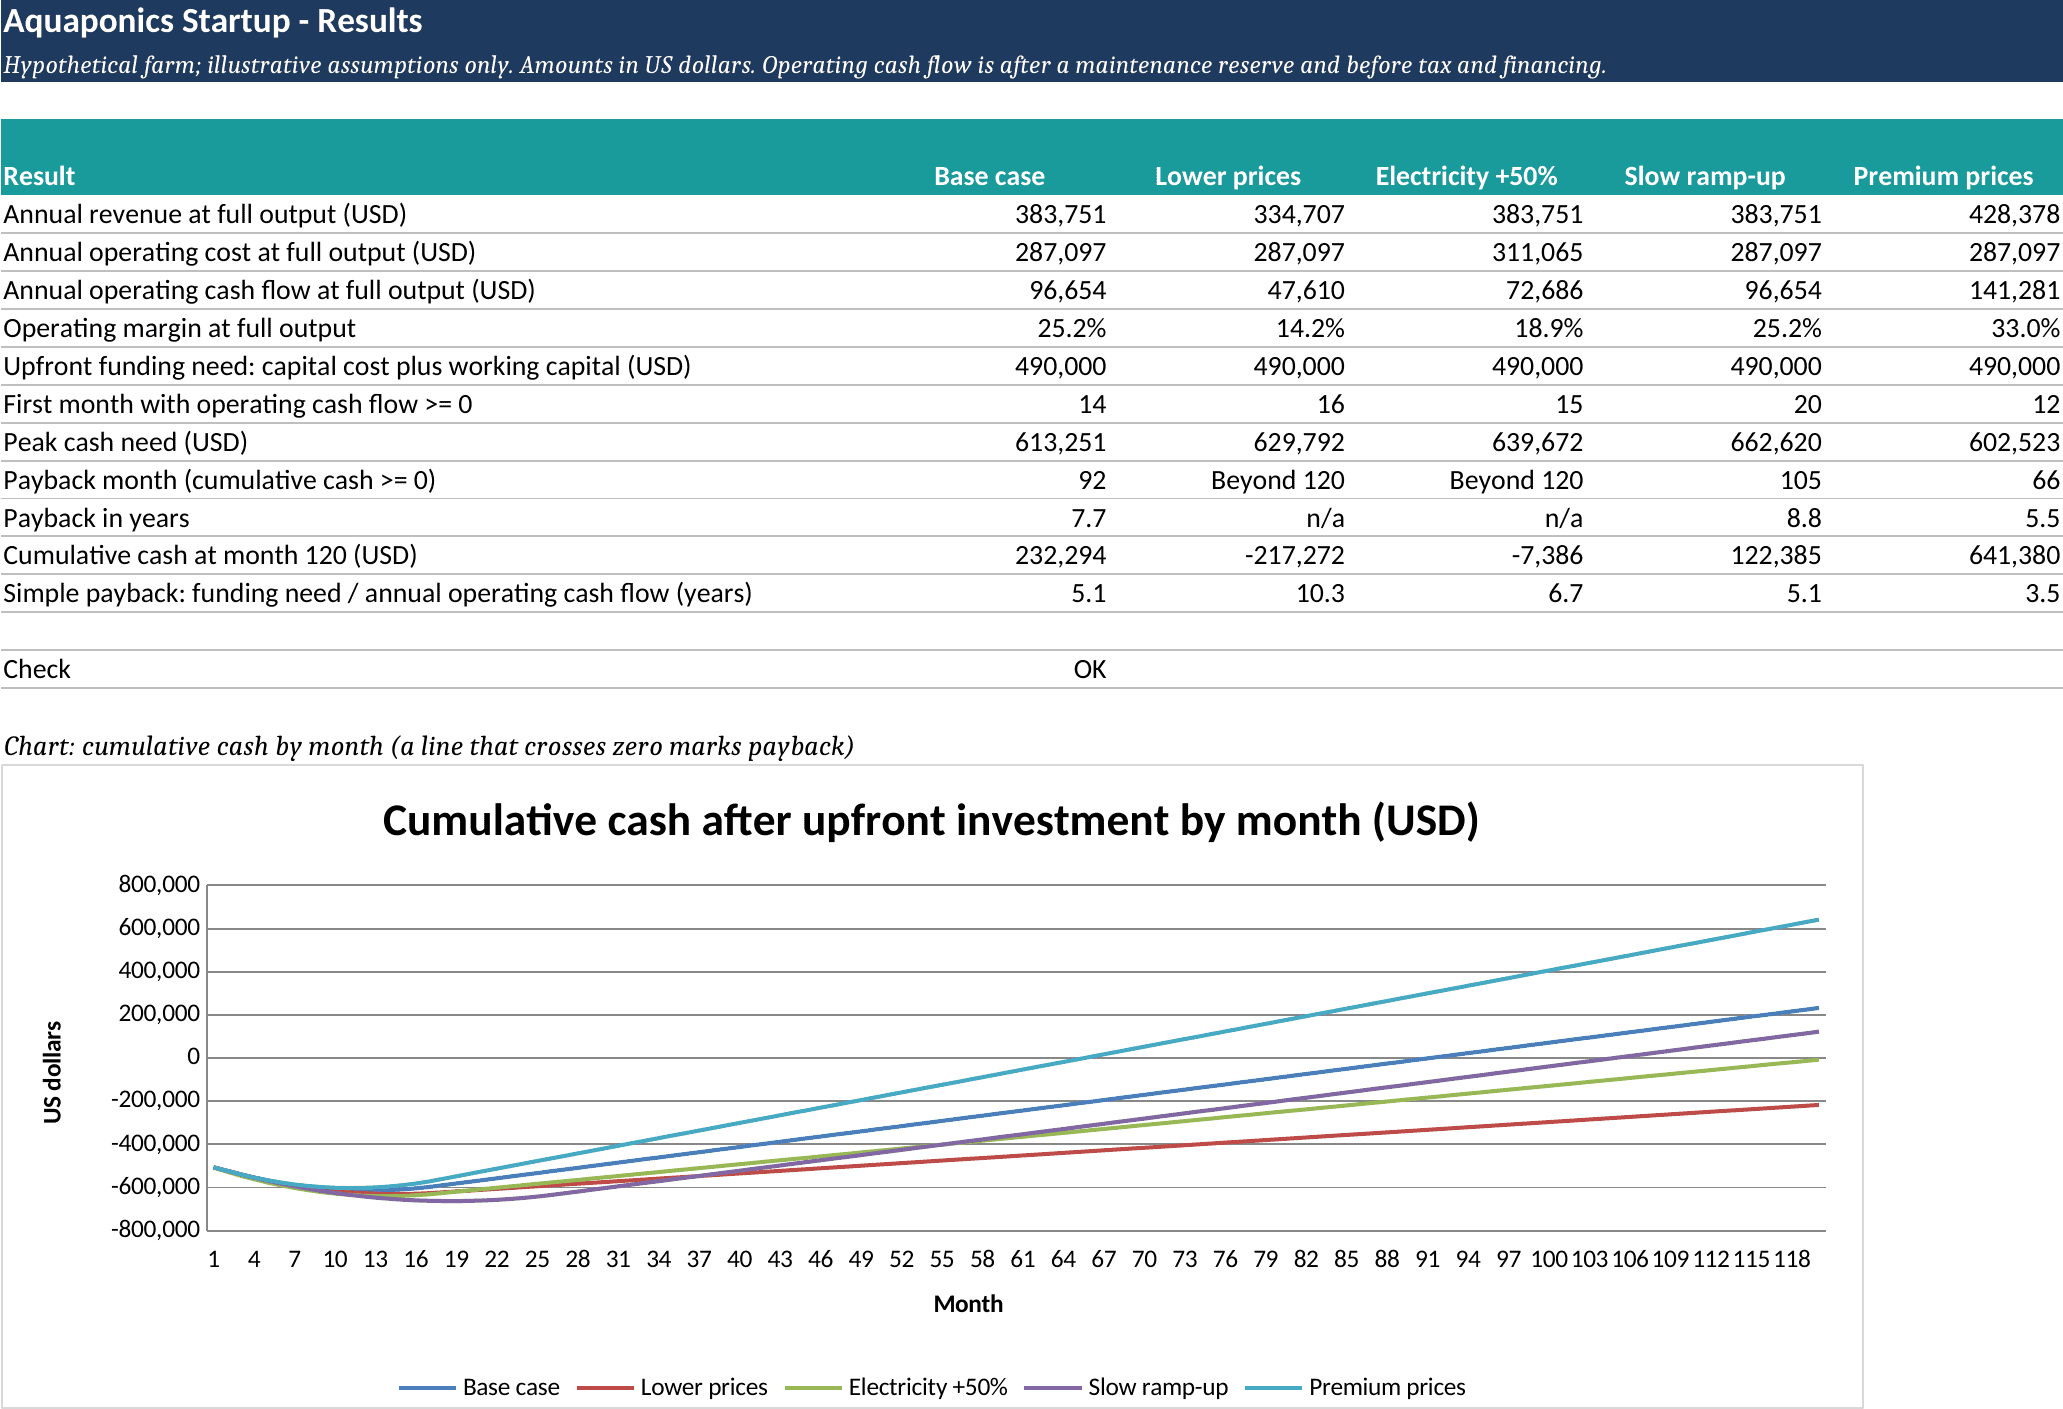
Results sheet: scenario outcomes and the cumulative cash chart. Source: eFinancialModels Analysis
Premium Buyers Shorten Payback While Power and Ramp-Up Risks Lengthen It
The scenarios point to three practical moves. Secure premium buyers before building, since the premium scenario repays the investment 26 months earlier than the base case. Power should be priced with a quote or contract, since a half-again rise in electricity cost removed payback within ten years. Funding should be sized to peak cash need, with a buffer for a slower ramp-up.
A sensitivity analysis, which tests how a result changes when one input moves, turns these moves into numbers.
Frequently Asked Questions
How much does it cost to start an aquaponics farm?
Published studies reviewed by SRAC report total investment costs from $58,760 to $1,020,536, depending on the scale of the operation. The width of that range shows why a single benchmark is unreliable: greenhouse type, climate control, automation, site works and system size all change the bill. A founder should enter site-specific equipment quotes as separate lines in the model, then test how the break-even date moves.
Does a bigger aquaponics farm reach break-even sooner?
Not automatically. A larger farm spreads fixed overhead over more output, which can lift the margin, but it also raises the upfront funding and the cash needed while sales build, and it leaves less room for error if buyers are slow to arrive. Farm area should therefore be varied in the model like any other input. The best size keeps the deepest cumulative cash deficit within funding that is actually available.
What should a lender or investor ask to see?
A lender or investor typically wants monthly cash flow, not only annual totals, because the deepest cumulative cash deficit decides how much funding is required. Useful requests include a scenario table, written support for every price and yield assumption, evidence of signed or likely buyers, written quotes for power and equipment, and a plan for covering losses if sales start late.
Which risks does the model leave out?
The worked example stops at operating cash flow, so it leaves out income tax, loan interest and repayments, equipment replacement beyond a small maintenance reserve, fish or crop losses, and price inflation. The model also excludes investor return measures such as internal rate of return (the yearly return that sets net present value, the value today of future cash flows minus the outlay, to zero). Each of these can push payback later, so a complete model adds a line for each before a farm approaches a bank.
Conclusion
Aquaponics can be profitable, but only conditionally: 31% of operators in the survey cited above reported a profit, and the modeled farm repays its investment within ten years at base or premium prices but not with lower prices or electricity half again as costly. Profit after depreciation, tax and financing is outside this model, and an accountant or financial adviser should assess it. For a ready-made structure, the eFinancialModels Agriculture Financial Model Templates Bundle includes a fish farm valuation model and a shrimp farm model, although it has no aquaponics-specific model, so greenhouse and crop lines must be added.