
0 ITEMS

ROI Formula Explained: Calculate and Interpret Returns
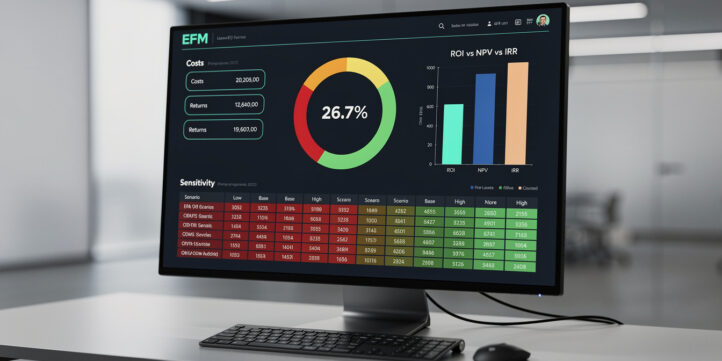
ROI (return on investment) is the single most cited metric in business finance, yet it is also one of the most frequently miscalculated and misinterpreted numbers in a boardroom.
Key Takeaways
- ROI = (Net Gain / Cost of Investment) × 100, expressed as a percentage, and takes fewer than 60 seconds to calculate once you define your inputs correctly.
- A 50% ROI over 1 year is fundamentally different from 50% over 5 years: annualized, the 5-year figure equals roughly 8.4% per year, not 50%.
- Marketing investments typically target a 5:1 ROI ratio (500%), while capital equipment projects commonly return 10–25% annually, and employee training programs can generate 200–300% ROI according to industry research.
- ROI ignores the time value of money, cash flow timing, and project scale, which is why projects longer than 3 years or with uneven cash flows require NPV or IRR analysis instead.
- At least 3 common mistakes inflate projected ROI by 20–50%: ignoring opportunity costs, excluding soft costs like implementation disruption, and cherry-picking favorable timeframes.
- Projected ROI (used before a decision) and realized ROI (measured after) are different numbers and should never be presented interchangeably to stakeholders.
- Finance professionals use a 3-metric framework: ROI for quick screening, NPV for long-term value, and IRR for comparing competing projects with different scales.
What ROI Actually Measures (And What It Doesn’t)
ROI measures the percentage return generated by an investment relative to its cost. It tells you how efficiently capital was deployed, but it does not tell you how long that took, how risky the path was, or whether a better alternative existed.
Think of ROI as a snapshot, not a movie. A 30% ROI on a marketing campaign and a 30% ROI on a 10-year factory expansion look identical on paper. In practice, they represent entirely different risk profiles, capital commitments, and strategic implications. ROI answers one question cleanly: for every dollar spent, how many dollars came back? Every other question requires a different tool.
ROI also suffers from a structural blind spot: it ignores the time value of money (the principle that a dollar received today is worth more than a dollar received in the future, because today’s dollar can be reinvested). A project returning $150,000 on a $100,000 investment in Year 1 is far more valuable than one returning the same $150,000 in Year 10, yet both show a 50% ROI. This is why NPV and IRR exist, and why this article covers all three.

The same ROI percentage over different time horizons represents dramatically different annual returns: 50% in Year 1 vs 8.4% per year over 5 years.
The ROI Formula: Basic Calculation Step-by-Step
The standard ROI formula is: ROI = (Net Gain / Cost of Investment) × 100. Net Gain equals the total return from the investment minus the total cost of the investment.
Here is the step-by-step process:
Step 1: Define your total investment cost. Include every dollar spent to initiate and sustain the investment: purchase price, installation, training, ongoing maintenance, and any opportunity cost (the value of the next-best alternative you gave up). Missing soft costs is the most common calculation error.
Step 2: Define your total return. This is the gross revenue, savings, or value generated by the investment over the measurement period. For a marketing campaign, it is incremental revenue. For a cost-reduction project, it is documented savings. For an equipment purchase, it is the value of additional output.
Step 3: Calculate net gain. Net Gain = Total Return minus Total Investment Cost.
Step 4: Apply the formula. Divide Net Gain by Total Investment Cost, then multiply by 100 to express as a percentage.
Step 5: Interpret in context. A positive ROI means the investment returned more than it cost. A negative ROI means it destroyed value. The absolute percentage only becomes meaningful when compared to a benchmark, a hurdle rate, or an alternative investment.
Worked Example: CRM Software Implementation
A mid-sized B2B company spends $120,000 implementing a CRM system. Here are the inputs:
- Software license (Year 1): $48,000
- Implementation and consulting: $35,000
- Internal staff time (opportunity cost, 400 hours at $75/hour): $30,000
- Training disruption (estimated lost productivity): $7,000
- Total Investment Cost: $120,000
Measured benefits over 12 months:
- Incremental revenue from improved sales pipeline visibility: $95,000
- Reduced customer churn savings: $42,000
- Time savings from automated reporting (200 hours at $75/hour): $15,000
- Total Return: $152,000
Here’s the math:
- Net Gain = $152,000 – $120,000 = $32,000
- ROI = ($32,000 / $120,000) × 100 = 26.7%
A 26.7% ROI over 12 months is a solid result for a technology implementation. It clears most corporate hurdle rates (typically 10–15% for internal projects) and justifies the capital allocation.
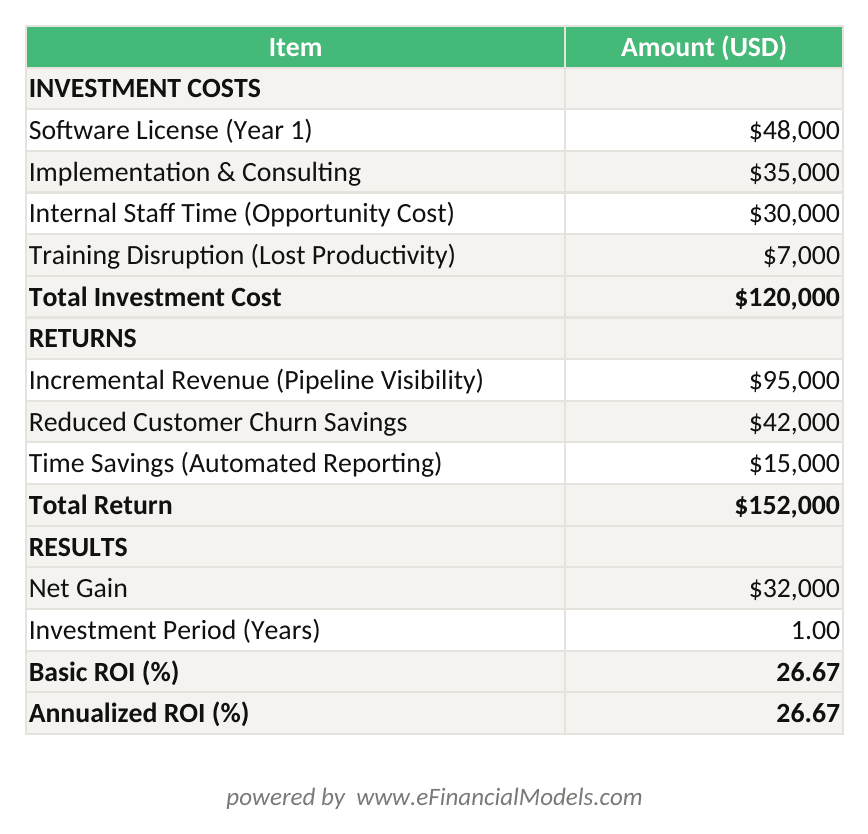
ROI = (Net Gain / Total Cost) × 100 = ($32,000 / $120,000) × 100 = 26.7%. Annualized ROI over 1 year equals 26.7%.
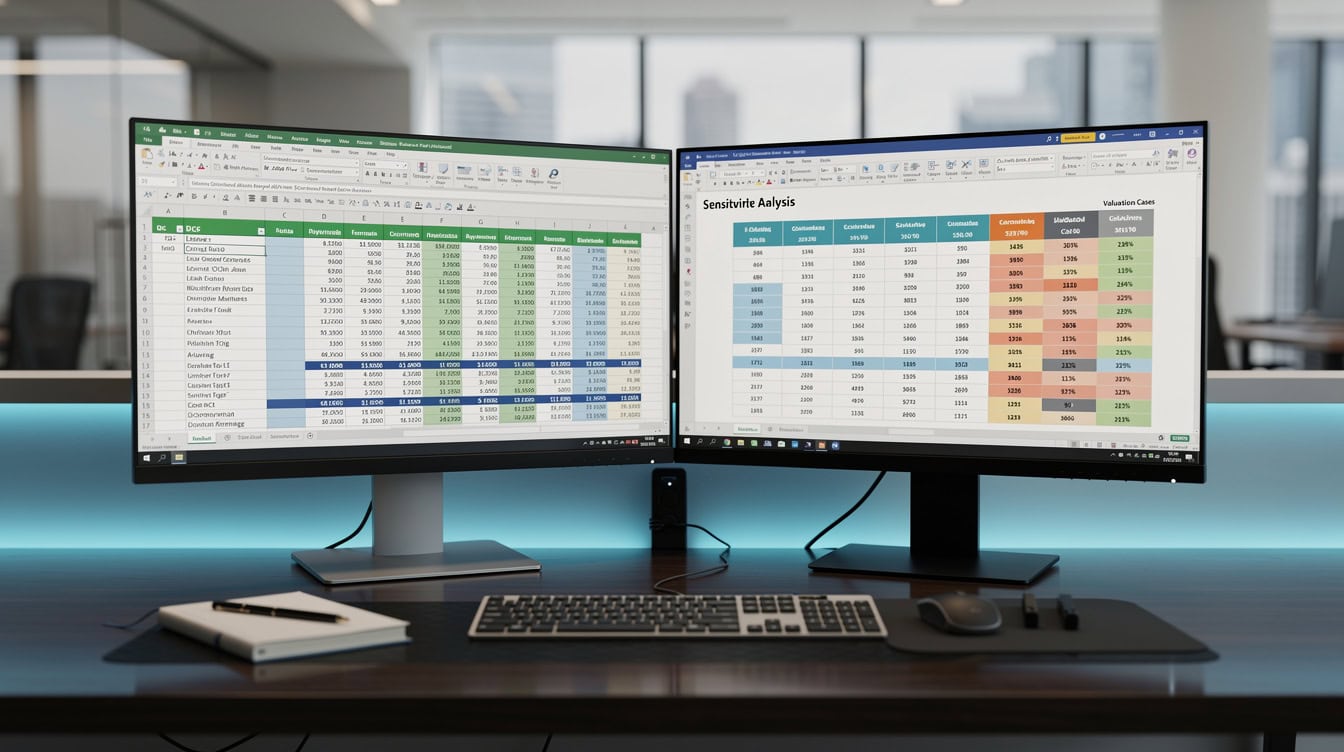
A structured Excel ROI model separates cost inventory from returns inventory, making assumptions auditable and easy to update.
Time-Adjusted ROI: Why Duration Changes Everything
A raw ROI percentage is meaningless without knowing the time period it covers. Annualizing ROI converts any multi-period return into a comparable annual rate, the same way banks express interest rates.
The annualized ROI formula uses compound growth logic:
Annualized ROI = (1 + ROI)^(1/n) – 1 × 100
Where n = number of years the investment runs.
For the CRM example above (26.7% over 1 year), annualized ROI equals 26.7% because n = 1.
Now consider a manufacturing equipment purchase with a 60% total ROI over 5 years:
- Annualized ROI = (1 + 0.60)^(1/5) – 1 × 100
- = (1.60)^0.20 – 1 × 100
- = 1.0985 – 1 × 100
- = 9.85% per year
That 60% headline figure sounds impressive. The 9.85% annualized rate is more modest, and it needs to clear the company’s weighted average cost of capital (WACC, the minimum return required to satisfy all capital providers) to create value. If WACC is 11%, this project destroys value despite its positive ROI.
This is exactly why annualization matters: it puts every investment on the same clock. Excel’s RATE function can handle up to 32,767 periods Source when modeling annualized returns across long investment horizons, making it a reliable tool for multi-year ROI calculations.
Annualizing ROI using the compound growth formula converts any multi-year return into a comparable annual rate.
When to Use ROI vs NPV, IRR, and Payback Period
ROI is the right starting metric for quick screening, but three other metrics provide deeper insight for complex decisions. NPV (net present value) discounts all future cash flows back to today’s dollars, giving you the absolute dollar value created. IRR (internal rate of return) finds the discount rate at which an investment breaks even in NPV terms, useful for comparing projects of different sizes. Payback period measures how quickly you recover your initial investment, critical for liquidity-constrained businesses.

Each metric answers a different question: ROI screens quickly, NPV shows absolute value, IRR enables scale-neutral comparison, and payback period measures liquidity recovery.
| Metric | Best For | Accounts for Time Value | Shows Dollar Value | Handles Uneven Cash Flows |
|---|---|---|---|---|
| ROI | Quick screening | No | No | No |
| Annualized ROI | Multi-year comparison | Partially | No | No |
| NPV | Long-term projects | Yes | Yes | Yes |
| IRR | Competing projects | Yes | No | Yes |
| Payback Period | Liquidity focus | No | No | No |
Use NPV when the project runs longer than 3 years or involves uneven cash flows. Use IRR when comparing two mutually exclusive investments of different scales (a $500,000 project vs a $2,000,000 project cannot be fairly compared on ROI alone). Use payback period when cash recovery speed matters more than total return, common in early-stage companies or capital-constrained environments. Excel’s NPV function accepts up to 254 value arguments Source, giving analysts ample room to model detailed, period-by-period cash flows for complex capital projects.
For a deeper look at how NPV and IRR work together in capital budgeting, the Break-Even Analysis, Forecast and Valuation template on EFM integrates all three metrics in a single model.
Industry Benchmarks: What ROI Percentages Are Realistic
ROI benchmarks vary dramatically by investment type, and comparing a marketing campaign ROI to a capital equipment ROI is like comparing sprint times to marathon times. Each category has its own baseline.
Marketing investments typically target a 5:1 return ratio, meaning $5 in revenue for every $1 spent, equivalent to a 400% ROI. The Data & Marketing Association has documented that email marketing consistently achieves among the highest marketing ROI of any channel. Technology implementations (ERP, CRM, analytics platforms) typically generate 15–40% annualized ROI when fully adopted, though adoption rates heavily influence outcomes. Capital equipment purchases in manufacturing commonly return 10–25% annually, depending on utilization rates and maintenance costs. Employee training programs, when outcomes are rigorously measured, can generate 200–300% ROI according to research published by the Association for Talent Development, though measurement methodology varies widely.
These benchmarks serve as sanity checks. A projected 800% ROI on a CRM implementation should trigger skepticism, not celebration.
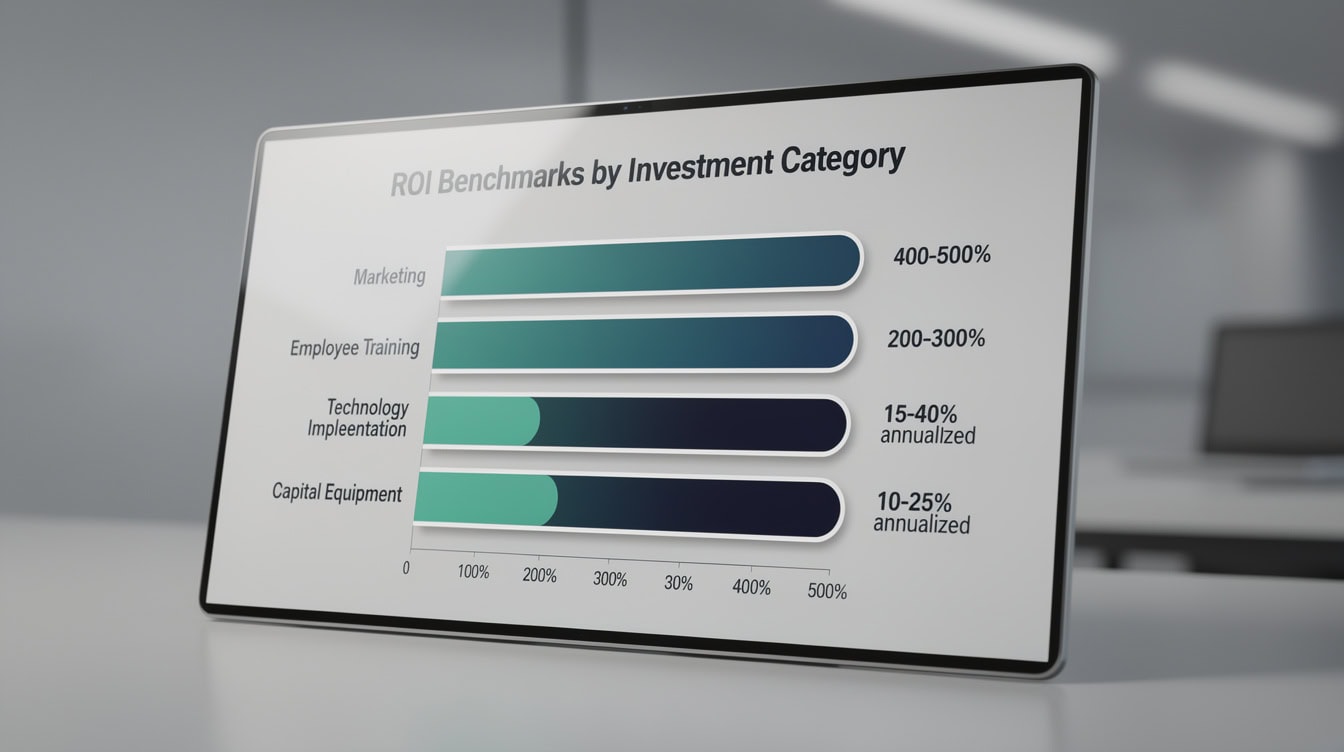
ROI benchmarks vary by 10x across investment types: marketing targets 400-500% while capital equipment typically returns 10-25% annually.
Common ROI Calculation Mistakes (And How to Avoid Them)
Five specific errors account for most of the gap between projected and realized ROI. Research consistently shows that ROI projections overestimate actual returns by 20–50% in technology and capital projects, according to studies reviewed by the Project Management Institute Source.
Mistake 1: Ignoring opportunity cost. Every dollar invested is a dollar not deployed elsewhere. If your company’s next-best alternative returns 12%, any project below that threshold destroys relative value even with a positive ROI. Fix: always state your hurdle rate and compare against it.
Mistake 2: Excluding soft costs. Implementation disruption, management attention, employee learning curves, and transition friction are real costs that rarely appear in project proposals. A software rollout that consumes 600 hours of senior staff time at $100/hour adds $60,000 to the true cost. Fix: build a full cost inventory before calculating.
Mistake 3: Cherry-picking timeframes. Measuring ROI at the moment of peak performance (Month 6 of a 36-month project) inflates the figure. Fix: define the measurement period before the project starts and stick to it.
Mistake 4: Survivorship bias in benchmarks. Published ROI success stories represent projects that worked. Failed projects rarely get case studies. Fix: apply a 20–30% discount to benchmark ROI figures when setting expectations.
Mistake 5: Conflating projected and realized ROI. A business case built on projected ROI is a forecast, not a fact. Presenting it alongside realized ROI from past projects misleads stakeholders. Fix: always label which type of ROI you are presenting.

These 5 mistakes account for most of the 20-50% gap between projected and realized ROI in technology and capital projects.
Calculating ROI for Hard-to-Quantify Investments
Intangible investments, including brand building, employee training, process improvements, and culture initiatives, require a structured approach to monetize benefits before ROI can be calculated.
The standard approach uses three steps. First, identify the leading indicators that the investment affects (employee retention rate, customer satisfaction score, error rate, time-to-hire). Second, assign a dollar value to each indicator using existing business data (if reducing employee turnover by 5 percentage points saves $8,000 per retained employee, and you retain 10 additional employees, that is $80,000 in documented savings). Third, apply the standard ROI formula to those monetized figures.
For brand-building investments, the Return on Investment (ROI) templates on EFM include frameworks for estimating brand equity contribution to revenue, which gives finance teams a defensible methodology for board presentations.
The key discipline: document your assumptions explicitly. A training program ROI of 250% built on transparent assumptions is more credible than a 50% ROI with no methodology shown.

Monetizing intangible benefits requires three steps: identify leading indicators, assign dollar values using business data, then apply the standard ROI formula.
How to Build an ROI Model in Excel
Building a functional ROI model in Excel takes about 20 minutes using a structured layout. The model needs four components: an inputs section, a cost inventory, a returns inventory, and a summary dashboard.
In Excel, structure your inputs in column B with labels in column A. Key formulas:
- Net Gain:
=B_TotalReturn - B_TotalCost(where B_TotalReturn and B_TotalCost are named ranges or specific cell references) - Basic ROI:
=(B_NetGain/B_TotalCost)*100 - Annualized ROI:
=((1+B_ROI/100)^(1/B_Years)-1)*100 - Sensitivity table: Use Excel’s Data Table function (Data > What-If Analysis > Data Table) to show ROI across a range of cost and return assumptions simultaneously.
A sensitivity table (a two-variable data table that shows how ROI changes as two inputs vary simultaneously) is the most valuable addition to any ROI model. It replaces a single-point estimate with a range of outcomes, which is far more useful for decision-making under uncertainty. Excel’s What-If Analysis Data Table supports up to 2 input variables simultaneously Source, making it ideal for mapping how ROI shifts across a matrix of cost and return assumptions.
The Retail Store Financial Model and Valuation template demonstrates how sensitivity analysis integrates with ROI and valuation outputs in a professional model structure.
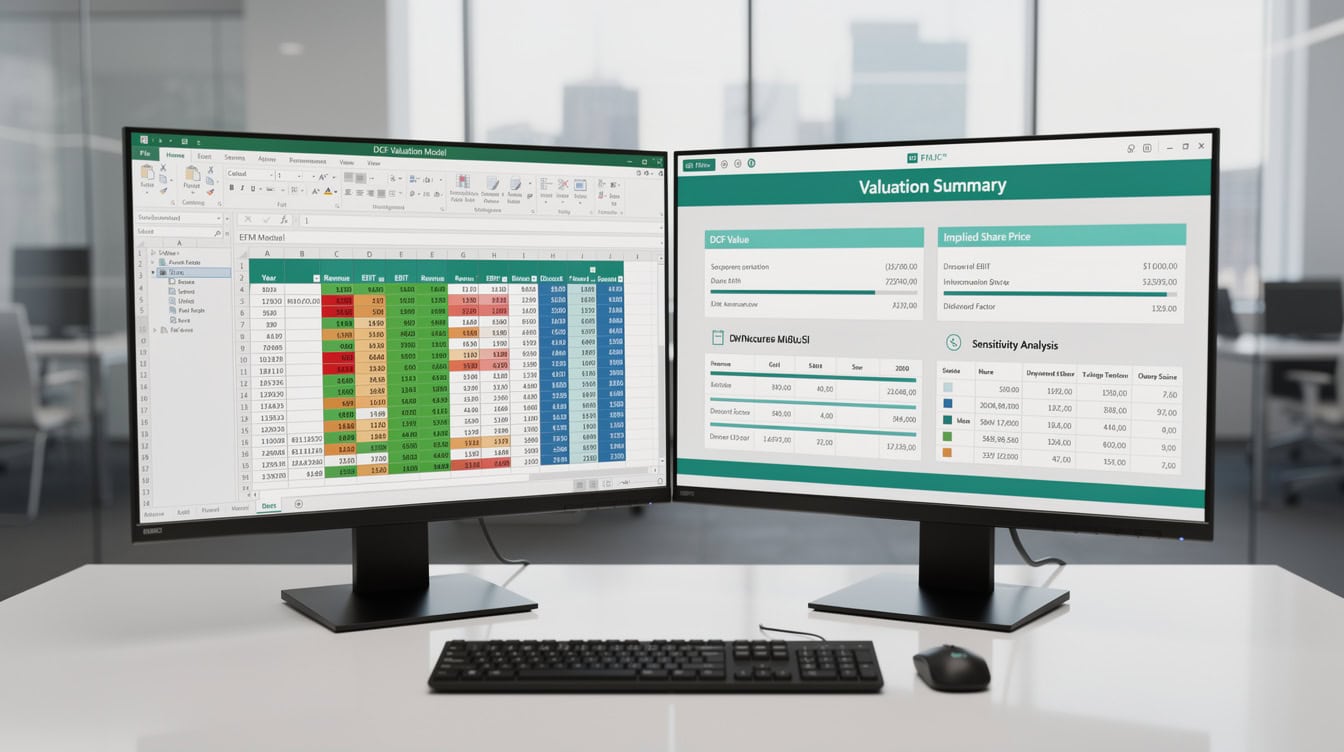
A two-variable sensitivity table replaces a single ROI estimate with a full range of outcomes, making investment decisions more robust under uncertainty.
Presenting ROI to Stakeholders: What Different Audiences Need
The same ROI number lands differently depending on who is in the room. Tailor your presentation to each audience’s primary concern.
CFOs focus on risk-adjusted returns. Present ROI alongside the assumptions that drive it, the sensitivity range (best case, base case, worst case), and the comparison to WACC. A 25% projected ROI with a worst-case of 8% is a different conversation than a 25% ROI with a worst-case of -5%.
Executives focus on strategic fit. Frame ROI in terms of what the investment enables: market share, competitive positioning, or capability building. A 20% ROI on a market-entry investment may be acceptable if it opens a $500M addressable market.
Boards focus on competitive context. Show how the projected ROI compares to industry benchmarks and to the company’s historical returns on similar investments. Context transforms a number into a judgment.
Operational managers focus on payback speed. They want to know when the investment pays for itself, not the total return. Lead with payback period for this audience, then support with ROI.
Frequently Asked Questions
What is the ROI formula in simple terms?
ROI = (Net Gain / Cost of Investment) × 100. Net Gain is what you got back minus what you put in. For example, if you invest $50,000 in a marketing campaign and generate $75,000 in incremental revenue, your Net Gain is $25,000 and your ROI is ($25,000 / $50,000) × 100 = 50%. The formula works for any investment type, from equipment purchases to training programs, as long as you define costs and returns consistently. The critical discipline is including all costs, not just the obvious ones, before you divide.
What is a good ROI percentage?
A good ROI depends entirely on the investment type and the company’s cost of capital. For internal technology projects, most finance teams use a hurdle rate of 10–15% annualized ROI as the minimum threshold. Marketing campaigns typically target 400–500% ROI (a 5:1 return ratio). Capital equipment in manufacturing commonly returns 10–25% annually. Employee training programs, when rigorously measured, can reach 200–300% ROI. The most useful benchmark is your own company’s WACC: any investment returning less than WACC destroys shareholder value regardless of the absolute ROI percentage.
How do I annualize an ROI from a multi-year project?
Use the compound annual growth rate formula: Annualized ROI = (1 + ROI)^(1/n) – 1 × 100, where n is the number of years. If a project delivers a 75% total ROI over 4 years, the annualized ROI is (1.75)^(0.25) – 1 × 100 = (1.75)^0.25 – 1 × 100. Calculate 1.75 to the power of 0.25: that equals approximately 1.1501. Subtract 1 and multiply by 100: annualized ROI = 15.01%. This is the rate you compare against your hurdle rate or WACC, not the 75% headline figure.
When should I use NPV instead of ROI?
Use NPV (net present value) instead of ROI when the project runs longer than 3 years, involves uneven cash flows across periods, or when you need to compare two investments of different sizes. NPV discounts all future cash flows back to today’s dollars using your cost of capital, which accounts for the time value of money that ROI ignores. A project with a positive NPV creates value in absolute dollar terms. A project with a positive ROI may still destroy value if it runs for many years and the time-adjusted return falls below your cost of capital. For capital budgeting decisions, use ROI for initial screening and NPV for final approval.
What costs do people most often forget in ROI calculations?
The 5 most commonly excluded costs are: (1) opportunity cost, the return you forgo by not deploying capital elsewhere; (2) implementation disruption, the productivity lost during rollout; (3) internal staff time, particularly senior management hours that have a high implicit cost; (4) ongoing maintenance and support costs beyond Year 1; and (5) training time for end users. In technology implementations, these soft costs routinely add 30–50% to the visible project cost. Excluding them inflates projected ROI and sets up a gap between forecast and realized returns that erodes stakeholder trust in future business cases.
How do I calculate ROI for an employee training program?
Start by identifying measurable outcomes the training affects: error rates, sales conversion rates, time-to-competency for new hires, or employee retention. Assign a dollar value to each outcome using existing business data. For example, if a sales training program improves close rates by 3 percentage points across 20 salespeople, each closing an average of $200,000 in annual deals, the incremental revenue is 20 × $200,000 × 0.03 = $120,000. If the training cost $25,000 including facilitation, materials, and lost productive time, ROI = ($120,000 – $25,000) / $25,000 × 100 = 380%. Document every assumption explicitly so the methodology can be audited and replicated.
What is the difference between projected ROI and realized ROI?
Projected ROI is a forecast built before an investment is made, used to justify the decision. Realized ROI is measured after the investment is complete, using actual costs and actual returns. Research reviewed by the Project Management Institute shows that projected ROI typically overestimates realized ROI by 20–50% in technology and capital projects. The gap exists because projections undercount costs and overcount benefits. Best practice is to track both: use projected ROI for the business case, then measure realized ROI at 6, 12, and 24 months post-implementation. Comparing the two builds organizational learning and improves future forecasting accuracy.
Conclusion
ROI is the fastest way to screen an investment, but it is not the final word. Use it to open the conversation, then reach for annualized ROI, NPV, or IRR to close it. The formula is simple: (Net Gain / Cost of Investment) × 100. The discipline is in defining every cost, choosing the right time horizon, and presenting the result with the context your audience actually needs.
I recommend downloading the Return on Investment (ROI) template from EFM, which includes built-in sensitivity analysis, annualization formulas, and a side-by-side NPV and IRR comparison framework used by finance professionals to standardize investment analysis and defend capital allocation decisions.
























































