
0 ITEMS

Startup Financial Model Template: 7 Tabs Investors Expect

Your pitch deck lives or dies on the numbers behind it. This guide shows you exactly how to build a startup financial model template that passes investor due diligence, from the seven worksheets every model must include to the KPIs investors will verify before writing a check.
Key Takeaways
- A credible investor-grade startup financial model requires exactly 7 core worksheets: revenue model, operating expenses, headcount plan, cash flow statement, P&L, balance sheet, and cap table basics.
- Bottoms-up revenue projections, built from unit economics and customer acquisition assumptions, are 3x more credible to investors than top-down market-share estimates.
- Investors expect monthly granularity for Year 1, quarterly for Years 2 and 3, and annual for Years 4 and 5. Projections beyond 5 years signal naivety.
- The 3 scenarios every model must include are base case, conservative case (20-30% below base), and optimistic case (20-30% above base), each with documented assumptions.
- SaaS gross margins should fall between 70-80%, marketplace models between 50-70%, and hardware between 30-50%. Projections outside these ranges trigger immediate investor skepticism.
- The 8 KPIs investors will verify automatically include CAC, LTV, LTV:CAC ratio, burn rate, runway, gross margin, ARR growth rate, and payback period.
- The single most common fatal mistake is hockey-stick revenue projections with no supporting assumption logic, which according to experienced VCs is the fastest way to lose credibility in a first meeting.
What Investors Actually Look for in a Startup Financial Model
Investors don’t expect your 3-year projections to be accurate. They use your financial model to evaluate whether you understand your business. A well-built startup financial model template demonstrates that you know your unit economics, your cost structure, and the levers that drive growth.
More than 65% of startups that fail cite financial mismanagement as a contributing factor, according to research from the Kauffman Foundation.
Investors have seen enough failed companies to know that founders who can’t articulate their assumptions are founders who won’t catch problems early enough to fix them.
The model also connects directly to your pitch deck narrative. If your go-to-market slide claims you’ll acquire 500 customers in Year 1, your revenue model must show exactly how: which channels, at what cost, converting at what rate. Disconnects between the story and the numbers are the fastest way to lose credibility in a first meeting.
EfinancialModels provides investor-ready startup financial model templates built specifically for pre-seed to Series A founders, with built-in formulas, scenario planning, and automated KPI dashboards.
The 7 Essential Worksheets Every Investor-Grade Financial Model Must Include
Every investor-grade startup financial model template must contain these 7 worksheets. Skipping any one of them signals to investors that you haven’t thought through your business completely.
1. Assumptions Tab: This is the control panel. Every input that drives the model, pricing, growth rates, churn, headcount timing, sits here as a clearly labeled, editable cell. Hardcoding numbers anywhere else in the model is a critical error (more on that in the mistakes section).
2. Revenue Model: Your bottoms-up revenue build, broken down by product line, pricing tier, and customer cohort. This tab feeds every other financial statement.
3. Headcount Plan: A role-by-role hiring schedule tied to revenue milestones, with fully-loaded costs (base salary plus benefits, payroll taxes, and equity, typically 1.2-1.3x base salary) calculated automatically.
4. Operating Expenses (OpEx): Every non-COGS expense category, from software subscriptions to office rent to marketing spend, organized by department.
5. Profit and Loss Statement (P&L): The income statement showing revenue, cost of goods sold (COGS, meaning the direct costs to deliver your product or service), gross profit, operating expenses, and EBITDA (Earnings Before Interest, Taxes, Depreciation, and Amortization, a proxy for operating cash generation).
6. Cash Flow Statement: The most important statement for early-stage investors. It shows when cash enters and leaves the business, revealing your actual burn rate and runway.
7. Balance Sheet: Assets, liabilities, and equity at each period end. Many founders skip this, but investors use it to verify that your three financial statements reconcile correctly.
A cap table summary (showing equity ownership by founder, employee option pool, and investors) belongs either as an eighth tab or embedded in the assumptions tab.

The 7 worksheets flow from left to right: assumptions drive revenue, which drives the P&L, cash flow, and balance sheet.
Building Your Revenue Projection: Bottoms-Up Methodology That Passes Due Diligence
A bottoms-up revenue projection starts from individual customer or transaction assumptions and builds up to total revenue. This approach is far more credible than top-down projections (taking a percentage of a large market), because every number can be traced back to a specific assumption you can defend.
Here’s the structure for a SaaS bottoms-up model:
Step 1: Define your acquisition channels. List each channel (paid search, content, outbound sales, partnerships) with its monthly budget or headcount allocation.
Step 2: Apply conversion rates. For each channel, estimate leads generated, lead-to-trial conversion rate, and trial-to-paid conversion rate. These should reflect your early traction data or credible industry benchmarks.
Step 3: Calculate new customers per month. Multiply leads by each conversion rate. This gives you new customers added each month by channel.
Step 4: Apply pricing tiers. If you have multiple plans (Starter at $49/month, Pro at $149/month, Enterprise at $499/month), estimate the mix of customers on each tier.
Step 5: Model churn. Monthly churn rate (the percentage of paying customers who cancel each month) is subtracted from your cumulative customer count. A 2% monthly churn rate equals roughly 22% annual churn, which is high for SaaS. Investors will benchmark your churn assumption against industry data.
Step 6: Calculate MRR and ARR. Monthly Recurring Revenue (MRR) equals active customers multiplied by average revenue per user (ARPU). Annual Recurring Revenue (ARR) equals MRR multiplied by 12.
Worked Example: SaaS Revenue Build for Month 6
Here’s the math for a simple SaaS model in Month 6:
- Paid search budget: $10,000/month, generating 500 leads at $20 CPL
- Lead-to-trial conversion: 10% = 50 trials
- Trial-to-paid conversion: 20% = 10 new paid customers
- Content/SEO: 5 additional organic customers
- Total new customers Month 6: 15
- Cumulative customers (after 2% monthly churn applied to prior months): 72
- ARPU (blended across tiers): $120/month
- MRR Month 6: 72 x $120 = $8,640
- ARR run rate: $8,640 x 12 = $103,680
Customer Acquisition Cost (CAC) for paid channel: $10,000 budget divided by 10 new customers = $1,000 CAC. If your average customer lifetime is 24 months at $120/month, Lifetime Value (LTV) = $2,880. LTV:CAC ratio = 2.88:1. Investors typically want to see LTV:CAC above 3:1 for SaaS businesses at Series A.
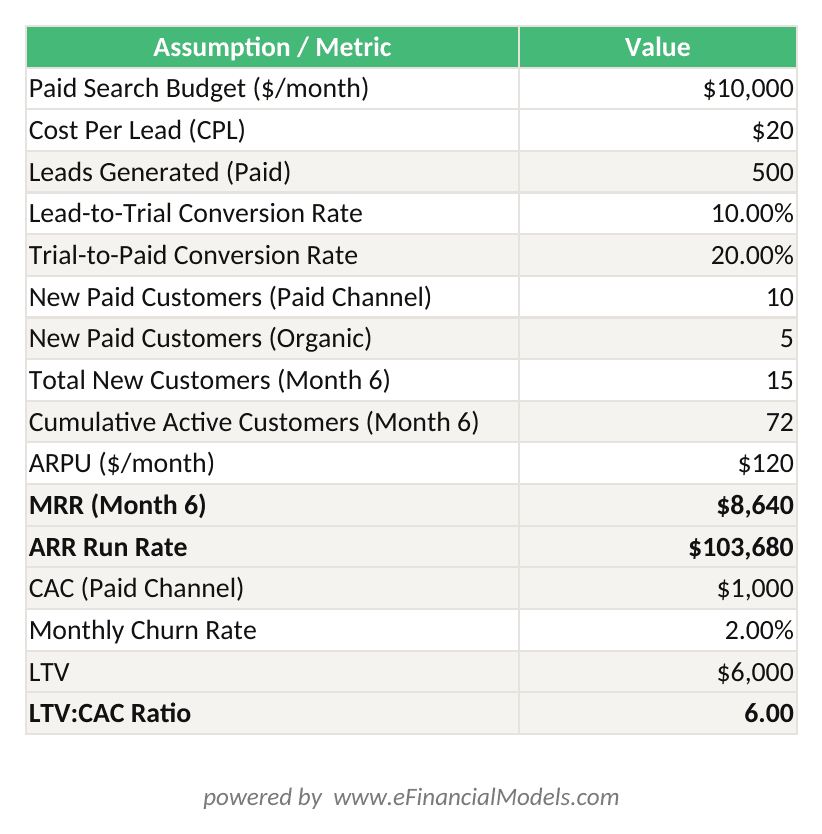
Month 6 SaaS model: 72 active customers × $120 ARPU = $8,640 MRR. CAC = $1,000. LTV = $6,000. LTV:CAC = 6:1.
Headcount Planning and Burn Rate: Connecting Hiring to Revenue Milestones
Headcount is typically the largest expense in an early-stage startup, and investors scrutinize it closely. Your hiring plan must be tied directly to revenue milestones, not to a calendar.
The right question isn’t “when should I hire a VP of Sales?” It’s “at what ARR level does a VP of Sales pay for themselves within 12 months?” A VP of Sales with a fully-loaded cost of $250,000 per year needs to generate at least $250,000 in incremental ARR to justify the hire at a 1:1 payback ratio. Most investors want to see a 2:1 or better ratio.
Burn rate (the net cash your company spends each month) equals total monthly expenses minus monthly revenue. Seed-stage startups should target 18-24 months of runway after each funding round, a guideline reinforced by accelerators such as Y Combinator.
The Federal Reserve’s 2023 Small Business Credit Survey found that 43% of small businesses that applied for financing cited insufficient cash flow as their primary challenge.
This reinforces why runway visibility matters to investors.
For your headcount plan, show each role with:
- Start month (tied to a revenue or product milestone)
- Base salary
- Fully-loaded cost multiplier (1.25x is a standard assumption for US-based employees)
- Department (Engineering, Sales, Marketing, G&A)
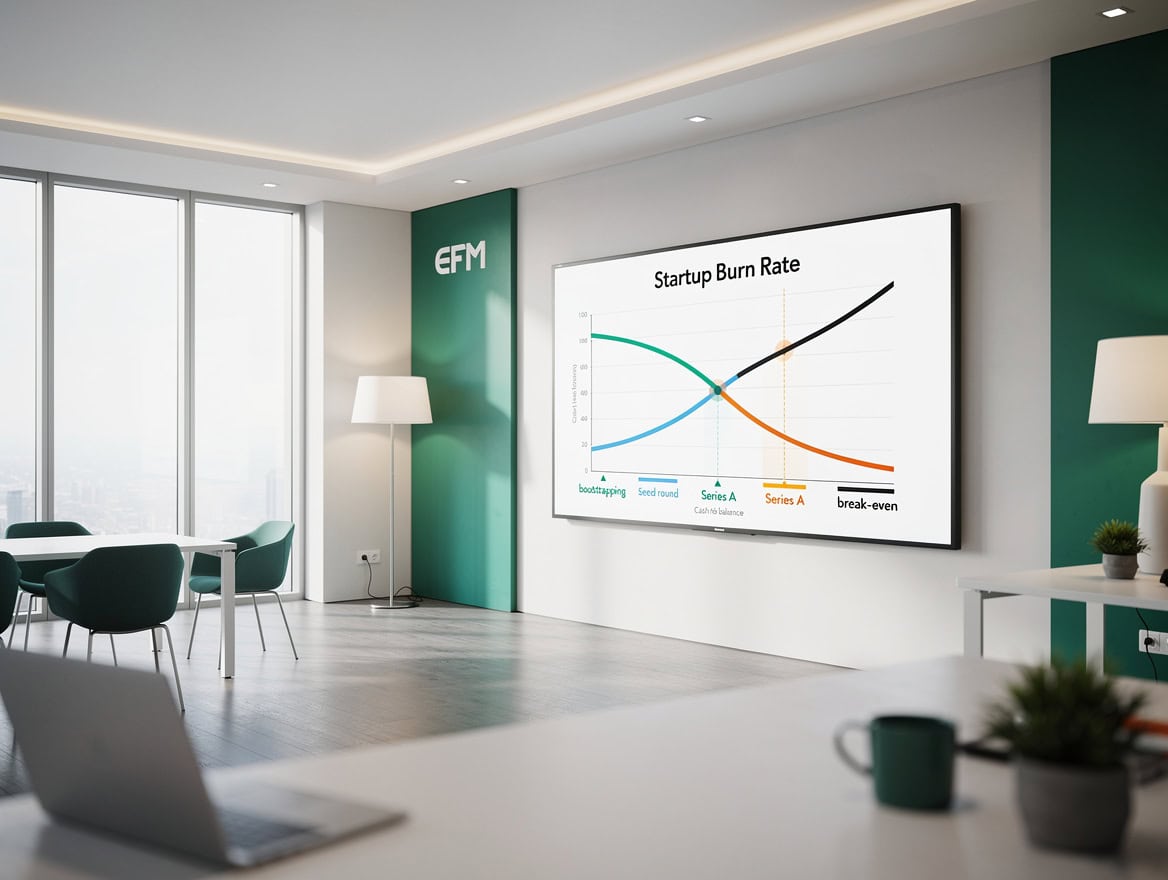
Each hire should be triggered by a revenue milestone, not a calendar date. This keeps burn rate predictable and defensible.
Operating Expense Categories Investors Expect to See
Investors expect your OpEx to be complete and organized by department. Missing expense categories are a red flag that signals you haven’t operated a business before.
The categories founders most commonly miss include:
- Payroll taxes and benefits: Add 15-20% on top of base salaries for employer-side payroll taxes, health insurance, and 401(k) matching.
- Software and SaaS tools: AWS, Salesforce, Slack, Notion, and similar tools add up quickly. Budget $500-$2,000 per employee per month for a typical tech startup.
- Legal and accounting: Expect $15,000-$30,000 per year for basic startup legal (contracts, IP, employment) and accounting.
- D&O insurance: Directors and Officers insurance becomes relevant at seed stage and costs $5,000-$20,000 per year.
- Customer success and support: If you’re building a SaaS product, budget for support headcount or tooling from Month 1.
| Expense Category | Typical % of Revenue (Seed Stage) | Investor Benchmark |
|---|---|---|
| R&D / Engineering | 40-60% | Acceptable up to 80% pre-revenue |
| Sales & Marketing | 20-40% | Should decline as % of revenue over time |
| G&A | 10-20% | Should stay flat or shrink as revenue scales |
| COGS (SaaS) | 20-30% | Implies 70-80% gross margin |
| COGS (Hardware) | 50-70% | Implies 30-50% gross margin |

Seed-stage SaaS startups typically spend 40-60% of revenue on R&D and 20-40% on sales and marketing before reaching profitability.
Key Financial Metrics and KPIs: Automatic Calculations Investors Will Verify
Your startup financial model template must automatically calculate these 8 KPIs. Investors will check every one of them, and if they have to calculate them manually, that’s a sign your model isn’t investor-ready.
- CAC (Customer Acquisition Cost): Total sales and marketing spend divided by new customers acquired in the same period.
- LTV (Lifetime Value): ARPU divided by monthly churn rate. For a $120/month product with 2% monthly churn: LTV = $120 / 0.02 = $6,000.
- LTV:CAC Ratio: LTV divided by CAC. The investor benchmark for SaaS is 3:1 or higher.
- Gross Margin: (Revenue minus COGS) divided by Revenue, expressed as a percentage.
- Burn Rate: Net cash outflow per month.
- Runway: Cash on hand divided by monthly burn rate, expressed in months.
- ARR Growth Rate: (Current ARR minus Prior Period ARR) divided by Prior Period ARR.
- CAC Payback Period: CAC divided by (ARPU multiplied by Gross Margin percentage), expressed in months. Investors want this below 18 months for SaaS.
EfinancialModels’ financial projections templates include automated KPI dashboards that calculate all 8 of these metrics dynamically as you update your assumptions.
All 8 KPIs must be automatically calculated from your model assumptions. Manual KPI updates are a red flag during due diligence.
Three-Scenario Modeling: Base, Conservative, and Optimistic Cases
Scenario modeling shows investors that you understand the risks in your business. Every startup financial model template must include three scenarios, each driven by a single toggle on the assumptions tab.
Base Case: Your most likely outcome, based on realistic assumptions grounded in early traction data or credible industry benchmarks. This is the scenario you present as your primary plan.
Conservative Case: Reduce your key growth drivers by 20-30%. If your base case assumes 15% monthly customer growth, the conservative case assumes 10-12%. This scenario should still show a path to profitability or a clear next funding milestone.
Optimistic Case: Increase key growth drivers by 20-30%. This scenario shows investors the upside potential if your product-market fit is stronger than expected.
The assumption documentation is as important as the numbers themselves. For each key assumption, note the source: is it based on your own A/B test data, a competitor’s public metrics, or an industry report? Investors who see documented assumptions trust the model more, even if the numbers are uncertain.
You can explore EFM’s forecasting templates to see how professional models structure scenario toggles and assumption documentation.
Scenario modeling with documented assumptions shows investors you understand your risk factors, not just your upside.
Fatal Financial Model Mistakes That Kill Investor Confidence
These 5 mistakes appear in the majority of first-time founder financial models and each one signals to investors that the founder hasn’t done the work.
Mistake 1: Hockey-stick projections without assumption logic. Revenue that grows 10x in Year 2 with no explanation of what changes is the single most common credibility killer. Every inflection point in your revenue curve needs a corresponding assumption: a new sales hire, a channel launch, a product expansion.
Mistake 2: Hardcoded numbers instead of formulas. If your model has numbers typed directly into cells rather than calculated from assumptions, investors can’t stress-test it. Every output cell must contain a formula referencing the assumptions tab.
Mistake 3: Circular references. A circular reference (a formula that refers back to itself, creating an infinite loop) causes Excel to display errors or incorrect values. This is an immediate signal that the model was built carelessly. Use Excel’s formula auditing tools to check for circular references before sharing.
Mistake 4: Unrealistic gross margins for your industry. A hardware startup projecting 80% gross margins, or a SaaS startup projecting 40% gross margins, will be questioned immediately. Know your industry benchmarks and either match them or explain specifically why your model differs.
Mistake 5: Missing the three-statement link. Your P&L, cash flow statement, and balance sheet must reconcile with each other. Net income from the P&L flows into retained earnings on the balance sheet. Cash from operations on the cash flow statement must match the change in cash on the balance sheet. If these don’t tie, investors will stop reading.
Making Your Model Pitch-Deck Ready: Executive Summaries and Visual Outputs
Your financial model is a working document, but your pitch deck needs a one-page summary that non-financial investors can absorb in 30 seconds. Build a dedicated “Dashboard” or “Summary” tab in your model that auto-populates from your three financial statements.
The one-page financial snapshot should include:
- A 5-year revenue and ARR chart
- Monthly burn rate and runway bar chart
- Key metrics table (CAC, LTV, LTV:CAC, gross margin) for each year
- Funding ask, use of proceeds, and projected milestones
All charts in this tab should be linked to your model data, not manually updated. When you change an assumption, every chart updates automatically. This prevents the common mistake of presenting slides with numbers that don’t match the model.
For industry-specific adjustments: SaaS models should emphasize ARR, net revenue retention (NRR), and cohort analysis. Marketplace models need gross merchandise value (GMV), take rate, and supply/demand-side CAC tracked separately. Hardware models require bill of materials (BOM) detail, manufacturing yield rates, and inventory financing assumptions.
EfinancialModels offers DCF model templates and KPI dashboard templates that connect directly to your financial projections for pitch-ready visual outputs.
Frequently Asked Questions
How many years should a startup financial model cover for an investor pitch?
A startup financial model for an investor pitch should cover 3 to 5 years. Year 1 must be monthly, because investors want to see your cash flow timing and burn rate month by month. Years 2 and 3 can be quarterly. Years 4 and 5 can be annual. Projections beyond 5 years are generally not credible for early-stage startups, because the uncertainty compounds too much to be useful. Most seed-stage investors focus primarily on your 18-24 month plan and use Years 3-5 to assess the scale of the opportunity. If your model only goes to 3 years, that’s acceptable for pre-seed, but Series A investors typically want to see a 5-year view to evaluate the return potential on their investment.
What is a realistic LTV:CAC ratio for a SaaS startup at seed stage?
At seed stage, investors typically accept an LTV:CAC ratio below 3:1 if you can demonstrate a clear path to improving it as you scale. The benchmark for Series A SaaS companies is 3:1 or higher, meaning the lifetime value of a customer is at least 3 times what it cost to acquire them. For example, if your CAC is $500 and your monthly ARPU is $100 with 2% monthly churn, your LTV is $100 divided by 0.02, which equals $5,000. Your LTV:CAC ratio is $5,000 divided by $500, which equals 10:1. That’s strong. If your ratio is below 1:1, you’re losing money on every customer you acquire, and investors will want to see a specific plan to fix that before funding.
What gross margin should I project for my SaaS startup?
SaaS startups should project gross margins between 70% and 80% at scale. In the early months, your gross margin may be lower (50-65%) because you haven’t yet optimized your cloud infrastructure costs or customer success headcount. Gross margin equals revenue minus COGS, divided by revenue. COGS for SaaS includes hosting costs (AWS, GCP, Azure), third-party API fees, and the cost of customer support directly tied to delivering the product. It does not include sales, marketing, or G&A expenses. If your SaaS gross margin is below 60% at scale, investors will ask why, and you need a specific answer: unusual data processing costs, a services component, or a marketplace element that reduces margin.
How do I calculate burn rate and runway for my pitch deck?
Burn rate is your net cash outflow per month: total cash spent minus total cash received. If you spend $150,000 per month and collect $30,000 in revenue, your net burn is $120,000 per month. Runway is your cash on hand divided by your monthly burn rate. If you have $1,200,000 in the bank and burn $120,000 per month, you have 10 months of runway. Investors want to see at least 18 months of runway after your funding round closes. That means if you’re raising $1,500,000 at a $120,000 monthly burn, you have 12.5 months of runway, which is below the 18-month benchmark. You’d either need to raise more, reduce burn, or show a clear path to revenue that extends runway.
What’s the difference between a bottoms-up and top-down revenue projection?
A top-down projection starts with a large market size and claims a percentage of it: “The market is $10 billion, and we’ll capture 1% in Year 3, giving us $100 million in revenue.” Investors almost universally dismiss this approach because it doesn’t explain how you’ll actually acquire customers. A bottoms-up projection starts from individual customer acquisition assumptions: how many leads your marketing generates, what percentage convert to paying customers, and what they pay. For example, if your paid search generates 200 leads per month, 10% convert to trials, and 25% of trials convert to paid customers, you add 5 new customers per month from that channel. Multiply by ARPU to get revenue. Bottoms-up projections are defensible because every number traces back to a specific assumption you can test and update.
Should I include a cap table in my startup financial model?
Yes, you should include at least a simplified cap table summary in your startup financial model. The cap table (capitalization table) shows who owns what percentage of the company: founders, employee option pool, and existing investors. Investors need this to understand the current ownership structure and to model their own ownership percentage post-investment. For a seed round, your cap table should show pre-money ownership percentages, the size of the employee stock option pool (typically 10-15% for seed stage), and the post-money ownership after the new round closes. A full cap table with all option grants and vesting schedules belongs in a separate document, but the summary belongs in your financial model. EFM’s investor-focused financial models include cap table summary tabs built for this purpose.
How do I handle uncertainty in my financial projections without losing investor confidence?
Handle uncertainty by building it into your model explicitly through scenario analysis rather than hiding it with overly precise numbers. Show three scenarios (conservative, base, and optimistic) with clearly documented assumptions for each. In your base case, use assumptions you can defend with data: your own early traction, competitor benchmarks, or industry reports. Acknowledge the key risks directly: “Our base case assumes 5% monthly churn. If churn reaches 8%, our runway shortens by 4 months, which is why we’re investing in customer success from Month 3.” Investors respect founders who understand their risks. The goal isn’t to project certainty; it’s to show that you’ve stress-tested your model and have a plan for the downside scenarios. Founders who demonstrate financial literacy and risk awareness raise funding at higher valuations than those who present only optimistic projections.
Conclusion
Building an investor-grade startup financial model template isn’t about predicting the future. It’s about demonstrating that you understand your business well enough to make informed decisions with investor capital. The 7 worksheets, bottoms-up revenue methodology, three-scenario structure, and automated KPI calculations covered in this guide are the minimum standard for a credible pitch.
I recommend downloading the EFM startup financial model template as your starting point. It includes all 7 required worksheets, pre-built formulas for CAC, LTV, burn rate, and runway, scenario toggle functionality, and a pitch-deck-ready dashboard tab. You’ll spend your time refining your assumptions rather than building spreadsheet infrastructure from scratch.
























































