
0 ITEMS

Seed Round Financial Model: 3 Types Investors Compare

The financial model you bring to a seed round can open a term sheet or end the conversation in the first meeting.
Key Takeaways
- The 3-statement integrated model (income statement, balance sheet, cash flow) is the standard for institutional seed funds, but an operating model alone satisfies most pre-revenue SaaS diligence.
- Seed investors examine 8-12 specific components: unit economics, runway, headcount plan, cohort revenue build, gross margin evolution, burn rate, break-even timeline, and assumption transparency.
- Hockey-stick revenue projections without customer acquisition math are the single most common reason seed investors lose confidence in a founder’s financial credibility.
- A competent operating model takes 20-40 hours to build from scratch; a quality template cuts that to 6-10 hours.
- Angels typically accept simplified pitch deck financials; institutional seed funds and micro-VCs expect a full operating model or 3-statement model in the data room.
- Founders targeting pre-revenue to $1M ARR should prioritize 18-month monthly projections over 5-year annual forecasts.
- The minimum viable financial model for seed fundraising includes a revenue build, a headcount plan, a burn rate schedule, and a runway calculation.
Which Financial Model Seed Investors Expect
Institutional seed investors expect a 3-statement integrated model for companies with revenue, and an operating model for pre-revenue startups. Simplified pitch deck financials are acceptable only for angel rounds or very early pre-seed checks below $250K.
The 3-statement model integrates three core financial documents: the income statement (profit and loss), the balance sheet (assets and liabilities), and the cash flow statement. These three statements link automatically so that a change in one assumption flows through all three. For a seed-stage company, this integration signals financial literacy to investors who have seen hundreds of decks.
Y Combinator’s publicly available guidance for founders states that investors want to see how you think about your business, not just the numbers themselves. First Round Capital has noted in its founder resources that the quality of assumptions matters more than the precision of outputs. These signals from top-tier seed funds confirm that model structure and assumption transparency outweigh forecast accuracy.
Roughly 42% of startups that fail cite running out of cash as a primary cause, according to the Kauffman Foundation.
A credible financial model is the tool that demonstrates you understand your cash position before investors hand you capital.
The Three Seed-Stage Model Types Compared
The three model types differ in scope, build time, and investor expectations. Choosing the wrong one wastes time or damages credibility.
| Model Type | Best For | Investor Expectation | Build Time (from scratch) | Build Time (with template) |
|---|---|---|---|---|
| 3-Statement Integrated | Revenue-stage, institutional seed funds | Required for Series A prep | 60-100 hrs | 15-25 hrs |
| Operating Model | Pre-revenue SaaS, marketplace, consumer | Standard for seed funds | 20-40 hrs | 6-10 hrs |
| Pitch Deck Financials | Angel rounds, pre-seed <$250K | Acceptable minimum | 4-8 hrs | 1-3 hrs |
The operating model (sometimes called a driver-based model) focuses on the business mechanics: how many customers you acquire, what they pay, what it costs to serve them, and how headcount scales with growth. It does not require a fully linked balance sheet, which makes it faster to build and easier for non-finance founders to maintain.
Pitch deck financials are summary slides showing 3-year revenue, gross margin, and burn. They work for angel conversations but will not survive a data room request from a seed fund. If a Sequoia scout or a Seedcamp partner asks for your model, they want an Excel or Google Sheets file, not a slide.
EFM’s startup financial models cover all three types with pre-built assumption tabs, scenario toggles, and auto-updating statements designed specifically for pre-revenue to $1M ARR companies.
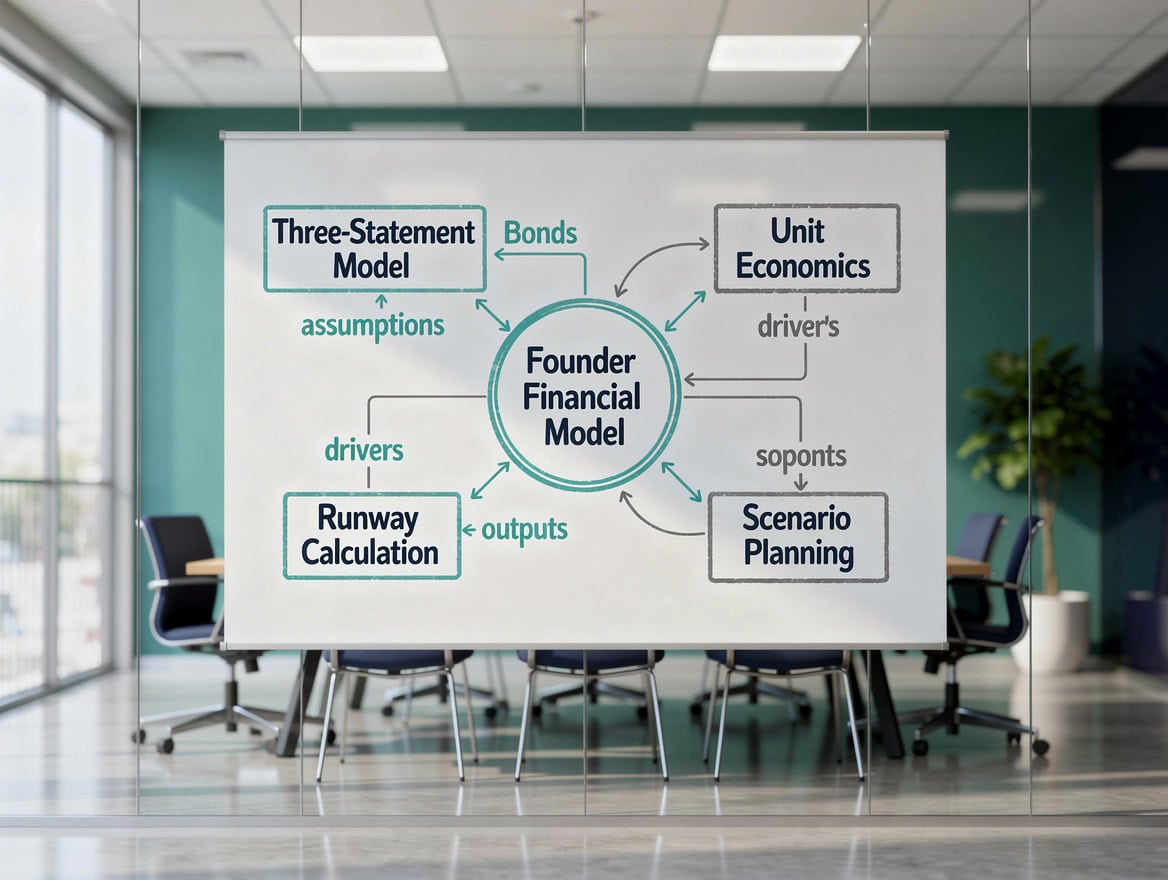
Operating models take 20-40 hours to build from scratch; templates cut that to 6-10 hours for most pre-revenue startups.
What Seed Investors Actually Examine in Your Financial Model
Seed investors focus on 8 specific areas when they open your model file. Founders who address all 8 move faster through diligence.
1. Unit Economics: Unit economics means the revenue and cost associated with a single customer. The two key metrics are Customer Acquisition Cost (CAC, the total sales and marketing spend divided by new customers acquired) and Lifetime Value (LTV, the average revenue per customer multiplied by average retention period). A healthy seed-stage SaaS business targets an LTV:CAC ratio above 3:1, a benchmark OpenView Partners documents in its SaaS metrics research.
2. Runway Calculation: Runway is the number of months your current cash balance covers at your current monthly burn rate. Investors calculate this themselves, so your model must show it explicitly. The formula is: Runway (months) = Cash Balance / Monthly Net Burn.
3. Headcount Plan: List every role you plan to hire, the month you plan to hire them, and their fully loaded cost (salary plus benefits plus payroll taxes, typically 1.2-1.3x base salary). Vague headcount assumptions are a red flag.
4. Revenue Build by Customer Cohort: A cohort is a group of customers acquired in the same time period. Showing revenue by cohort demonstrates you understand retention, expansion, and churn rather than just top-line growth.
5. Gross Margin Evolution: Gross margin is revenue minus cost of goods sold (COGS), expressed as a percentage of revenue. Investors want to see how margin improves as you scale. SaaS companies typically target 70-80% gross margins at maturity, according to benchmarking data from SaaS Capital.
6. Cash Burn Rate: Monthly burn rate is total cash out minus total cash in. Net burn is what matters for runway. Show both gross burn and net burn separately.
7. Break-Even Timeline: Identify the month when cumulative revenue covers cumulative costs. This does not need to happen within the model period, but investors want to see the trajectory.
8. Assumption Transparency: Every key input should live in a clearly labeled assumptions tab. Investors will change your numbers. If your model breaks when they do, you lose credibility instantly.

Seed investors open your model file and check these 8 areas first — missing any one of them slows or kills diligence.
Decision Framework: Choosing Your Model Type
Your model type choice depends on three variables: revenue status, target investor type, and industry vertical. Work through this decision tree before you build anything.
Step 1: What is your revenue status?
- No revenue yet: Build an operating model. A 3-statement model with no revenue history is mostly fiction and investors know it.
- $0-$500K ARR: Build an operating model with a linked cash flow statement. This is the minimum viable model for institutional seed funds.
- $500K+ ARR: Build a full 3-statement integrated model. You have enough history to make the balance sheet meaningful.
Step 2: Who is your target investor?
- Angel investors or friends-and-family: Pitch deck financials are sufficient.
- Micro-VCs and seed funds ($500K-$3M checks): Operating model required; 3-statement preferred.
- Institutional seed funds and strategic investors: Full 3-statement model expected in the data room.
Step 3: What is your industry vertical?
- SaaS: Operating model with MRR/ARR build, churn rate, and expansion revenue is the standard format.
- Hardware or deep tech: 3-statement model required because inventory, COGS complexity, and capital expenditure make the balance sheet material.
- Marketplace: Operating model with GMV (Gross Merchandise Value), take rate, and supply/demand side unit economics.
- Consumer app: Operating model with DAU/MAU (Daily/Monthly Active Users), ARPU (Average Revenue Per User), and cohort retention curves.
EFM’s financial projections templates include vertical-specific versions for SaaS, marketplace, and hardware companies, each with pre-configured assumption structures.
Worked Example: Runway Calculation for a Pre-Revenue SaaS Startup
Here’s the math for a startup raising a $1.5M seed round with a 6-person team.
Assumptions:
- Seed raise: $1,500,000
- Existing cash: $50,000
- Total cash after close: $1,550,000
- Monthly gross burn: $95,000 (salaries, software, office, marketing)
- Monthly revenue (Month 1): $0, growing to $25,000 by Month 12
- Average monthly net burn over 18 months: $82,000
Runway calculation:
- Simple runway (no revenue): $1,550,000 / $95,000 = 16.3 months
- Adjusted runway (with revenue ramp): $1,550,000 / $82,000 = 18.9 months
The difference between 16 and 19 months matters enormously. Investors want to see 18+ months of runway post-close. If your model shows 14 months, you either need to raise more, cut burn, or accelerate revenue. Showing this calculation explicitly in your model, with the revenue ramp visible by month, demonstrates exactly the kind of thinking seed investors reward.
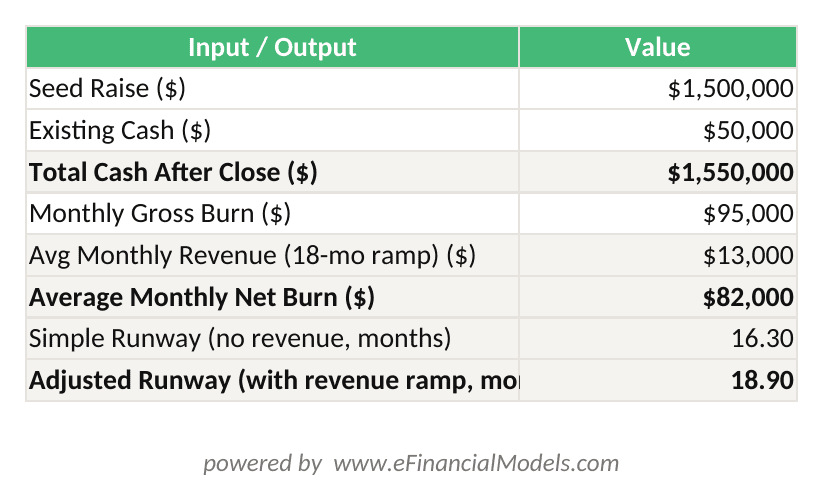
Runway = Total Cash / Average Monthly Net Burn. With a $1.55M cash position and $82K average net burn, this startup has 18.9 months of runway.
Common Modeling Mistakes That Damage Investor Credibility
Five specific mistakes appear repeatedly in seed-stage models that fail investor scrutiny. Each one has a direct fix.
Mistake 1: Hockey stick revenue without acquisition math. Revenue that doubles every quarter with no explanation of how many sales reps, what conversion rates, or what marketing spend drives it is the fastest way to lose a sophisticated investor. Fix: Build revenue from the bottom up. Start with leads, multiply by conversion rate, multiply by average contract value.
Mistake 2: Missing expense categories. Founders routinely omit payroll taxes (the employer share of Social Security and Medicare taxes, set by the IRS at 7.65%), software subscriptions, legal and accounting fees, and recruiting costs. Fix: Use a template with a pre-populated expense category list and add a miscellaneous buffer of 10-15%.
Mistake 3: Static headcount assumptions. Showing the same 6-person team for 36 months while revenue grows 10x is not credible. Fix: Build a headcount plan that adds roles in the month they are needed, tied to revenue or operational milestones.
Mistake 4: No sensitivity analysis. A sensitivity analysis (also called a scenario analysis) shows how key outputs like runway and break-even change when you adjust key inputs like churn rate or CAC. Without it, investors assume you have not stress-tested your own model. Fix: Add a simple 3-scenario toggle: base case, upside, and downside.
Mistake 5: Over-precision beyond 18 months. Monthly projections for Years 3-5 imply a level of certainty that no pre-revenue startup has. Investors know this and it signals naivety. Fix: Use monthly projections for Months 1-18, then switch to annual projections for Years 3-5.
Hockey-stick revenue without acquisition math is the fastest way to lose a sophisticated seed investor’s confidence.
Time Investment: Building vs Buying Your Seed Model
Building a seed-stage financial model from scratch takes significantly longer than most founders budget. A competent operating model requires 20-40 hours of focused work for a non-finance founder, based on typical project scoping data from fractional CFO engagements. A 3-statement integrated model takes 60-100 hours.
A quality template cuts those numbers by 60-75%. EFM’s startup financial model templates are pre-structured with assumption input separation, scenario planning, and auto-updating statements, reducing build time to 6-10 hours for an operating model.
When to hire a fractional CFO: Hire fractional CFO support if you are raising above $2M, targeting institutional investors with formal diligence processes, or if your business model has complex unit economics (hardware, marketplace, regulated industries). Fractional CFO engagements for seed-stage model builds typically run $3,000-$8,000 for a one-time project.
Minimum viable financial model concept: If you have less than two weeks before your first investor meeting, build the minimum viable model: a revenue build, a headcount plan, a burn rate schedule, and a runway calculation. That is four tabs. It is enough to have a credible conversation and buy time to build the full model.
How Your Financial Model Integrates With Your Pitch Deck
Your financial model is the source of truth for at least 4 slides in your pitch deck. Build the model first, then pull numbers into the deck. Microsoft Excel supports up to 1,048,576 rows and 16,384 columns per worksheet, as documented by Microsoft.
This means even the most granular monthly cohort model will never run out of space for your data.
- Financials slide: 3-year revenue, gross margin, and EBITDA (Earnings Before Interest, Taxes, Depreciation, and Amortization) projections pulled directly from your model’s summary tab.
- Use of funds slide: Headcount plan and expense categories from your model show exactly how the raise gets deployed.
- Unit economics slide: LTV, CAC, and payback period calculated in your model’s unit economics tab.
- Runway slide: Cash balance by month, showing the runway your raise provides.
When an investor requests your data room, they expect the Excel file that generated those deck numbers. If the deck shows $2.4M revenue in Year 2 but the model shows $1.9M, you have a credibility problem. Keep the model and deck in sync by updating the deck from the model, not the other way around. Excel’s maximum number of open workbooks is limited only by available memory and system resources, so linking your deck source file to your model file is a practical workflow for keeping both in sync.
EFM’s financial feasibility templates include a summary output tab formatted to match standard pitch deck financial slides, so the numbers transfer cleanly.

Build the model first, then pull numbers into the deck — mismatches between model and deck are an immediate credibility red flag.
Template Selection Criteria and Feature Checklist
Not all seed-stage financial model templates are equal. Use this checklist when evaluating any template.
Must-have features:
- Separate assumptions input tab (all inputs in one place, no hardcoded numbers in formula cells)
- Monthly projections for at least 18 months
- Scenario toggle (base, upside, downside) that updates all outputs automatically
- Revenue build by customer cohort or product line
- Headcount plan with fully loaded cost calculation
- Runway calculation that updates dynamically with cash balance
- Gross margin build showing COGS by category
- Auto-linked income statement, cash flow statement, and balance sheet (for 3-statement models)
Nice-to-have features:
- Cap table integration showing dilution by round
- KPI dashboard with charts for investor presentations
- Sensitivity analysis table for key metrics
- Data room export formatting
EFM’s general Excel financial models and startup financial model templates meet all must-have criteria and include cap table integration and KPI dashboards.
Frequently Asked Questions
What financial model do seed investors actually want to see?
Most institutional seed investors want an operating model at minimum, and a 3-statement integrated model for companies with existing revenue. The operating model should include a bottom-up revenue build, a headcount plan with fully loaded costs, a monthly burn rate schedule, and a runway calculation showing 18+ months post-close. Angels and pre-seed investors typically accept simplified pitch deck financials showing 3-year revenue, gross margin, and burn. The key distinction is investor type: a micro-VC writing a $750K check will ask for your Excel file; an angel writing a $50K check usually will not.
How many months of projections should a seed-stage model cover?
A seed-stage financial model should show monthly projections for 18 months and annual projections for Years 3-5. Monthly detail for the first 18 months gives investors visibility into your cash position, hiring timeline, and revenue ramp. Annual projections beyond that are directional only. Avoid monthly projections for Years 3-5 because they imply false precision. Investors who have reviewed hundreds of seed models know that monthly accuracy beyond 18 months is not achievable for early-stage companies, and over-precision signals inexperience rather than rigor.
What is the minimum viable financial model for a seed round?
The minimum viable financial model for a seed round contains four components: a revenue build (showing how you get from zero to your Year 1 target, customer by customer or cohort by cohort), a headcount plan (every role, hire date, and fully loaded cost), a burn rate schedule (monthly cash out by category), and a runway calculation (cash balance divided by monthly net burn). This four-tab structure takes 6-10 hours to build with a quality template and is sufficient for an initial investor conversation. You can add scenario analysis and a full 3-statement model as diligence progresses.
How long does it take to build a seed-stage financial model?
Building a seed-stage operating model from scratch takes 20-40 hours for a non-finance founder. A full 3-statement integrated model takes 60-100 hours. Using a pre-built template cuts those times by 60-75%, bringing an operating model to 6-10 hours and a 3-statement model to 15-25 hours. The time investment depends heavily on business model complexity: a simple SaaS model with one pricing tier takes far less time than a marketplace model with supply-side and demand-side economics. If you have less than two weeks before investor meetings, start with the minimum viable model and expand it during diligence.
What is the difference between an operating model and a 3-statement model?
An operating model (also called a driver-based model) focuses on the business mechanics: customer acquisition, pricing, COGS, headcount, and burn rate. It produces an income statement and a cash flow statement but does not require a fully linked balance sheet. A 3-statement integrated model links all three financial statements: income statement, balance sheet, and cash flow statement. Changes to any assumption flow automatically through all three. The 3-statement model is more complex to build but is required for companies with meaningful assets, debt, or inventory, and is expected by institutional investors preparing for Series A diligence.
Should I hire a fractional CFO to build my seed model?
Hire a fractional CFO if you are raising above $2M from institutional investors, your business model has complex unit economics (hardware, regulated industries, multi-sided marketplaces), or you have less than 2 weeks to prepare and no finance background. Fractional CFO project engagements for seed-stage model builds typically cost $3,000-$8,000 for a one-time deliverable. For founders raising $500K-$1.5M from angels or micro-VCs, a quality template combined with 8-10 hours of focused work is usually sufficient. The decision rule is simple: if the cost of a bad model exceeds the cost of professional help, hire the help.
What unit economics metrics do seed investors care most about?
Seed investors focus on four unit economics metrics: Customer Acquisition Cost (CAC, total sales and marketing spend divided by new customers acquired in the same period), Lifetime Value (LTV, average monthly revenue per customer multiplied by average customer lifespan in months), LTV:CAC ratio (healthy seed-stage SaaS targets 3:1 or above), and CAC payback period (the number of months of gross profit needed to recover the cost of acquiring one customer, with under 18 months considered strong for SaaS). These four metrics tell investors whether your growth is economically sustainable before you have enough data to prove it empirically.
Conclusion
The best financial model for seed round fundraising is the one that matches your revenue stage, your target investor type, and your industry vertical. Pre-revenue SaaS founders targeting micro-VCs need a solid operating model with 18 months of monthly projections. Revenue-stage founders targeting institutional seed funds need a full 3-statement integrated model. Angels accept simplified pitch deck financials. Every seed model, regardless of type, must include unit economics, a headcount plan, a burn rate schedule, and a runway calculation.
I recommend downloading EFM’s startup financial model template built specifically for pre-revenue to $1M ARR companies. It includes pre-configured assumption tabs, a 3-scenario toggle, cohort revenue build, headcount planning, and auto-updating financial statements, everything a seed investor’s data room request will require, ready in hours rather than weeks.
























































